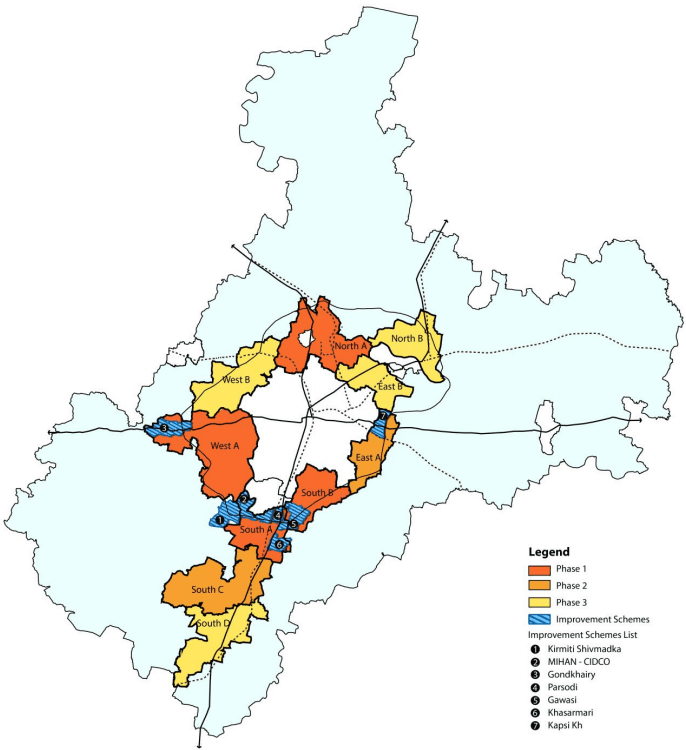
The total land zoned under urban uses in 10 urban sectors is about 60,500 hectare. It will not be feasible to service such a large area with physical and social infrastructure all at once. Broad phasing is necessary so that proposals can be prioritised for implementation in areas where development is likely to be located in the first few years of the plan period.
14.4.1 Timeline for Phasing the Plan Proposals
Broadly, the following timeline is considered for planning proposals (see
14-6
Figure 14-2).
Phase 1: 8 years (2012-2019)
Phase 2: 7 years (2020-2026)
Phase 3: 5 years (2027-2032)
14-7
Figure 14-2: Development phasing
14.4.2 Phase 1
Sectors West A, South A and South B comprise areas where majority NA permissions, layout and building permissions are located at present. These three sectors are thus identified as priority areas for provision of infrastructure and cover an area of about 19,887 hectare.
Among all three phases, the first phase is considered to be of the longest duration of 8 years. This is based on the consideration that significant period of time will be required for setting up the institutional structure and streamlining mechanisms for implementation of proposals by the NIT.
14-8
14.4.3 Phase 2
The second phase for infrastructure provision is considered to comprise of areas in sectors East A, South C, North A, together covering an area of about 19,227 hectare.
14.4.4 Phase 3
The last phase for provisioning infrastructure will include sectors West B, South D, East B and North B. These sectors cover an area of about 21,376 hectare.
14.3Block Cost Estimates
14.3.1 Summary of Block Costs
A summary of costs for all outlined proposals under broad categories is given in the Table 14-1. This includes all physical and social infrastructure items for Urban Sectors.
In case of roads, it includes all proposed roads in the NMA – within Urban Sectors and Regional roads. Similarly, as described in the previous chapter 12, certain reservations such as jail, solid waste disposal site are located outside of Urban Sectors.
14.3.2 Cost Components Excluded
Cost of private land for roads is not included in Table 14-2, as land will be made available through grant of TDR. Similarly development of solid waste processing and disposal facility will be implemented through the PPP mode and is not included in the cost estimates. Also, cost for mass rapid transit (metro rail) on southern corridor is not included as this is a special project with complex financing mechanisms depending on feasibility and detailed studies.
14-2
Table 14-2Summary of block costs
Description
Cost of private land (INR crores)
Development cost (INR crores)
Total cost (INR crores)
Roads
*
12,680.0
12,680.0
Other transport infrastructure
194.4
212.1
406.5
Social amenities
244.9
3,859.4
4,104.3
Open Spaces
661.0
937.5
1,598.5
Water supply
11.5
5,649.0
5,660.5
Sewerage
15.7
4,199.6
4,215.3
Storm water drainage and RWH
-
5,479.2
5,479.2
Power
21.0
-
21.0
Solid waste management
10.3
5.1
15.4
Affordable housing
88.5
1,035.7
1,124.1
Subtotal
1,247.2
34,057.5
35,304.8
Additional 5% administration costs
1,765.24
Total
37,070.02
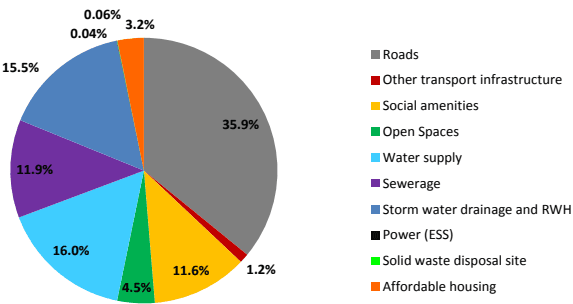
Figure 14-1 illustrates the share of percent costs by type of proposals.
Figure 14-1 : Share of percent costs by type of proposals
14.3.3 Block Costs for Social Amenities and Public Facilities
Block costs for development of proposed social amenities is given in the Table 14-3.
Table 14-3Block costs for social amenities and open spaces proposals
S. No
Description
Private land cost
Development
Total cost
14-3
(INR crores)
cost (INR crores
(INR crores)
1
Education (Primary and secondary schools)
62.1
404.2
466.3
2
Medical
38.9
354.0
392.9
3
Open space/ recreational
661.0
937.5
1,598.5
4
Cultural (community halls, libraries, auditoria)
22.7
119.0
141.7
5
Commercial
38.0
1,105.2
1,143.2
6
Public utility facilities
25.6
174.7
200.3
7
District court complex
1.4
-
1.4
8
Jail
9.5
205.0
214.5
9
Exhibition Center
11.6
1,012.5
1,024.1
10
Sports Complex
35.1
484.8
519.9
Total
905.9
4,796.9
5,702.8
14.3.4 Block Costs for Transportation Infrastructure
Block costs for development of proposed transportation infrastructure is given in the Table 14-4.
Table 14-4Block costs for transportation infrastructure proposals
S. No
Description
Quantity Land (hectare)
Quantity- BUA (Sq.m)
Cost (Rs. crores)
1
Roads
*
12,680.0
12,680.0
2
Truck Parking
159.9
108.4
268.3
3
Public parking
11.6
79.1
90.7
4
Public transportation
0.0
0.0
0.0
5
Bus depots Total
22.9194.4
24.612,892.1
47.513,086.5
*Note: Cost of private land for roads not included as the land will be made available through TDR
14.3.5 Block Costs for Water Supply Infrastructure
Block costs for water supply proposals are given in Table 14-5 to Table 14-7.
Table 14-5Block costs for water treatment plant
S No
Description
Quantity - Land (hectare)
Quantity - MLD
Cost (INR crore)
1.2.
Private land Capacity augmentation of
0
-
0
Mahadula WTP
197.46 MLD
296.19
Total
296.19
Table 14-6Block costs for water distribution network within urban sectors
S. No
Description
Quantity
Land Cost (INR Crore)
Development Cost (INR Crores)
1
Length of rising mains from WTP to ESR
130 km
41.22
2
Private land for ESR in 10 Urban Sectors
7.83
11.51
14-4
S. No
Description
Quantity
Land Cost (INR Crore)
Development Cost (INR Crores)
3
Distribution network (based on area covered by Urban Sectors)
53,500
5285.8
Total
11.51
5,338.53
*Note: 1. Water supply distribution networks will run along the proposed roads. As the road network is not provided up to plot level, block costs for the distribution network are given based on area covered by urban uses within urban sectors.
Table 14-7Block costs for recycled water network
S. No.
Description
Quantity
Cost (INR crore)
1.
Network length for supplying recycled water to industrial zones in the NMA
14.3.6 Block Costs for Sewerage Proposals
Block costs for sewerage proposals are given in Table 14-8.
Table 14-8Block costs for sewerage proposals
S. No
Description
Quantity
Land cost (INR Crores)
Development Cost (INR. crores)
1
Network
53,500
3,964.35
2
STPs (SBR technology, including tertiary treatment)
15.99 ha
15.72
209.42
Total
15.72
4,173.77
*Note: Sewerage networks will run along the proposed roads. As the road network is not provided upto plots, block costs for the sewerage network is given based on area covered by urban uses within urban sectors.
14.3.7 Block Costs for Storm Water Drainage and Rain Water Harvesting Proposals Block costs for sewerage proposals are given in Table 14-9.
Table 14-9Block costs for storm water drainage proposals
S No
Description
Quantity (hectare)
Development Cost (INR crore)
1.
Storm water collection network
53,500
1,982.18
2.
Rain water harvesting system along with grit chamber Total
30925,074.18
14-5
14.3.8 Block Costs for Solid Waste Management Proposals
Cost of private land for solid waste processing and disposal site is given in Table 14-10.
Table 14-10Block costs for MSW processing and disposal site
Sr. No
Description
Land Cost (Rs. crores)
1
Cost of private land for waste processing and disposal site
9.31
2
Cost of private land for Transfer station at 4 locations
0.99
Total
10.30
14.5Financing the Development Plan and Priority Proposals
14.5.1 NIT’s Finances
NIT’s sources of financing are largely defined in the NIT Act. Majority of Revenue Income for NIT comes from own sources which comprise of (a) charges for various permits and services and auction of plots/layouts in the peripheral areas (b) interest on investments, (b) ground rent from layouts planned by NIT, (c) renting of machinery and (d) fees for HUDCO scheme (e) securing funds from the open market through direct debt exposure or through issuance of Bonds
NIT will have to explore various mechanisms for revenue generation in order to fund infrastructure development. The Annexure 19 gives a snapshot of the income expenditure statement of NIT for a period between 2006-07 and 2011-12.
14.2Assumptions for Calculation of Costs
14.2.1 Land Costs
Land costs for privately owned land parcels on which reservations are located have been calculated on the basis of the Ready Reckoner 2013 procured from the office of the Joint Registrar, Nagpur District. Costs for land under government ownership are not included in the cost estimates.
14.2.2 Construction Costs
Broad average cost of construction is considered based on prevalent construction rates. Development costs are considered for all reservations irrespective of ownership.
Medical facilities –Rs. 18,000/m2
Sports complex – Rs. 15,000/m2
Schools – Rs. 12,000/sqm2
All other buildings – Rs. 10,000/m2
14.2.3 Landscaping and Land Development Costs
Broad average landscaping costs for gardens and parks and land development costs for playgrounds is considered.
Parks, gardens – Rs. 2,000/m2
Playgrounds – Rs. 750/m2
14-3
The block costs are indicative and all proposals will require feasibility studies and/ or detailed project reports before detailed costs can be calculated.
14.2.4 Road construction costs
A key assumption with regard to cost of roads is that land will be secured using the Transfer of Development Rights (TDR) mechanism. In most cases only a small part of a parcel would be affected due to a new road. Moreover the benefits on account of increased land rates for a road fronting property outweigh the actual value of land that has to be given up for construction of a road.
Cost per kilometre considered for each type of road right of way is as given in Table 14-1.
Table 14-1Cost Assumptions for Construction of Roads
Sr No
Road Right of Way
Cost per km (INR Crores)
1
12m - Urban road
2.16
2
12m - Rural road
2.28
3
15m - Urban road
2.92
4
15m - Rural road
2.41
5
18m - Urban road
3.76
6
18m - Rural road
2.34
7
24m - Urban road
5.06
8
24m - Rural road
4.51
9
30m - Urban road
6.35
10
30m - Rural road
4.63
11
36m - Urban road
8.51
12
36m - Rural road
7.03
Chapter 14Development Plan Costs and Financing
14.1 Introduction
The previous Chapter 13 describes the planning proposals outlined for the NMA Development Plan. In this chapter block estimates for each proposal is presented.
Broad assumptions employed for calculation of costs is provided at the outset. A combined summary of costs by category of proposals precedes detailed tables describing the components and corresponding costs for each proposal.
Mechanisms for implementation of the plan proposals are closely linked with the cost estimates. Adoption implementation mechanisms such as PPP and Accommodation Reservation for certain suitable projects can result in reduction in the overall costs to be directly borne by the planning authority. The resulting remaining projects that would be funded through revenues generated by the planning authority are referred as priority projects. After exclusion of projects that could be funded using alternative mechanisms, the resulting cost of ‘priority projects’ will be lower than the total cost of DP proposals. Revenues that could be generated by NIT while administering the DP as the SPA have also been estimated and presented in this Chapter.
29.81 km
10.00
2.
Network length for supplying recycled water to power plants
45.25 km
15.79
Total
25.79
14.5.2Priority Project Costs and Phasing to Accelerate Growth
Mechanisms for implementation of the plan proposals are closely linked with the cost estimates. Adoption implementation mechanisms such as PPP and Accommodation Reservation for certain suitable projects can result in reduction in the overall costs to be directly borne by the planning authority. The resulting remaining projects that would be funded through revenues generated by the planning authority are referred as priority projects. After exclusion of projects that could be funded using alternative mechanisms, the resulting cost of ‘priority projects’ will be lower than the total cost of DP proposals.
The costs for priority projects that should be taken up to boost the realisation of the underlying Vision of the Development Plan have been identified. These costs have been identified based on the following considerations:
NIT will only focus on internal and key urban roads that can boost growth in the target urban areas. Any other major regional roads will be developed by the relevant agency;
For Social Amenities, as far as is possible, NIT will encourage private sector participation and will also tap funds through Corporate Social Responsibility programmes of various entities. NIT may actively seek donations for development of specific facilities such as community centres, auditoriums, hospitals etc.
Rural healthcare infrastructure will be developed through the National Rural Health Mission or similar health sector programmes that focus upon the rural sector.
14-9
Facilities like sports complex can be developed on BOT basis, Accommodation Reservation or through donations sought to fund construction costs.
Affordable housing can be implemented on PPP basis. Land owners of the reserved parcels can choose to be partners in developing these projects.
Thus, the actual costs to NIT have been rationalised in order to optimise the capital deployment by NIT (See Table 14-11).
Table 14-11Priority Project Costs
S. No.
Sector
Cost of Priority Projects (in INR Crores)
1
Roads
3,841.5
2
Other transport infrastructure
291.2
3
Social amenities
1,686.24
4
Open Spaces
1,129.73
5
Water supply
3,656
6
Sewerage
2,742
7
Storm water drainage and RWH
1,371
8
Solid waste management
10
9
Affordable housing
88.5
10
Sub-Total
14,815.6
11
Administrative Costs (@ 5% of total Costs) Grand total
74115,556
The total costs for priority projects is INR. 15,556 Crores which also accounts for administrative expenses of Rs. 741 Crores. Wet utilities (includes water supply, sewerage and storm water drainage) together constitute approximately a little over half (52%) of the total proposed investments. Roads will require roughly 26% of the total costs, while social amenities will require approximately 11% of the total investments proposed.
The costs have been further broken down into three phases so that NIT can focus on providing incremental infrastructure over time maintaining a balance between infrastructure provisioning and population growth.
Table 14-12Phasing of Priority Project Costs
Sr.No.
Sector
Phase 1 Costs(in INR Crores)
Phase 2 Costs(in INR Crores)
Phase 3 Costs(in INR Crores)
Total Costs (in INR Crores)
1
Roads
1870
708
1262.5
3840.5
2
Other transport infrastructure
145.6
61.1
84.4
291.1
3
Social amenities
978.0
269.8
438.4
1686.2
4
Open Spaces
655.2
180.8
293.7
1129.7
5
Water supply
1,645.0
731.1
1,279.5
3,655.6
6
Sewerage
1233.8
548.3
959.6
2741.7
14-10
Sr.No.
Sector
Phase 1 Costs(in INR Crores)
Phase 2 Costs(in INR Crores)
Phase 3 Costs(in INR Crores)
Total Costs (in INR Crores)
7
Storm water drainage and RWH
616.9
274.2
479.8
1370.9
8
Power
0
0
0
0
9
Solid waste management
10
0
0
10
10
Affordable housing
22.12
22.12
44.24
88.48
11
Sub-Total
7,176.62
2795.42
4,842.14
14,814.18
11
Administrative Costs (@ 5% of total)
359
140
242
741
Grand total
7535.62
2935.42
5084.14
15,555.18
The Phase 1 envisages Rs. 7535 Crores; Phase 2 envisages Rs. 2935 Crores and Phase 3 envisages Rs. 5084 Crores as the total investment. The total investment envisaged is Rs. 15,556 Crores.
14.5.3Revenues likely to Accrue to NIT
Given that the NIT is a “Special Planning Authority” and not an urban local body, the revenue raising powers will be limited. While the MRTP Act and the NIT Act provide that NIT will have to provide various infrastructure services, they do not have provisions enabling NIT to charge for services such that costs can be recovered. The current provisions for revenue raising are limited to (a) development charges, (b) planning/building permission fees and (c) fees for premium FSI.
The most suitable option for NIT to carry out future development and implement projects is to utilise the Improvement Scheme mechanism. Under this framework, NIT will be able to generate adequate development charges that will allow it to (a) fund capital expenditure and (b) fund operation & maintenance expenditure for a suitably longer period. In case of special projects, NIT can solicit government grants.
The key instruments for generation of additional revenues are levy of development charges and premium on additional FSI. These are described below.
14.5.2.1 Revenue through grant of additional FSI on payment of premium
Development in the NMA will be controlled on the basis of permissible base FSI in the demarcated land use zones. There is provision to allow for grant of additional FSI in zones which are primarily intended for urban development. It is expected that primarily, demand for additional FSI on payment of premium will be primarily sought in the residential and commercial zones. Moving forward this is expected to be a major source of revenue for NIT, which can be utilised for undertaking infrastructure development projects in the NMA.
For the calculation of revenues through grant of additional FSI, the Annual Schedule of Rates in for villages in a sector are averaged to ascertain the applicable rates of that sector.
14-11
Permissible FSI for a subject plot is based on the land use of that plot. Additional FSI can be loaded on the plot by payment of premium which is computed as per the directive of Director, Town Planning Maharashtra State as a percent of the Annual Schedule of Rates. Amount of land considered excludes existing developed areas.
Table 14-13Sector wise distribution of land area
Total Land
Area (sq. km)
Sector
SDRR Rates
R1
R2
R3
R4
Commercial
Industrial
North A
2800
1.01
0.28
12.01
1.76
0.36
14.4
North B
1800
0.83
1.26
0.62
6.38
0.11
1.0
South A
5400
2.84
5.04
2.49
5.39
0.96
0.2
South B
3100
1.61
6.26
4.20
14.67
0.22
1.2
South C
2400
1.48
5.29
1.10
2.38
0.08
22.4
South D
5600
0.77
3.19
0.00
12.17
0.50
13.5
East A
3900
7.27
3.86
2.59
8.24
0.62
5.6
East B
3400
1.11
5.49
13.51
0.80
0.72
0.2
West A
3500
1.96
8.55
10.81
11.38
1.65
23.7
West B
2600
0.19
0.03
3.54
9.20
0.43
1.4
Total
19.1
39.3
50.9
72.4
5.7
83.7
* Note: note regarding the explanation for 50% area taken from the actual zoning provided needs to be added.
Table 14-14Allowable base FSI and additional FSI on payment of premium
Zone
R1
R2
R3
R4
Commercial
Industry
Allowable base FSI Additional premium FSI
1.250.7
10.7
0.750.7
0.50.7
1.251
1
Premium rate as % of SDRR
60%
60%
60%
60%
80%
70%
FSI computation is done on net plot area which is area after deducting recreational ground to the extent of 25%, on an average. Effectively FSI is computed on 75% of the total plot area.
14-12
Table 14-15Calculation of built up area for base FSI (million sq. ft)
Sector
R1
R2
R3
R4
Commercial
Industrial
North A
0.95
0.21
6.76
0.66
0.33
10.83
North B
0.78
0.95
0.35
2.39
0.10
0.76
South A
2.66
3.78
1.40
2.02
0.90
0.17
South B
1.51
4.69
2.36
5.50
0.21
0.88
South C
1.39
3.97
0.62
0.89
0.08
16.78
South D
0.72
2.39
0.00
4.56
0.47
10.10
East A
6.82
2.90
1.46
3.09
0.58
4.23
East B
1.04
4.12
7.60
0.30
0.68
0.13
West A
1.84
6.41
6.08
4.27
1.55
17.81
West B
0.18
0.02
1.99
3.45
0.41
1.07
Total
17.88
29.44
28.62
27.13
5.30
62.75
Premium FSI Built up Area = (Plot Area – Recreational Ground)* Premium FSI
Additional built up area over and above the base FSI can be loaded on the plot by payment of premium which is charged as a fixed percent of the SDRR Rates.
Table 14-16Calculation of built up area for additional FSI on payment of premium (mn. sqft)
Sector
R1
R2
R3
R4
Commercial
Industrial
North A
0.5
0.1
6.3
0.9
0.3
0.0
North B
0.4
0.7
0.3
3.3
0.1
0.0
South A
1.5
2.6
1.3
2.8
0.7
0.0
South B
0.8
3.3
2.2
7.7
0.2
0.0
South C
0.8
2.8
0.6
1.2
0.1
0.0
South D
0.4
1.7
0.0
6.4
0.4
0.0
East A
3.8
2.0
1.4
4.3
0.5
0.0
East B
0.6
2.9
7.1
0.4
0.5
0.0
West A
1.0
4.5
5.7
6.0
1.2
0.0
West B
0.1
0.0
1.9
4.8
0.3
0.0
Total
10.0
20.6
26.7
38.0
4.2
0.0
Premium Receivable = Additional Built up Area * SDRR * Applicable percent
The values calculated below denote the potential revenue receivable from premiums and is subject to the willingness of the developer to opt for additional FSI and extent of development undertaken in the sectors. Development will be spread across a few decades and ready reckoner rates will undergo changes in turn affecting the revenue from the payment of premium.
14-13
Table 14-17Premium receivable on additional FSI (INR Crores)
Sector
R1
R2
R3
R4
Commercial
Industrial*
Total
North A
89
24
1059
155
60
0
1,387
North B
47
72
35
361
12
0
527
South A
482
857
424
917
311
0
2,991
South B
157
611
410
1,432
41
0
2,652
South C
112
400
83
180
12
0
787
South D
136
563
0
2,147
168
0
3,014
East A
893
474
318
1,012
145
0
2,843
East B
119
588
1,447
86
147
0
2,386
West A
216
943
1,192
1,254
347
0
3,951
West B
15
2
290
754
68
0
1,129
Total
2,268
4,535
5,259
8,298
1,310
0
21,669
* Premium from industrial land is not considered in this table as it is unlikely that excess FSI would be needed for industrial development. This means that premium that can be potentially received from IT parks, Bio-tech parks is not included and will be over and above the estimated revenues in the above table.
14.5.2.2 Revenue through levy of development charges
Development charges are paid by the builder to the authority while starting a project. The development charges are levied for provision of essential services such as water supply, sewerage etc. The NIT will levy development charges based on the Government of Maharashtra notifications from time to time.
Development charges are calculated on the total construction area. The current rates applicable in Nagpur City are given in the table below.
Table 14-18Applicable development charges (as on December 2013)
Land use
Rate per sqm (INR) for Land
Rate per sqm (INR) for Building
Residential
60
60
Industrial
90
90
Commercial
120
120
The FSI built up area calculated above is increased by a factor of 25% to arrive at the construction area. The FSI built up area includes the construction in the entire building envelope excluding building services, amenities and basement, stilt, podium and open parking. The developer must undertake the construction of these areas along with the FSI built up area. Amount of land considered excludes existing developed areas.
Table 14-19Calculation of construction area for levy of development charges (mn. Sq ft)
Sector
R1
R2
R3
R4
Commercial
Industrial
North A
1.7
0.4
15.3
1.9
0.7
13.5
North B
1.4
1.8
0.8
6.9
0.2
0.9
14-14
Sector
R1
R2
R3
R4
Commercial
Industrial
South A
4.7
7.4
3.2
5.9
1.8
0.2
South B
2.7
9.2
5.4
16.0
0.4
1.1
South C
2.4
7.7
1.4
2.6
0.2
21.0
South D
1.3
4.7
0.0
13.2
0.9
12.6
East A
12.0
5.6
3.3
9.0
1.2
5.3
East B
1.8
8.0
17.2
0.9
1.4
0.2
West A
3.2
12.5
13.8
12.4
3.1
22.3
West B
0.3
0.0
4.5
10.0
0.8
1.3
Total
31.5
57.4
64.9
78.7
10.6
78.4
Development Charges(Land) = Land Area * Development Charges R a t e ( L a n d )
Development Charges (Building) = Construction Area * Development Charges Rate (Building)
Table 14-20Estimated development charges for land area (INR Crores)
Sector
R1
R2
R3
R4
Commercial
Industrial
North A
6
2
72
11
2
87
North B
5
8
4
38
1
6
South A
17
30
15
32
6
1
South B
10
38
25
88
1
7
South C
9
32
7
14
1
134
South D
5
19
0
73
3
81
East A
44
23
16
49
4
34
East B
7
33
81
5
4
1
West A
12
51
65
68
10
142
West B
1
0
21
55
3
9
Total
114
236
305
434
34
502
Table 14-21Estimated development charges for constructed area (INR Crores)
Sector
R1
R2
R3
R4
Commercial
Industrial
North A
10
2
92
11
4
81
North B
8
11
5
42
1
6
South A
28
44
19
35
11
1
South B
16
55
32
96
2
7
South C
15
46
8
16
1
126
South D
8
28
0
79
6
76
East A
72
34
20
54
7
32
East B
11
48
103
5
8
1
West A
19
75
83
74
19
134
West B
2
0
27
60
5
8
Total
189
344
389
472
64
471
Total Development Charges = Development Charge (Land) + Development Charge (Building)
14-15
Table 14-22Estimated total development charges for land and constructed area (INR Crores)