Land use analysis is a useful tool to probe the spatial associations of employment clusters with supporting residential and social infrastructure and the spatial impacts of urban expansion on population growth on the natural environment and agriculture. This chapter investigates the existing spatial structure of the NMA with a focus on peri-urban areas that have seen a considerable growth in the last few years.
6.1.1 Mapping Process
The existing land use information was collected through primary surveys in 2012 and compiled in geographic information systems (GIS) format. The Existing Land Use (ELU) map has been prepared at a scale of 1:10,000 and is available for inspection with the NIT. The process employed for preparation of the Base Map and the assigning specific uses to the various ELU categories is described in 6.2.
The existing land use information along with other socio economic indicators informs the existing conditions analysis and formulation of overall vision and goals. The results of this analysis are discussed with respect to the overall NMA and for areas identified as Growth Centres in the Nagpur District Regional Plan.
6.1.2 ELU for the Overall NMA
The existing land use pattern for the entire NMA is described with focus on residential, commercial and employment centres and the land uses supporting them. Description of each land use category identified and its spatial spread is presented here. The analysis also provides an overview of land uses in tehsils with a comparative assessment of development patterns with respect to key employment areas. The portion covers the broad locations of non-agricultural (NA) land use permissions granted over a period, from year 2000 - 2013.
6.1.3 ELU in Areas Identified as Growth Centres in the Nagpur District Regional Plan 2011
The policies of the Regional Plan 2011 have a considerable influence on the existing growth pattern observed in the NMA. A broad assessment of existing land uses in the growth centres identified in the Regional Plan 2011 is thus useful. This provides an assessment of established key nodes outside Nagpur city and their relative spatial attraction for growth. The analysis also presents the emerging growth nodes reflecting the push-pull factors based on local real estate market activity in the past few years.
6.1.4 Growth Trends
Apart from the established growth centres of the Regional Plan 2011, Nagpur city and the key transport corridors emanating from it have largely influenced the direction and spread of growth. With a view to examine closely the urbanisation pattern in peri-urban areas a buffer analysis has been carried out around the city and national highways. A brief overview of NA permissions, which is an indicator or real estate market trends and preferred locations, is also covered in this portion.
6-1
6.2Base Map and Existing Land Use Mapping – Methods and Processes
6.2.1 Preparation of the Base Map
The base map for the NMA has been prepared after extensive collection and verification of data from various government agencies. The data gathered was also updated to match with latest cadastral maps, Survey of India topographic sheets (used for verifying multiple features), satellite imagery, extensive ground surveys, referencing to the 7/12 form of the revenue department and so on. The Table 6-1 provides sources for each dataset and the methodology for required updates undertaken.
Table 6-1Base Map - data features, sources and methods employed for processing datasets
S No
Data Type
Source
Features
Process Employed for Updating
1
Cadastral data
NITDeputy.Superintendent of Land Records, Nagpur
Village boundaries, Survey parcel boundaries, and survey numbers.
Cadastral information in AutoCAD format available with NIT used as a base.Cross verification with latest village maps procured from Deputy. Superintendent of Land RecordsUpdates made to cadastral data for parcel numbers, parcel configurations and village namesNo updates required for village boundariesDataset collated and referenced in GIS
2
Boundaries of other SPAs
MIDCMADC
Existing and Proposed industrial areas
Boundaries of SPAs mapped based on ownership of revenue parcels (procured from MIDC and MADC)
3
Boundaries of NMC and Municipal Councils of Kamptee and Kalmeshwar
NIT
Municipal boundaries
Based on the sanctioned development plan land use maps of the respective municipal councils
4
Water bodies
Survey of India topo sheets (1976) 1:50000 scale
Rivers, lakes and other natural features
Names of rivers and lakes, locations of lakes and other water bodies
5
Irrigation canals
Irrigation Department
Command areas major and minor irrigation projects
Information from Irrigation Department in form of hard copy map.The canal network identified on satellite imagery and then digitized.
6
Digital Elevation Model (SRTM)
Global land cover facility (GLCF), University of Maryland - freely available
Contours of 5 m intervals
Contours generated from SRTM satellite imagery
6-2
S No
Data Type
Source
Features
Process Employed for Updating
information in public domain
7
LISS Satellite image 2005
Nagpur Improvement Trust -NRSA, Hyderabad
Spatial coordinates, and land features
Natural features verified using the satellite imagery
8
Forest
Chief Conservator of Forests, Nagpur Office of the District Collector, Nagpur District - 7/12 form of revenue records
Forest (Protected and Reserved)
Protected and Reserved forests data based on information procured from the Forest Department, GoMVerification of ownership using the 7/12 revenue data.
9
Hills
NIT
Hills
Base information available with NIT in AutoCAD formatVerified through satellite imagery (Google Earth) and ground verificationVerified using government owned land recorded in the 7/12 form
10
Roads
PWD Road Master Plan 2020National Highways Authority of India (NHAI)Cadastral maps Extensive ground surveySatellite imagery (Google Earth)
Road ROW and Alignments - National Highways, State Highways, Major District Road, Other District Roads, Outer Ring Road
Base information on routes and nomenclatures for mapping roads sourced from the PWD Master Plan 2020.Outer Ring Road alignment procured from NHAIRoute/ alignment mapped through conducting field surveys of all existing roads along with hand-held GPS device. Information transferred into GIS. - all existing roads and links proposed to be upgradedInformation regarding existing roads was cross verified using satellite imagery.ROW information sourced from village cadastral data.
11
Railway
Office of the DRM, Central Railway (CR)
Existing rail line and right of railway
Rail right of way from CRVerified from cadastral data
12
High tension (HT) power transmission lines
MSEDCL; Abhijit Power Satellite imagery (Google Earth)
HT power lines from 132kv to 400kv
Base information on voltage and broad alignment was obtained from MSEDCL (non-spatial)The transmission poles were identified on satellite image and then digitized
13
High flood line -
NIT Central Water
High flood line (HFL) for 50 and 100 year
Major rivers identified using Survey of India topographic sheets
6-3
S No
Data Type
Source
Features
Process Employed for Updating
Treated as provisional dataset until further verification by the Irrigation Department.
Commission – IMD Isupluvial maps given in report for Subzone 3F
return period (blue and red respectively)
Hydrological model using HEC-RAS Software22 locations along major rivers marked such that catchment for all streams in the project area are representedCatchment for 22 locations derived using Map Window GIS softwareContours from SRTM modelComputation of flood for 22 locations using the Synthetic Unit Hydrograph techniqueVerified (50 year return period) through local enquiry at select locations
14
NA Permissions
District Collector, Nagpur
Survey parcels that are allotted NA permission
-
6.2.2 Preparation of the Existing Land Use map
Information on existing land use available with NIT in AutoCAD format was used as a base. This was updated through extensive ground surveys across the entire project area. Various uses were identified during this process. The categorisation of these uses into the 13 classes for the existing land use map is given in Table 6-2. The ELU has been made available in NIT office for public inspection and comments on 22nd May 2014.
Table 6-2Classification of existing land use categories
S No
Land Use Classification
Uses Included
1
Residential
All existing residential areas and Gaothans Mixed residential areas (commercial on ground, residential above) Planned developments (layouts for which any development is seen on ground) Congested areas
2
Commercial
General business and retail shopping areas, fuel stations Wholesale godowns and warehouses Entertainment destinations such as Fun and Food Village, Chokhi Dhani etc.,
3
Industrial
MIDC industrial estates and MIHAN All light, service, heavy industries Thermal power stations and area included under their townships
4
Public and Semi Public
Government institutions Public and private medical facilities and hospitals Social and cultural facilities like religious places, auditoriums Education and research facilities like schools, colleges
6-4
S No
Land Use Classification
Uses Included
5
Public utility
Electric substations
Overhead water tanks, cremation/ burial grounds
Cremation and burial grounds, ash ponds
6
Recreation/ open spaces
Playgrounds, parks and gardens
Multi-purpose open spaces such as maidans, Jamtha stadium
7
Defense
Area under ownership of the Defense Department
8
Transportation
Land under existing road right of ways
Land under existing rail right of way, station area, rail siding yard, rail sheds
Bus depots and truck terminals
9
Mines and quarries
6.3Existing Land Uses in the Overall NMA
6.3.1 Overview
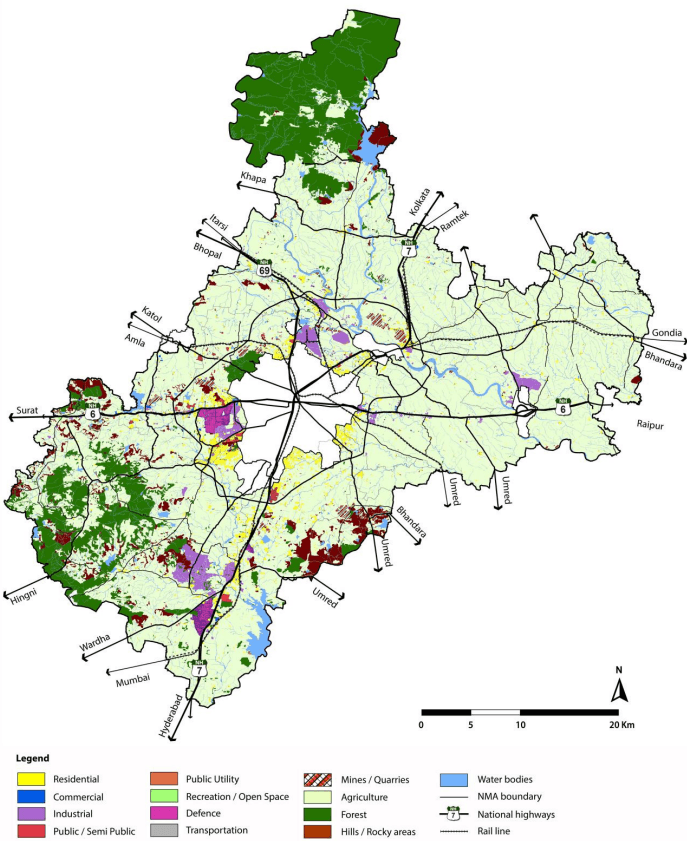
Majority of land within the NMA is a combination of farmland, forest areas, and urban activities along the major transport corridors such as the national and state highways, and railway routes. The periphery of the Nagpur city also houses a variety of urban uses. As given in the Table 6-3, existing land uses are classified into 13 categories.
Land uses related to areas that have already been developed (converted from its natural setting) have been classified into developed land with categories including uses like residential, commercial, industrial, public/semipublic, and transportation including roads, railway and transport interchanges. Total developed area in the NMA accounts to about 9.2 percent of the entire NMA area.
A map showing the existing land use classification is depicted in Figure 6-1 and Table 6-3 indicates area of land under all classes.
Table 6-3Area covered under existing land uses in the NMA
S. No.
Land use classification
Area (Sq km)
Percent of Total area
1
Residential
97.30
2.73%
2
Commercial
6.91
0.19%
3
Industrial
66.48
1.86%
4
Public-Semipublic
13.30
0.37%
5
Public Utility
1.51
0.04%
6
Recreation/Open space
0.92
0.03%
6-5
S. No.
Land use classification
Area (Sq km)
Percent of Total area
7
Defense
21.73
0.61%
8
Transportation
122.25
3.43%
9
Hills
113.63
3.19%
10
Mines/Quarries
28.44
0.80%
11
Agriculture
2,357.91
66.10%
12
Forest
508.47
14.25%
13
Water bodies Total Area
228.533,567.37
6.41%100.00%
6-6
Figure 6-1 : Existing land use map
6-7
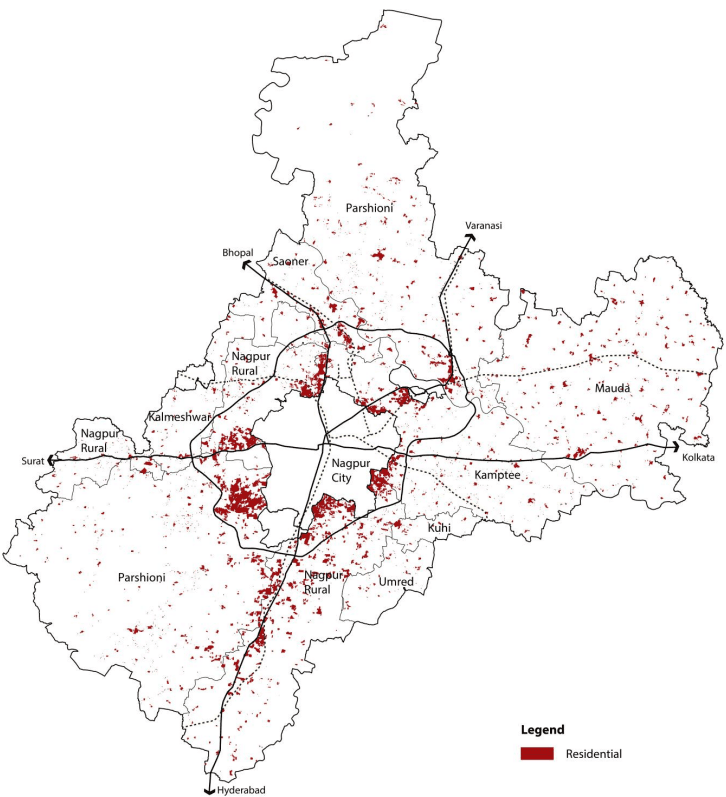
6.3.2 Residential
Existing residential in the NMA includes urban land uses categorized as residential under the particular use. Concentrations of the residential areas are majorly observed along the major transportation corridors on the periphery of Nagpur city however this use is also spread out in gaothans of rural villages. The areas where residential development is observed are along the NH-7 running north (Bokhara village north of Nagpur city) - south (along the road leading to the Butibori industrial area) and NH-6 running east-west (significant towards the western side than to the east) of the city. Residential development has also been observed along SH-255 in close proximity to the Hingna MIDC area and SH-9. Pockets of larger residential development have also been observed close to the coal mine areas in Parshioni Tehsil.
Residential uses which include primary, mixed and unplanned informal residential uses account to 97.85 km2 with a proportion of 2.74 percent of the total NMA.
6-8
Figure 6-2 : Residential land use distribution
Source: Halcrow analysis
6-9
6.3.3 Commercial
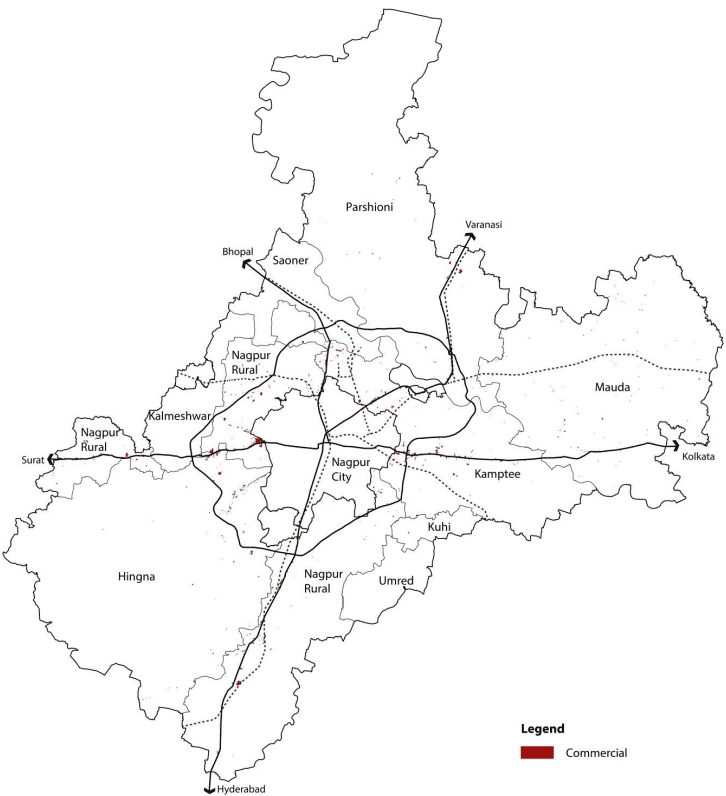
Land uses that include retail shopping and general business have been classified as commercial use. Commercial areas amount to 6.82 km2 which is 0.19 percent of the entire NMA. Due to its predominant rural character, commercial areas like retail shopping within NMA is minor and primarily supports residential development also occurring along the main transportation corridors.
A significant portion (over 86 percent) of commercial use is occupied by general business activities such as office uses and supporting activities. Large concentrations of commercial uses are distributed just outside the western periphery of the city, primarily along the NH-6 in Wadi Census Town with office spaces close to MIHAN and Hingna MIDC. Commercial development is also observed along NH-7 towards Butibori industrial area and Wardha Road. Most of the commercial areas are mixed uses with retail shopping on the ground floor and office spaces on the floors above. The development of commercial areas outside the city on the western side is indicative of development expanding along the NH-6. Map showing commercial land use distribution is depicted in Figure 6-3.
6-10
Figure 6-3 : Commercial land use distribution
Data source: Halcrow analysis
6-11
6.3.4 Industrial
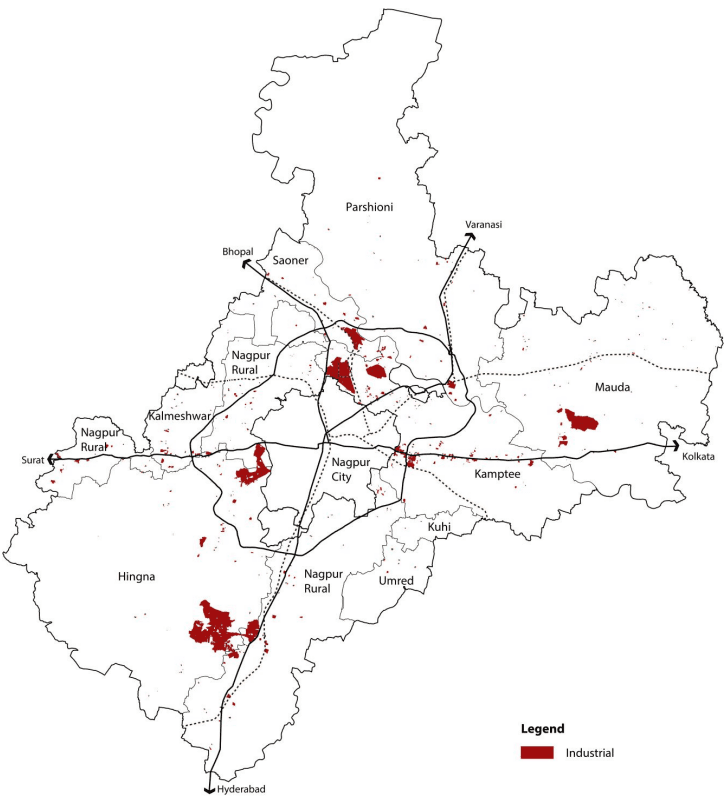
For the purpose of the analysis, industrial uses within the NMA have been classified as service/light industries, extensive industries, noxious/hazardous industries, and warehousing/godowns. This area is the second largest developed land use component of the NMA region. Presence of major transport corridors such as NH-6 and NH-7 has facilitated the growth of the industrial area.
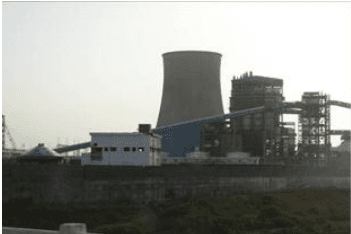
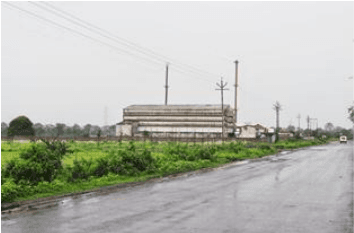
The total industrial use constitutes an area of 61.37 km2covering about 1.72 percent of the NMA with a majority of land under the MIDC areas of Butibori and Hingna. The Industrial area at Butibori is one of the largest in Asia. The Hingna MIDC has about 900 small and medium units which range from a variety of products like tractor manufacturing to toothbrush making. Apart from the MIDC areas, a number of industrial uses have been observed towards the south along the NH-6 on the eastern side of the city in the direction of Kolkatta especially the Kapsi (Kh) village. Warehousing and godowns have also been categorized within the industrial uses covering an area of 2.36 km2 and have been observed on NH-6 along west corridors outside Nagpur city.
Koradi power plant
Industries in Butibori
6-12
Figure 6-4 : Industrial land use distribution
Data source: Halcrow analysis
6-13
6.3.5 Public and Semi-public
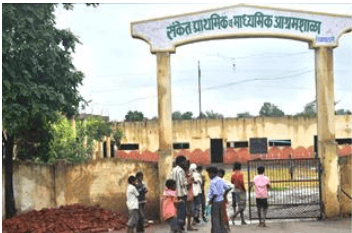
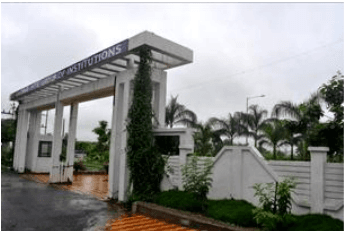
The public/semi-public use (PSP) is spread throughout the NMA and mainly concentrated along transportation corridors. The total PSP area occupies 0.41 percent of the total NMA primarily in Nagpur Rural, Hingna, Saoner and Kamptee tehsils. The NMA has a number of institutes imparting higher technical education and has a catchment of students from all around the country. A number of engineering colleges, management institutes, and residential schools are located within the NMA area predominantly in Nagpur rural and Hingna tehsils.
Images showing public, semi- public uses in the NMA.
Primary and secondary school, Hingna
Gaikwad college, Nagpur Rural
6.3.6 Transport
Three important national highways, the NH-6, NH-7, and NH-69, pass through the NMA, providing east to west and north to east connectivity. The NMA also has regional connectivity through the state highways and other important district roads and also is well integrated within the national railway network and provides extensive national connectivity. The location of Nagpur in the centre of the country has a comparative advantage due the merging of major north-south and east-west connection transportation corridors passing through the area. The railway station also acts as an important junction for both passenger and freight trains.
This comparative advantage has made the area a major transportation and logistics hub with the land use under transportation being 3.51 percent of the entire area.
6.3.7 Defence Area
Nagpur is an important city for the Indian armed forces due to its strategic location. The city is the headquarters of Maintenance Command of Indian Air Force (www.bharat-rakshak.com) which is a maintenance, repair and overhaul, product support, storage and issue of spares for all variants of aircraft, airborne equipment, and support equipment of Indian Air Force (IAF). Kamptee houses a cantonment of the Regimental Center of Indian Army's Brigade made up of National Cadet Corps' officers' training school, Institute of Military Law and other establishments. There are pockets of defence areas within NMA apart from Kamptee cantonment. About 13.42 km2 of the area is under this land use which is 0.38 percent of the NMA. This is the third largest land use after industrial land use.
6-14
6.3.8 Public Utilities
Utilities and services uses occupy a total area of 1.82 km2(0.05 percent of NMA). Public utilities like electricity substations, water tanks, and cremation / burial grounds comprise this class of land use.
6.3.9 Mines and Quarries
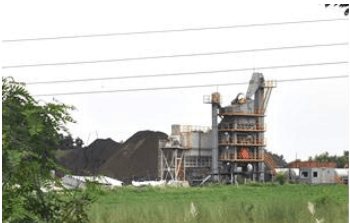
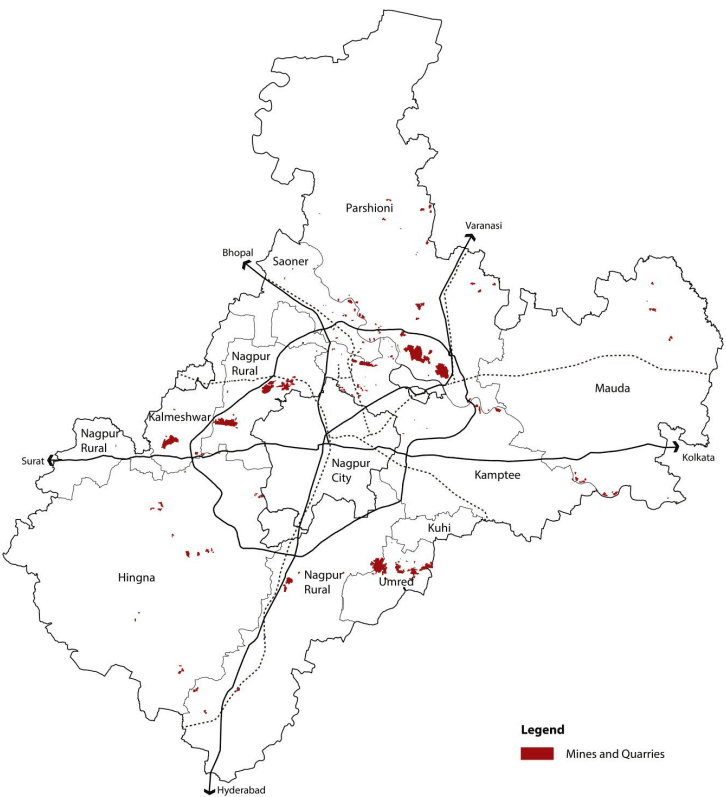
Quarrying and brick making activities have been observed to be widespread in the area. This is possibly due to the increase in development activities in the area. Majority of stone quarrying is around areas outside Nagpur city in the west and north-west side of the city periphery. Quarrying is either done by cutting parts of hills or through digging. The area of Umred tehsil within the NMA has a significant portion under stone quarries. These quarries are in close proximity of the road leading to the Umred town. Brick making is also another use that is supporting the construction industry. Uses under brick kilns have been observed along the Kanhan and the Pench Rivers mainly due to the suitability of the soil for making bricks. Brick making and stone quarries together form an area of 25.99 km2 which account for about 0.73 percent of the NMA.
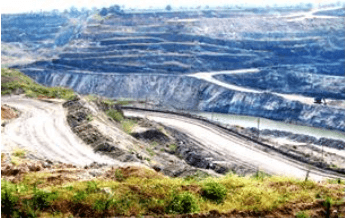
Nagpur is one of the mineral rich districts of the country. The Nagpur Regional Plan 1991- 2011 has earmarked areas for mining within the district. Coal and Manganese ore are the major contributors among other minerals that are mined in the NMA. The Western Coalfields Limited (WCL) has one of its largest mines in Parshioni Tehsil with open cast mining used to extract the mineral.
Stone crusher at Butibori
WCL open cast mine at Tekadi
6-15
Figure 6-5 : Mines and quarries land use distribution
Data source: Halcrow analysis
6-16
6.3.10 Agriculture
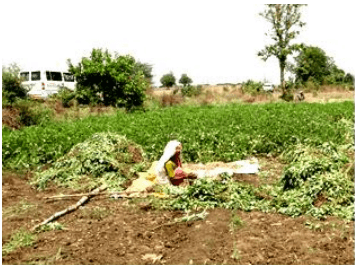
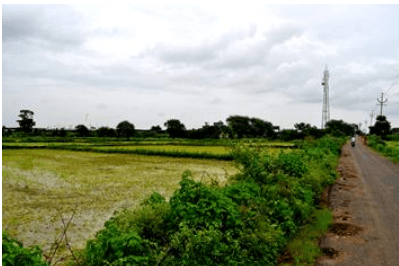
Agriculture is the predominant land use in the NMA with an area of 2,352.71 km2 accounting for 66 percent of the NMA. Mapping has been conducted based on the onsite observations and satellite imagery. Areas towards the northern part of the Pench River in the Parshioni and Mauda Tehsils fall within the Pench irrigation scheme command area. Agricultural land use in Mauda accounts for the highest among all tehsils covering an area of about 14 percent of the entire NMA. Khariff crop is the largest crop type cultivated over about 76 percent. 19 percent of the total NMA area is under double crops occurring mainly in Mauda tehsil (Source: Maharashtra Remote Sensing and Applications Centre).
Groundnut farming in Mauda tehsil
Agriculture, Hingna tehsil
6.3.11 Forests
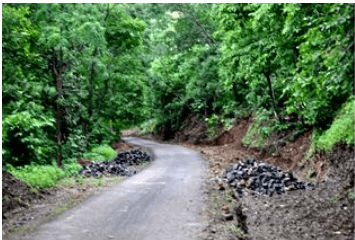
Forests and forest plantations together have the second highest share among all uses covering 516.95 km2 which is about 14.5 percent of the total area of the NMA. This includes reserved and protected forests and Zudpi jungles. These areas are concentrated to the extreme north of the NMA in Parshioni and towards the south-west in Hingna.
Bor wildlife sanctuary, Hingna tehsil
6-17
6.3.12 Water Bodies
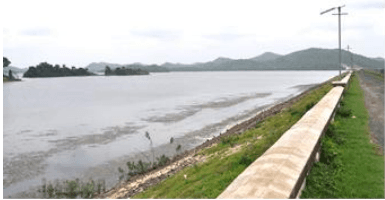
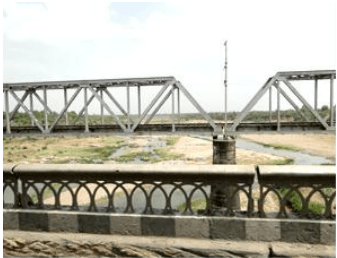
NMA Region includes lakes, dams and reservoirs (Pench reservoir, Vadegaon reservoir), along with rivers (Kanhan, Pench) and streams. These water bodies cover 224.91 km2 of area, which are 6.3% of the total NMA Region. Two of the three major rivers in the NMA which include the Pench and Kanhan rivers flow south in the northern part of the NMA and merge together to form the boundary between Kamptee and Parshioni tehsils and flow further down as the Kanhan river. The third major river is the Vena that flows southwards in the southern part of the NMA passing through Hingna and Nagpur rural.
Pench reservoir
Kanhan river
6.4Existing Land Use by Tehsils
Table 6-4 gives a break-up of the existing land use by tehsils.
6-18
Table 6-4Break-up of existing land uses by tehsils
S No
Land use
Hingna
Nagpur Rural
Kamptee
Mauda
Parshioni
Saoner
Umred
Kuhi
Kalmeshwar
Total
1
Residential
417.93
317.30
535.55
395.88
434.17
31.56
85.39
97.06
37.86
2,352.71
2
Commercial
2.53
1.51
0.23
0.47
0.82
0.02
0.88
0.28
0.07
6.82
3
Industrial
14.71
0.00
0.00
0.00
7.04
0.00
0.00
0.09
0.00
21.83
4
Public semi-public
34.55
0.17
0.34
302.95
173.93
0.00
0.14
0.90
3.77
516.75
5
Public Utilities
33.27
1.62
1.58
14.86
37.98
0.00
2.86
1.03
22.94
116.13
6
Recreation/open spaces
7.49
15.43
7.44
1.57
24.86
0.01
0.87
3.57
0.13
61.37
7
Defense
8.17
1.91
0.96
7.80
1.39
0.00
1.63
0.52
3.62
25.99
8
Transportation
7.94
1.39
0.38
0.89
2.43
0.02
1.04
0.58
0.05
14.72
9
Mines and quarries
0.51
0.54
0.05
0.21
0.09
0.05
0.10
0.25
0.02
1.82
10
Forests
0.62
0.16
0.01
0.05
0.07
0.00
0.09
0.07
0.00
1.09
11
Agriculture
37.74
13.34
8.73
8.15
22.43
0.85
1.16
4.81
0.63
97.85
12
Hills/rocky areas
32.59
17.26
23.95
19.77
20.07
0.94
2.93
5.88
1.98
125.39
13
Water bodies
43.03
22.90
38.02
62.59
36.95
1.34
6.01
10.05
4.01
224.91
Total
641.07
393.52
617.24
815.19
762.25
34.80
103.10
125.10
75.10
3,567.37
6-19
Existing mines, quarries and brick kilns
10
Agriculture
Single, double and triple cropped farm land
Barren land, gullied land, scrub land and all undeveloped land
11
Forest
Protected Forests and Reserved Forests
12
Hills/ rocky areas
Areas marked as hills and rocky areas in the revenue records