A comprehensive understanding of a region is often developed through the study of its economic characteristics. This chapter outlines the economic profile of the NMA and also discusses the relevant growth trends across various sectors of the economy. The growth trends for the Nagpur district have also been analysed to understand relevant trends and draw inferences from.
5.1 Economic Resource Base
The economic resource base of a region often determines the pace at which development will be driven over time. The resources available within a region also help determine the nature of economic activities that are existent as well as can be focused upon in the future for incremental development. The resource base also needs to be looked upon from a larger perspective since it allows development opportunities that may not necessarily be ascribed to the locations or regions. Nagpur district as a whole has a rich material resource base which pans across agricultural, mineral, forest, animal husbandry and fisheries. These have been discussed below.
5.3Workforce Participation in NMA
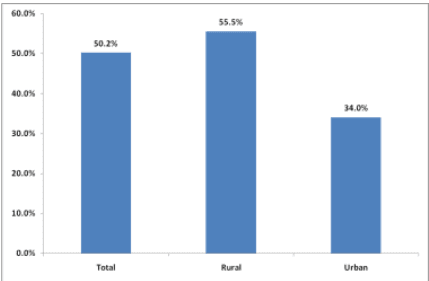
The workforce participation rate (WPR) for the NMA is observed to be 50.2 percent with 365,518 workers which is higher than that of the district (37.8 percent). The rural WPR is observed to be 55.5 percent with a workforce of 304,487 indicating that a large amount of population contributes to economic activity as compared to the urban areas where the WPR is 34 percent with a workforce of 61,031. The male WPR for NMA is observed to be 54.1 percent with male workforce of 240,388 while the female WPR is observed to be 30.9 percent with a female workforce of 125,180. Interestingly, the female WPR for urban areas in NMA is only 8.2 percent while that for the rural areas is 38.1 percent.
Figure 5-9 : Workforce participation rate in NMA
Source: Census 2001, CRIS analysis
5.4Sectoral Employment in NMA
The sectoral employment is an indicator of the key economic activities that the populace is engaged in. Typically, Indian economy was dominated by the employment in primary sectors, mainly agriculture. However, over the years with the spectrum of economic opportunities has been expanding and coupled with easy education availability. Due to this, while the share of population working in agricultural may have remained higher, the secondary and tertiary sectors have started gaining importance.
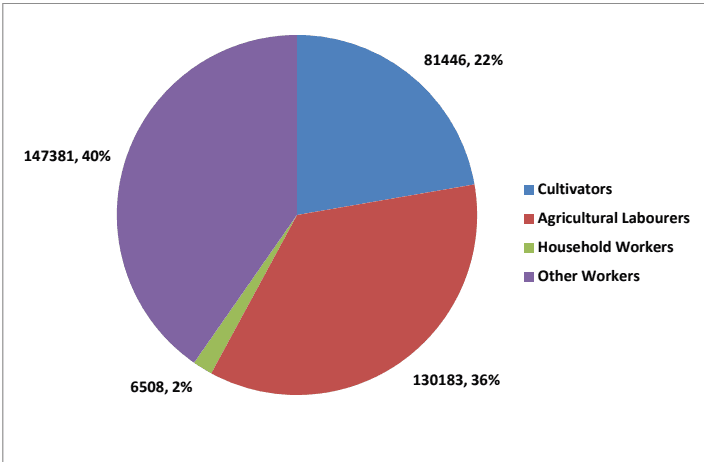
For the NMA, the sectoral employment (for total workers) indicates that agriculture still continues to dominate a people’s occupation. The total employment in the agriculture sector is close to 58 percent which constitutes of 81,466 cultivators and 130,183 agricultural labourers. However, the share of “others” (this includes all services and manufacturing and allied works) has also been substantial at 40 percent or 147,381 workers, indicating that the importance of other economic avenues is increasing. This reiterates the fact of tertiary sector’s larger contribution to the GDDP.
5-15
Figure 5-10 : Sectoral employment in NMA
Source: Census 2001, CRIS analysis
Interestingly, when a comparison with Nagpur district is attempted, it becomes evident that for the district as a whole the employment in “others” category is far higher at 63 percent. The employment in agriculture is only 34 percent, which suggests that at the district level the economy has diversified significantly and employment opportunities in activities besides agriculture are abundant.
5.4.1 Main Workers’ Composition in NMA
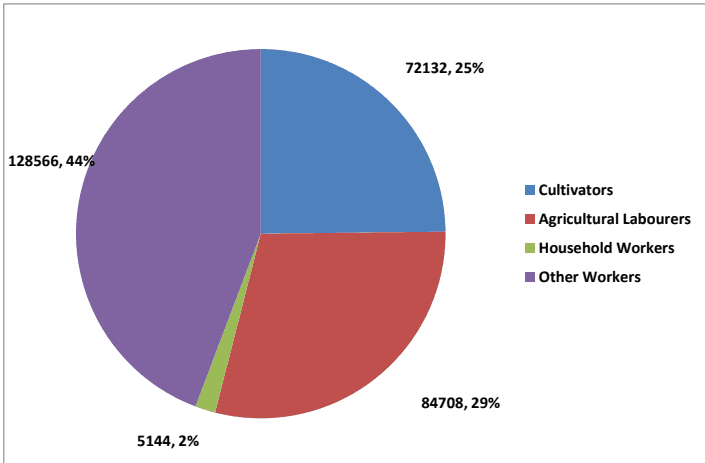
When the composition of main workers across category is analyzed, it becomes apparent that the agriculture still is the mainstay of the economy in NMA with 54 percent of employment, 72,132 cultivators and 84,708 agricultural labourers being concentrated in the sector. The “others” category employs 44 percent of the main workforce with 128,566 workers. This includes people spread across both manufacturing as well as services sectors.
5-16
Figure 5-11 : Main workers composition
Source: Census 2001, CRIS analysis
The dependency on agriculture is still high with 54 percent of people engaged in agriculture either as cultivators (25 percent) or agricultural labourers (29 percent). Household economic activities engage only 2 percent of the total main workers. This trend is marginally different from the overall NMA employment trend where the pre-dominant occupation theme emerges to be agriculture.
5.6Industrial Development
5.6.1 Policy Framework - The Industrial, Investment, Infrastructure Policy 2006
Maharashtra has been in the forefront in sustaining industrial growth and in creating environment conducive to industrial development. Investment-friendly industrial policies, excellent infrastructure and a strong and productive human resource base have made it a favoured destination for the manufacturing, export, distribution and financial service sectors. It has achieved 7.1 percent average growth in the last decade. The state’s economy has shown increasing signs of maturity. Its Services Sector contributes
5-18
61 percent and its Industry Base contributes 26 percent of the GSDP. The State contributes 40 percent of the national fiscal receipts. Furthermore, it has the largest share of public funds for the development of industrial and social infrastructure.
The industrial, investment, infrastructure policy 2006 therefore aims at ensuring sustainable industrial growth through innovative initiatives for development of key potential sectors and further improving the conducive industrial climate in the state, for providing the global competitive edge to the state’s industry.
The policy objective is “to achieve higher and sustainable economic growth with emphasis on balanced regional development and employment generation through greater private and public investment in industrial and infrastructure development.”
The policy targets are:
Target Industrial Sector growth rate of 10 percent by 2010
Target Service Sector growth rate of 12 percent by 2010 and
Additional employment generation of 20 lakh by 2010
The policy was valid till the March 31, 2011. This policy is now under review and a new industrial policy is likely to be announced soon. The state government is already in deliberation to finalize the nuances of the industrial policy.
5.2District Domestic Product
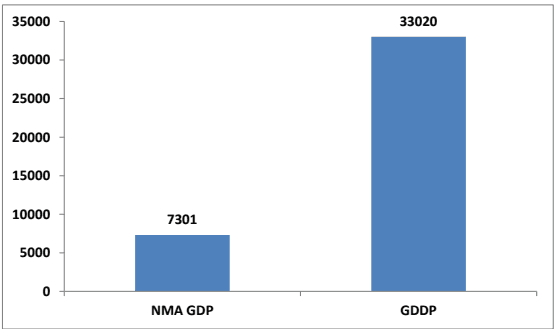
At current prices, the gross district domestic product5(GDDP) of Nagpur for 2008-2009 is estimated to be Rs. 33,020 crore while the net district domestic product (NDDP) is estimated to be Rs. 28,424 crore.
At constant prices, the GDDP of Nagpur for 2008-2009 is estimated to be Rs. 20,595 crore. The state domestic product (SDP) of Maharashtra is estimated to be Rs. 442,320 crore.
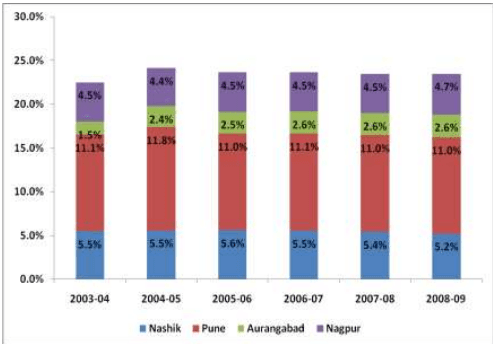
In 2008-2009 at constant prices, Nagpur district’s contribution to SDP was rougly 4.7 percent. This is lower in comparison with the contribution of Nashik and Pune, where Pune contributes a little over twice than Nagpur to the SDP.
Figure 5-5 : Comparison of districts’ contribution to SDP
Source: District statistical abstract for respective years and CRIS analysis
5.2.1 GDDP Distribution
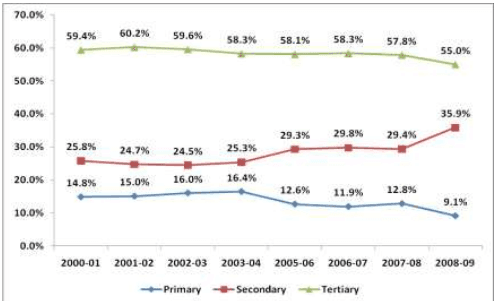
The sectoral distribution of the GDDP can amplify the course that the economy has taken over time. In case of Nagpur, the sectoral contribution to GDDP is dominated by the tertiary sector. The tertiary sector has bagged a lion share of the contribution over the past decade or so with the contribution ranging between 55 percent and 60 percent.
5 Gross District Domestic Product (GDDP) represents the sum of economic value of all goods and services produced within the geographical boundary of the district after deducting the necessary inputs consumed in the process of production and Financial Intermediation Services Indirectly Measured (FISIM). From this gross District Domestic Product, Consumption of Fixed Capital (CFC) is deducted to arrive at the Net District Domestic Product (NDDP) which is normally termed as District Income. The District income is divided by the mid-year estimated population of the district that is in question to get Per Capita Income of that district.
5-10
Figure 5-6 : Sectoral distribution of GDDP
Source: District socio-economic profile for respective years, CRIS analysis
It is evident that the secondary sector (manufacturing and construction activities) has also started gaining importance with a sizable growth in the last couple of year. This suggests that there is possibly a case of large investments in manufacturing as well as construction activities.
Share of agriculture has significantly reduced in the district. It demonstrated a sharp decline between 2007-2008 and 2008-2009.
A detailed analysis of the GDDP of Nagpur for the past 10 years or so indicates some interesting trends. The analysis carried out points that the growth in the GDDP has largely been driven by the Secondary Sector comprising of Manufacturing and Construction. The Compounded Annual Growth Rate (CAGR) of the sector works to be 19 percent between 2001 and 2009.
The tertiary sector has been growing at a CAGR of 13 percent between 2001 and 2009 while the primary sector has grown at a CAGR of 8 percent for the same period. This clearly indicates that the economy is being driven by the secondary sector.
Table 5-11Detailed GDDP analysis for Nagpur
Sectors
Contribution (in Rs. Lakhs)
CAGR
2001
2002
2003
2004
2005
2006
2007
2008
2009
Primary Sector
Agriculture including livestock
1066
1154
1777
1493
1507
1643
1749
2318
1836
7%
Forestry & logging
62
66
71
62
67
98
167
124
150
12%
Fishing
22
21
649
23
37
40
42
53
54
12%
Mining &
499
565
2527
578
653
760
793
953
969
9%
5-11
Sectors
Contribution (in Rs. Lakhs)
CAGR
2001
2002
2003
2004
2005
2006
2007
2008
2009
Quarrying Sub-Total - Primary Sector
1649
1805
5025
2156
2264
2540
2750
3448
3008
8%
Secondary Sector
Manufacturing (Rg)
1183
1043
1255
1478
1758
2866
3516
4028
4791
19%
Manufacturing (UnRg)
537
548
603
689
789
885
1044
1186
1270
11%
Construction
939
1078
11108
1369
1504
1757
1884
2150
4897
23%
Electricity, gas and water supply
213
301
334
363
355
398
439
542
898
20%
Sub-Total - Secondary Sector
2873
2969
13301
3900
4406
5906
6883
7907
11856
19%
Tertiary Sector
Railways
190
194
206
245
275
296
346
379
417
10%
Transport & Storage
499
534
580
643
764
868
1021
1193
1356
13%
Communication
410
449
373
426
480
556
622
739
1123
13%
Trade, Hotel and Restaurants
1402
1468
1754
2008
2406
2969
3462
4008
5021
17%
Banking and Insurance
1301
1566
1790
2062
2239
2499
2899
3255
3660
Source: District statistical abstract of various years and CRIS analysis
Within the secondary sector, growth has been commanded by ‘construction’ and allied activities (electricity, gas, water) activity which has displayed a CAGR of 23 percent (20 percent for electricity, gas and water). Organized manufacturing has also contributed significantly over the years displaying a CAGR of 19 percent.
Table 5-12Annual growth of GDDP and its constituents
Sectors
Annual Growth Rates
2004-2005
2005-2006
2006-2007
2007-2008
2008-2009
Primary Sector
Agricultureincluding livestock
1%
9%
6%
33%
-21%
5-12
Sectors
Annual Growth Rates
2004-2005
2005-2006
2006-2007
2007-2008
2008-2009
Forestry & logging
8%
46%
70%
-26%
21%
Fishing
61%
7%
6%
25%
2%
Mining & Quarrying
13%
16%
4%
20%
2%
Primary Sector Growth
5%
12%
8%
25%
-13%
Secondary Sector
Manufacturing (Registered)
19%
63%
23%
15%
19%
Manufacturing (Unregistered)
15%
12%
18%
14%
7%
Construction
10%
17%
7%
14%
128%
Electricity, gas and water supply
-2%
12%
10%
24%
66%
Secondary Sector Growth
13%
34%
17%
15%
50%
Tertiary Sector
Railways
12%
8%
17%
10%
10%
Transport & Storage
19%
14%
18%
17%
14%
Communication
13%
16%
12%
19%
52%
Trade, Hotel and Restaurants
20%
23%
17%
16%
25%
Banking and Insurance
9%
12%
16%
12%
12%
Professional Services
16%
14%
17%
17%
12%
Public Administration
20%
5%
10%
27%
10%
Other Services
8%
10%
14%
10%
6%
Tertiary Sector Growth
14%
14%
15%
16%
17%
Year on Year GDDP Growth
13%
19%
15%
17%
23%
Source: District statistical abstract of various years and CRIS analysis
If we analyze the annual growth rates of various economic activities that constitute the GDDP, it is observed that the bulk of the growth in the past 5 years or so has been driven by both the secondary and tertiary sectors.
Construction and electricity, water and gas activities demonstrated a very buoyant growth between 2008 and 2009 with a growth rate of 128 percent and 66 percent respectively. The secondary sector grew at a rate of 50 percent during the same period on the back of these strong performances. The tertiary sector grew at a rate of 23 percent during the same period.
Thus, it is apparent that the growth in Nagpur is more Nagpur city centric since a bulk of the construction activities as well as industrial activities is happening in and around the Nagpur city. Nagpur city houses
5-13
50 percent of the district’s population and hence obviously acts as the growth driver for the larger NMA region as well as the district.
5.2.2 NMA Contribution to GDDP
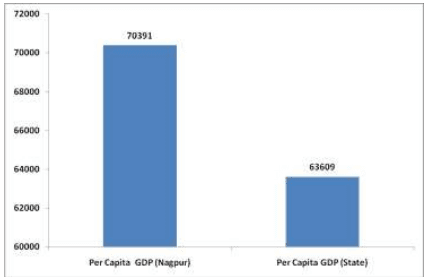
The per capita GDP for Nagpur district was estimated to be Rs. 70,391/- which is higher than that of the state which is estimated to be Rs. 63,609/-.
Figure 5-7 : Per-capita GDP for Nagpur and Maharashtra
Source: District statistical abstract, 2010 and CRIS analysis
The domestic product data is not available below the district level. In the absence of such disaggregate data; the per-capita GDP can be a reasonable measure to gauge the domestic product of a particular area. Using the per capita GDP as a base, the NMA’s GDP works out to be Rs. 7,301 crore. NMA’s contribution to district GDP is mere 22 percent.
Figure 5-8 : NMA share in district product
Source: District statistical abstract, 2010 and CRIS analysis
5-14
5.6.2Industrial Incentives
In order to encourage the dispersal of industries to the less developed areas of the state, government of Maharashtra devised the package of incentives to new / expansion units willing to set up in the developing regions of the state since 1964. This scheme is popularly known as the package scheme of incentives.
Coverage under 2007 Scheme
The following categories of eligible industrial units in the private sector, state public sector/ joint sector and the co-operative sector, but not in the central public sector, would be considered for incentives under the 2007 scheme:
Industries listed in the first schedule of the industries (development and regulation) Act, 1951, as amended from time to time (list of industries included in the first schedule appended in Appendix 1)
Manufacturing Enterprises as defined in the MSMED Act, 2006
Information technology (IT) units registered with directorate of industries or MIDC or development commissioner (SEEPZ) or STPI in the state
Poultry
Cold storages and agro industries
5-19
Biotechnology (BT) units as specified by government from time to time, which are outside the purview of any registering authority mentioned above
Under the 2007 scheme, the entire state was classified into various categories of areas according to their current level of development. The classification has been indicated below:
Group A: comprising the developed areas, viz. Mumbai metropolitan region (MMR) and Pune metropolitan region (PMR)
Group B: comprising the areas where some development has taken place
Group C: comprising the areas, which are less developed than those covered under Group B
Group D: comprising the lesser-developed areas of the State not covered under Group A/ Group B/ Group C
Group D+: comprising those least developed areas not covered under Group A/Group B/Group C/Group D
No Industry District: Not covered under Group A / B/ C/ D and D+
The Nagpur city is classified under the Group D or in other words one of the lesser developed areas of the state. All other tehsils of the Nagpur District are classified under Group D+ or as areas with least amount of industrial development. This speaks volumes about the state of the economy in the Nagpur region which appears to not have grown at an equal footing as compared to other parts of the state despite having several factors that can work in its favour.
5.5Sectoral Employment in Nagpur City
The city of Nagpur is a key growth centre in the district with 50 percent of the population residing in the city. As per 2001 census, about 41 percent of the total workforce was from Nagpur city alone. The diversification of economic activity is quite extensive in the Nagpur city and a majority of the populace is engaged in non-agricultural economic activities.
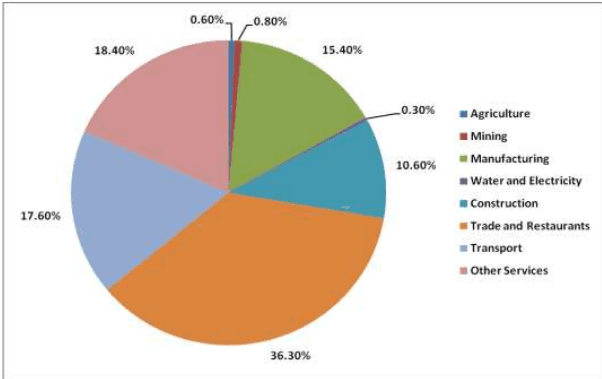
The city development plan for Nagpur, 2006 reported that less than 1 percent of the workforce was engaged in agriculture. The biggest employment generator in the Nagpur city is the trade, hotel and restaurants sector. Approximately 36 percent of the total workforce is engaged in this activity. Transportation related activities engage approximately 18 percent of the total workforce. The manufacturing sector employs 15.4 percent of the total workforce.
5-17
Table 5-13Annual growth of GDDP and its constituents
Workforce Participation in Nagpur
Percentage
Main Workers
Marginal Workers
Total
Agriculture
0.60%
3,410
355
3,765
Mining
0.80%
4,546
474
5,020
Manufacturing
15.40%
87,516
9116
96,632
Water and Electricity
0.30%
1,705
178
1,882
Construction
10.60%
60,238
6275
66,513
Trade and Restaurants
36.30%
206,287
21489
227,776
Transport
17.60%
100,018
10419
110,437
Other Services
18.40%
104,564
10892
115,457
Total
100.00%
568,284
59,198
627,482
Source: City development plan, 2006, Nagpur municipal corporation
Figure 5-12 : Sectoral employment in Nagpur city
Source: City development plan, Nagpur municipal corporation
The dominance of services (in terms of contribution to the GDP) at the district level could primarily be due to Nagpur city.
5.6.4Industrial Estates in Nagpur
The Maharashtra Industrial Development Corporation (MIDC) has identified several areas within Nagpur district for industrial development. The status of these has been decided in accordance with the area classification carried out for the Nagpur district.
5-21
Table 5-16Maharashtra industrial development corporation estates in Nagpur district
Industrial Area
Category
Bhivapur
Mini Industrial area
Butibori
5 star industrial area
Kalmeshwar
Major industrial area
Katol
Growth Center
Kuhi
Mini Industrial area
Nagpur (Hingna)
Major industrial area
Narkhed
Mini Industrial area
Parshioni
Mini Industrial area
Parsodi IT Park
Major industrial area
Saoner
Growth Center
Umred
Growth Center
Source: Maharashtra industrial development corporation(MIDC), information as available on www.midcindia.org
Most of the industrial units in and around the NMA are located within the industrial estates developed by Maharashtra industrial development corporation (MIDC). Within NMA, MIDC has 7 operational estates where land has been acquired and put to use for production purposes. Barring the exceptions of Kamptee and Mouda, all other tehsils within NMA have MIDC estate.
The biggest of these estates is the Butibori which is spread over more than 2,000 hectares. Butibori has been identified as a 5 star estate which consists of state of the art infrastructure for industrial units. Hingna, Umred and Kalmeshwar are other key locations with relatively large estates.
Table 5-17Details of MIDC estates in Nagpur district
Details
Unit B
utibori Kal
meshwar
Hingna Parsheoni Saoner Umred Kuhi
Total
Total area
ha
2312
110.5
749.28 12 73.95 294.64 15.55
3567.92
acquired
Area
ha 1
494.29
93.57
706.75 19.68
2314.29
developed
No of plots
ha
680
93.57
514.12
1287.69
allotted
Units in
No.
110
75
902
1087
production
Units under
No.
34
5
42
81
construction
Available for
No.
154
1
47 35
237
allotment
Available for
ha
409
0
0
409
allotment
Source: Maharashtra industrial development corporation(MIDC), information as available on www.midcindia.org
5-22
5.6.3Enterprises in Nagpur
According to the 5th Economic Census of 2005 for Maharashtra, Nagpur district had 209,490 enterprises (4.4 per cent of the state) which employed roughly 516,166 persons (4.8 per cent of the total employment in the state).
According to the District Statistical Abstract (DSA) of 2010, the total enterprises in the district are 211,049 and the total employment in these enterprises is 545,388. The enterprises in the district have grown at a CAGR of 0.15 percent between the Economic Census, 2005 and the reporting by DSA in 2010, while the employment has grown at a CAGR of 1.1 percent.
Between the economic census of 1998 and 2005, non-agricultural enterprises registered a CAGR of 4 percent which is very close to that of the state at 5 percent. The total non-agricultural enterprises, in Nagpur, recorded during the economic census of 1998 were 143,875 which grew to 192,940 as per economic census of 2005. The total non-agricultural enterprises recorded during by the district statistical abstract of 2010 were 195,451. Non-agricultural enterprises between 2005 and 2010 have grown at a CAGR of only 0.3 percent.
An analysis of the growth in enterprises between 2007 and 2010 has also been carried out to understand the growth trends.
5-20
Table 5-14Growth in enterprises and employment between 2007 and 2010
2007
Agriculture
Non-Agriculture
Total
Rural
Urban
Total
Rural
Urban
Total
Rural
Urban
Total
Self Employed Enterprises
7869
1833
9702
25311
106841
132152
33180
108674
141854
Establishments
668
162
830
11723
32110
43833
12391
32272
44663
Total Enterprises
8,537
1,995
10,532
37,034
138,951
175,985
45,571
140,946
186,517
Employment
14,756
3,271
18,027
119,810
347,260
467,070
134,566
350,531
485,097
2010
Agriculture
Non-Agriculture
Total
Rural
Urban
Total
Rural
Urban
Total
Rural
Urban
Total
Self Employed Enterprises
9775
1096
10871
28357
78613
106970
38132
79709
117841
Establishments
4148
579
4727
18998
69483
88481
23146
70062
93208
Total Enterprises
13,923
16,75
15,598
47,355
148,096
195,451
61,278
149,771
211,049
Employment
22,963
3,044
26,007
108,933
410,398
519,331
131,896
413,442
545,338
Source: District statistical abstract, 2007, 2009 and 2010 and CRIS analysis
The net increase in number of enterprises between 2007 and 2010 has been a little over 24,000 while during the same period employment has increased by a little over 60,000.
Table 5-15Compounded annual growth rate of enterprises and employment between 2007 and 2010
CAGR
Agriculture
Non-Agriculture
Total
Rural
Urban
Total
Rural
Urban
Total
Rural
Urban
Total
Self Employed Enterprises
7%
-16%
4%
4%
-10%
-7%
5%
-10%
-6%
Establishments
84%
53%
79%
17%
29%
26%
23%
29%
28%
Total Enterprises
18%
-6%
14%
9%
2%
4%
10%
2%
4%
Employment
16%
-2%
13%
-3%
6%
4%
-1%
6%
4%
Source: District statistical abstract, 2007, 2009 and 2010 and CRIS anlaysis
If we analyze the growth of enterprises and employment in Nagpur, it becomes evident that both have increased at a CAGR of only 4 percent. This indicates that the growth in enterprises and thereby employment has been rather slow.
5.6.7Information Technology Services in NMA
Information technology (IT) sector has been a large contributor to the economic growth of the country. The inherent capabilities and talent available in the country has allowed IT and IT enabled services (ITES) sector to grow very rapidly.
Maharashtra’s forward looking IT policy has been well received in the IT sector. 25 percent of the top 500 software companies in India are based in Maharashtra. 10 of the top 20 software and services
5-26
exporters in India have operations in the state. Maharashtra has 30 public IT parks and 177 private IT parks, which provide employment to 30 percent of the country’s IT, professionals. Maharashtra accounts for 32 percent of Internet subscribers, 35 percent of national PC market and peripherals. Maharashtra contributes over 20 percent of the total software exports from India.
A software technology park was set in Nagpur in with the objective of promoting IT based entities to set up operations in Nagpur and thereby contribute to diversification of economic activities and economic growth. Parsodi IT Park has also been recently set up in Nagpur.
Growth in the IT sector in Nagpur has been very limited. Over the past 10 years, only 92 entities have set up operations in Nagpur based on the statistics available from STPI. The overall software and related exports from Nagpur totaled to Rs. 144 crore for the year 2010-2011.
Table 5-21Software export growth in Maharashtra and Nagpur
Year
Exports - Maharashtra (Rs. crore)
Exports - Nagpur (Rs. crore)
Nagpur's Share
2007-08
35374
106
0.3%
2008-09
42361
159
0.4%
2009-10
45709
135
0.3%
Source: Software technology park of India, Nagpur
The growth in software exports from Nagpur displayed a CAGR of 14.5 percent over the last 5 years. The highest growth was recorded in the years 2007-2008 and 2008-2009 where the growth rate was 46 percent and 50 percent respectively.
5.6.5Large Scale Industries in NMA
Large scale industrial investment in Nagpur is quite limited as compared to the state. There are a total of 190 large scale units existing in the district with an investment of Rs. 7,463.63 crore. These units employ 58,401 persons.
Table 5-18Existing large industrial units in Nagpur district
Details
Number of Units
Investment (Rs. crore)
Employment
Existing
190
7,463.64
58,401
Source: District industrial potential survey, Nagpur, 2010, Ministry of micro, small & medium enterprises, government of India
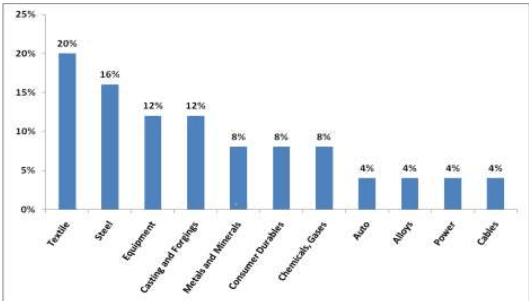
At the NMA level, textiles and steel production dominate the large scale industries’ set up. The other key industrial activities are that of equipment manufacturing and forging.
Figure 5-13 : Break-up of large scale industries across category6
Source: List of large scale Units as available on Nagpur district website, www.nagpur.nic.in, accessed between August 2011 and November 2011
Some of the large scale operational units in Nagpur have been listed below:
Table 5-19Existing and proposed large industrial units in Nagpur district
S No
Large Industries
Location of Industry
Type of Industry
1.
Indorama Synthetics (p) Ltd.
Butibori
PFY Spinning
2.
ACC Nihon Casting Ltd.
"
Alloy Steel Casting
3.
ACC Refractory Ltd.
"
Refractory
14%
Professional Services
1021
1144
1280
1453
1680
1908
2222
2592
2909
14%
Public Administration
774
784
851
884
1059
1111
1223
1550
1705
10%
Other Services
1027
1097
1207
1246
1346
1485
1688
1863
1965
8%
Total - Tertiary Sector
6,623
7,234
8,040
8,968
10,250
11,691
13,482
15,578
18,156
13%
Grand Total
11,145
12,009
26,365
15,023
16,921
20,138
23,116
26,933
33,020
15%
Table 5-22IT Exports growth in Nagpur
Year
Exports (in Rs. crore)
Growth Rate
2006-07
73
2007-08
106
46%
2008-09
159
50%
2009-10
135
-15%
2010-11
144CAGR
7%14.5%
Source: Software technology park of India, Nagpur and CRIS anlaysis
An interesting picture emerges when we carry out an analysis of the manpower growth in the IT sector in Nagpur. Over the last 5 years, the trend in manpower growth has been volatile. This could be attributed to the overall global economic slowdown over the last 3 to 4 years.
Manpower growth recorded a CAGR of only 2.6 percent in the last 4 years in Nagpur. This is based on official statistics made available by STPI only. This implies that the IT industry in Nagpur has not scaled up to a point where large manpower demand is observed like in many other IT services concentration areas.
5-27
Table 5-23Manpower growth in IT sector in Nagpur
Year
Manpower
Growth Rate
2006-07
0
2007-08
2,523
2008-09
3135
24%
2009-10
3320
6%
2010-11
2800
-16%
CAGR
2.6%
Source: Software technology park of India, Nagpur and CRIS analysis
Thus the growth of IT sector has not been very encouraging despite the large talent pool available in Nagpur where roughly 11,000 engineering graduates pass out every year.
4.
KEC International Ltd.
"
Transmission Towers
5.
Industrial Oxygen Ltd.
"
Industrial Gases
6.
Premier Irrigation Equipment
"
Irrigation Systems.
6 This is derived from a sample of 35 large industrial units
5-23
S No
Large Industries
Location of Industry
Type of Industry
7.
Industries Ltd. Voltas Ltd.
"
Washing Machine
8.
Woodworth (I) Ltd.
"
Woolen Yarn
9.
Fabworth (I) Ltd.
"
Process House
10.
S.S.P. Pvt Ltd.
"
Industrial Dryers
11.
Maharashtra Organo
"
LPG Bottling
12.
Uniworth Power Ltd.
"
Power Plant
13.
Abhishek Steel Ltd.
"
Rerolling Mill
14.
Texprint Overseas Ltd.
"
Woolen Yarn
15.
Munis Forge Ltd.
"
Forging.
16.
Morarji Mills Ltd.
"
Texturising
17.
SKG Refrigerators
"
Refactory
18.
Nagpur Engineering
"
Casting Co. Ltd
19.
Ferrow Alloyes Corporation Ltd
"
Alloys
20.
Bajaj Dhatu Udyog Ltd.
M.I.D.C. Hingna
Steel Plant
21.
Mahindra & Mahindra Ltd
"
Tractor
22.
Central Cables.
"
Electrical Cables
23.
Sharda Ispat Ltd.
"
Rolling Mills.
24.
VIP Industries.
"
Luggage
25.
Nippon Denro Ispat Ltd
Kalmeshwar Industrial area
Cold Rolled Sheet
26.
Noga Factory
M.I.D.C. Hingna
Fruit Beverages
Source: List of large scale units as available on Nagpur district website, www.nagpur.nic.in, accessed between August 2011 and November 2011
5.6.8Investments Proposed in and Around NMA
Foreign Direct Investments
According to the district statistical abstract, 2009-2010, 27 proposals for foreign direct investments in the manufacturing sector were mooted. The details have been provided below:
Table 5-24Foreign direct investments in manufacturing during 2009-10 in NMA
Tehsil
No. of Projects
Investments (in Rs. crore)
Nagpur (City & Rural)
2
22.85
Hingna
25
469.99
Total
27
492.84
Industrial investments proposed in and around NMA
District Industrial Potential Survey Report, 2010, for Nagpur district suggests that there are large investment commitments in the industrial sector in and around Nagpur. It is proposed that 254 units will be set up with an investment of a little over Rs. 68,000 crore Source: District industrial potential survey, Nagpur, 2010, micro, small and medium enterprises development institute, government of India)
If we analyze the investments across types of activities proposed, it becomes apparent that a large chunk of these investments are proposed in the Power sector which accounts for 79 percent of these investment commitments. Steel sector accounts for 13 percent and cement accounts for 4 percent.
Table 5-25Proposed investments in Nagpur
Type of Unit
No.ofUnits
Investment(Rs. crore)
BCategoryUnits
Investment(Rs.crore)
CCategoryUnits
Investment(Rs.crore)
PCategoryUnits
Investment(Rs.crores)
Power Generation
51
54021.51
14
14
23
Steel
49
8953.53
Textile
24
2
Cement
14
2609
3
2
9
Coal
13
859.06
1
15.2
2
40
10
803.84
Alcohol
14
405
4
-
6
4
5-28
Type of Unit
No. of Units
Investment (Rs. crore)
B Category Units
Invest ment (Rs. crore)
C Category Units
Invest ment (Rs. crore)
P Category Units
Invest ment (Rs. crores
Oil
11
117.43
1
55
1
Food
12
203.73
2
19.06
7
50.33
3
134.34
Paper
14
191.38
Plastic
9
1
8
Explosives
6
170.46
2
5.46
4
165
Electrical
5
187.98
1
12.58
2
85.28
2
90.12
Lime Stone
4
185
1
45
2
95
1
45
LPG & Gas
4
8.66
3
8.66
1
Chemical
5
28
2
9.88
1
2
2
16.12
Sugar
3
94
2
69
1
25
Rubber
3
265
2
9
1
256
Agro
2
26
-
-
2
26
Alum
1
-
1
Bio-diesel
1
160
1
160
Pharmaceutica
1
8
1
108
ls
Iron Powder
1
5
1
5
Packaging
2
10.08
1
2.08
1
8
Material
According to the district industrial potential survey of 2010, proposals for setting up of 140 large scale units are under various stages of implementation. These additional units will bring in an investment of close to Rs. 5,577 crore and will potentially employ a little over 25,000 persons.
Table 5-26Proposed large scale units in and around NMA
Details
Number of Units
Investment (Rs. crore)
Employment
Proposed
140
5577.68
25257
Source: District industrial potential survey, Nagpur, 2010, micro, small and medium enterprises development institute, government of India
Thus, it can be inferred that the industrial activity in Nagpur is rather limited as compared to other parts of the state like Mumbai and Pune regions. This could be attributed to geo-political dynamics of development.
5.6.6Micro, Small and Medium Enterprises in NMA
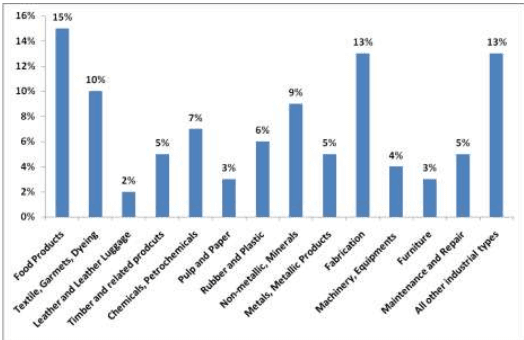
At the district level, food products related units dominate the MSME sector. Fabrication is also a key activity being pursued. Textile and garments and non-metallic products’ manufacturing also have a larger share.
Figure 5-14 : Distribution of MSME across various products
Source: District Industries centre, Nagpur
5-24
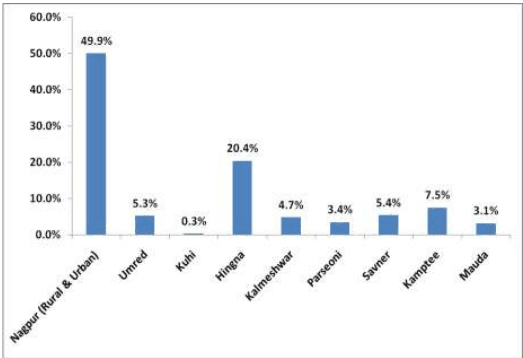
The total MSME units that became operational during last five years in the Nagpur metropolitan area are estimated to be 7,774 (based on tehsil level information from the district industries centre in 2010). A large proportion of these are concentrated in Nagpur (rural and urban) which forms a share of 50 percent of at NMA level. Hingna constitutes the second highest share with 20 percent.
Figure 5-15 : MSME units’ concentration across tehsils in NMA
Source: District industries centre, Nagpur
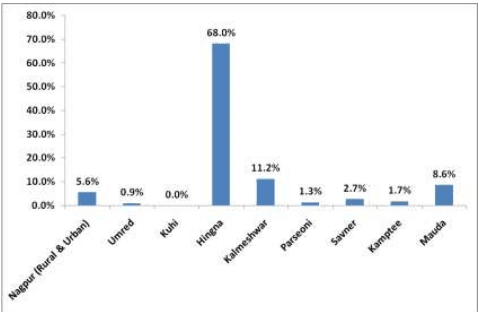
An interesting picture emerges when we also consider the investments in these enterprises across NMA.
Figure 5-16 : Investment in enterprises in NMA
Source: District industries centre, Nagpur
Though the total number of enterprises is largest in Nagpur (rural and urban), the total investment in enterprises is the highest in Hingna tehsil. The investment in enterprises in Hingna tehsil is 68 percent of
5-25
the total investment in the NMA. This indicates that besides Nagpur city, Hingna tehsil is emerging as the investment hotspot at the regional level.
Table 5-20Units and investments in NMA tehsils
Tehsil
No. of Units
Investment (in Rs. crore)
Nagpur (R & U)
3,883
518.81
Umred
409
81.09
Kuhi
25
1.00
Hingna
1,584
6,353.14
Kalmeshwar
366
1,043.09
Parseoni
266
120.06
Savner
419
250.75
Kamptee
580
163.25
Mauda
242
807.76
Total
7,774
9,338.95
Source: District industries centre, Nagpur
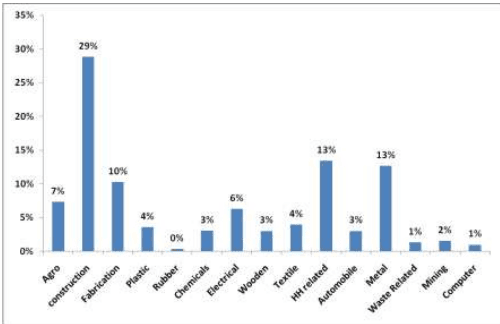
Sector-wise classification of industries within NMA (based on numbers provided by district industries centre) shows that construction, household and metal related units are dominant. Construction related activities have a lion share of 29 percent.
Figure 5-17 : Sector wise classification of Industries based on product and numbers
Source: District industries centre, Nagpur and CRIS analysis