The location of Nagpur in the geographic centre of the country makes it an important centre with strategic connectivity to the major cities in India by road, rail and air. The existing provisions and challenges observed with respect to transportation were assessed in order to propose road network plan and multi-modal transportation strategy for the Nagpur Metropolitan Area as part of the Development Plan 2032.
This chapter presents the details of review of past traffic studies in the study area, primary and secondary data collection carried out, traffic data analysis results and identification of issues with prevailing transport system. It covers:
assessment of traffic growth based on future land use;
development of traffic assignment model;
estimation of modal shift and traffic projections;
assessment of transport infrastructure requirements.
7.2Existing Transport System
The transport system in Nagpur comprises of roadways, railways and airways. Nagpur being centrally located in India, the road, rail and air network passes though it and it forms one of the important locations for the movement of people or goods from East to West or North to South. The important transport infrastructure presently available under these three heads in the study area is described below.
7.2.1 Regional Connectivity
7.2.1.1 Road Network
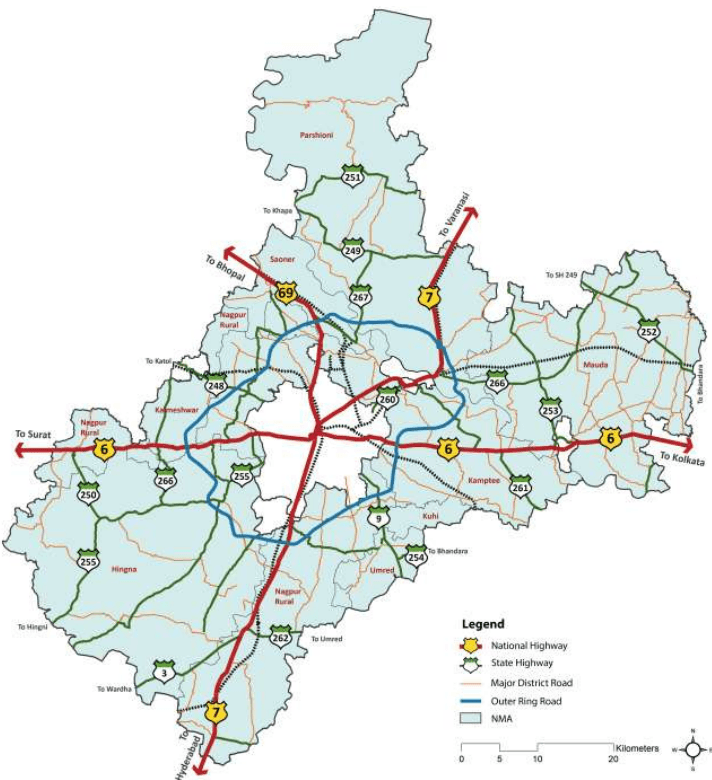
Three important national highways, NH-6 and NH-7, pass through the city and provide direct connectivity with a number of major cities of India. NH-69 is the third national highway that starts at Nagpur and connects the cities along it and further to national capital New Delhi through NH-3 and NH-2. The alignment of each of these highways and other roads is shown in Figure 7-1.
The NH-6 is an important connection between eastern and western parts of India. With a length of about 1,950 km, it starts at Kolkata in West Bengal and ends at Hazira in Gujarat passing through the states of Orissa, Chhattisgarh and Maharashtra.
7-1
Figure 7-1 : NMA Road Network
NH-7 is the longest highway in India with a length of about 2,370 km connecting Varanasi in Uttar Pradesh to Kanyakumari in Tamil Nadu. Passing through Madhya Pradesh, Maharashtra and Andhra Pradesh states, this acts as the major connection between Northern and Southern India. NH-69 connects Nagpur to Bhopal in Madhya Pradesh. Though the highway is only for a short distance, it provides good connectivity to the capital of Madhya Pradesh and also acts as the connection to NH-3 that leads to Gwalior, Agra, Delhi and North India through NH-2.
7-2
These national highways are being widened to 4/6 lanes under National Highway Development Programme (NHDP). NH-7 mainly has four lane configuration (except the part between Kamptee and Kanhan), while NH-6 is four laned only on western side of Nagpur at present. The part of NH-6 (between Pardi naka and Nagpur District boundary) and NH-69 has 2 lane configuration within the NMA.
7.2.1.2 Rail Network
As is the case with roads, Nagpur is endowed with immense benefits on account of its strategic location at the intersection of nationally important broad gauge rail lines of the Central Railway and South Eastern Railway network (Mumbai-Kolkata and Delhi- Chennai). It is thus an important rail hub in India connected to major cities like Mumbai,Kolkata,Delhi, Chennai, Hyderabad,Bangalore,Pune, and Ahmedabad.
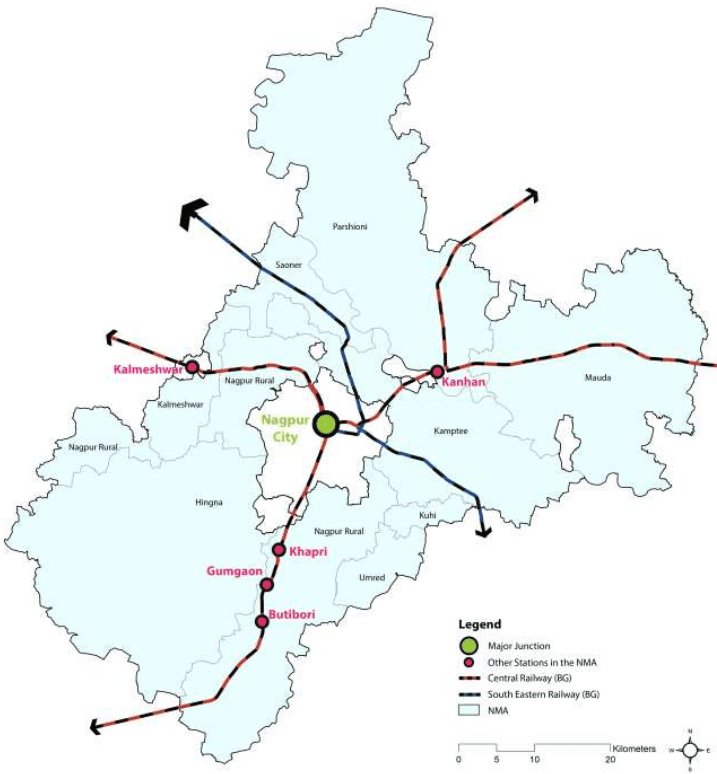
In addition to the broad gauge rail, narrow gauge rail connects Nagbhid and Chindwada (Madhya Pradesh) through Nagpur. About 50 trains ply on Nagpur – Delhi route, about 30 trains on Nagpur – Kolkata route and about 10 trains on the narrow gauge railway line every day. The total rail network length in the Nagpur Metropolitan Area is 126.44 km. The railway network in the NMA is shown in Figure 7-2. Besides the Nagpur City railway terminal, two important railway stations are located at Ajni and Itwari in the Nagpur City. Other important railway stations located in the NMA include Kanhan, Kamptee, Khapri, Gumgaon, Butibori and Kalmeshwar.
7.2.1.3 Air
The existing Nagpur airport is located near Sonegaon and it has been renamed as Dr. Ambedkar International Airport in year 2005. The air traffic control of Nagpur is the busiest in India because of its central location as more than 300 international flights fly over the city every day. The city is also connected with other cities of India through services operated by domestic carriers such as Air India, Jet Airways, Indigo, and GoAir connect Nagpur with major cities like Mumbai, Delhi, Ahmedabad, Pune, Bangalore, Hyderabad, Indore, and Kolkata. Around 37 destinations in India are within a time duration of less than an hour and half from Nagpur.
Nagpur is also emerging as an important player on the international aviation routes. It is connected to international destinations such as Bangkok, Singapore, Doha, Dubai, and Sharjah. Its unique location at the crossing of the air route between Europe and South- East Asia, as well as between South Africa and North-East Asia makes it a logical and ideal location for passenger and cargo hub. A multi-modal hub is being developed in Nagpur based on the hub-and-spoke system - the Multi-modal International Hub Airport (MIHAN).
7-3
Figure 7-2 : NMA Rail Network
7.2.2Transport and logistics in NMA
7.2.2.1 Road Network
Nagpur city has a good road network at local level. It has come in the national spotlight recently for its quality of roads, which were developed as part of the upgrades and renewal works under the Integrated Road Development Project (IRDP). IRDP has revolutionised the roads in the city, which now enjoy an excellent status, in terms of both coverage and quality.
7-4
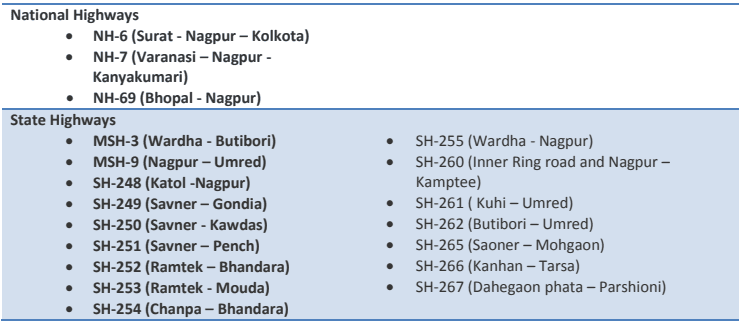
The City has a radial-ring road pattern with eight radial roads and a peripheral ring road. The radial roads consist of three national highways - NH-7 running north-south leading to Hyderabad in the south and Jabalpur in the north-east, NH-6 in east-west direction connecting Amravati in the west and Bhandara in the east and NH-69 leading to Bhopal in the north. The other radial roads are state highways leading to Hingna in the south-west, Katol in the north-west and Umred in the south-east. The major national and state highways in the study area are listed below and the alignment of each of them with reference to NMA and NMC are shown in Figure 7-1.
The National Highways Authority of India (NHAI) is responsible for development of national highways and Public Works Department (PWD), Maharashtra State Road Development Corporation (MSRDC) and Zilla Parishads are responsible agencies for the development of transport infrastructure and maintenance of the state highways, major/other district and village roads.
The Zilla Parishad maintains almost 5,000 km of rural roads in Nagpur District. Rural roads are normally designed for limited traffic such as tractors, carts, mini-buses and occasional buses and trucks. However, in the recent past, movement of heavy vehicles on these roads has increased manifold especially those related to the power plants and irrigation projects coming up in the region. A continuous movement of fully loaded heavy vehicles is observed on these roads which causes deterioration in the surface quality.
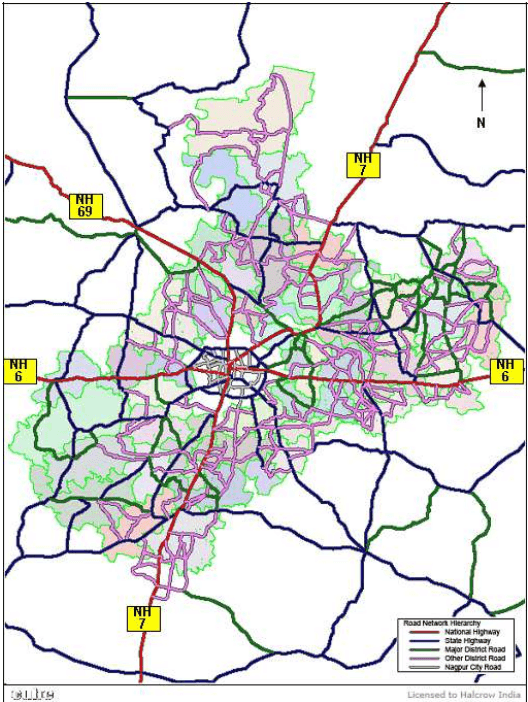
The NMA has a road network linking these radial roads by way of state highways, district roads and village roads. Most of these roads in NMA have varying carriageway widths varying from 7 m to 1 m. The length of important categories of roads in the study area is presented in Table 7-1. The graphical representation of road hierarchy in NMA is shown in Figure 7-3.
7-5
Table 7-1Road length in the NMA (outside the NMC)
Road Type
Road Length (km)
Road Share (%)
National Highway
145.59
7.84
State Highway
239.35
12.88
Major District Road
588.81
31.69
Other District Road
884.27
47.59
Total
1858.02
100.00
Figure 7-3 : Road hierarchy in the NMA
The traffic movement on some of these roads is not in line with such classification and there are instances of heavy traffic movement on lower category of roads. The lane configuration of these roads would be decided in line with future traffic levels and necessity of revised hierarchy would be studied. Also the roads
7-6
need to be upgraded/constructed with standard cross sections duly taking care of drainage, utilities as being done in National Highway Development Programme (NHDP).
7.2.2.2 Public Transport
The passenger demand in the study area has been managed at two levels:
“Level one” interaction is between the NMA and Nagpur City
“Level two” interaction is between the NMA and external zones (outside of NMA including towns of Kuhi, Umred, Kalmeshwar, Katol)
These transportation needs are being addressed by the existing public transportation system as well as the intermediate public transportation system.
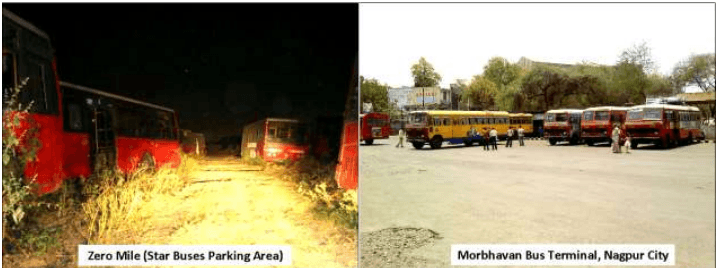
The public transport system for level one interaction is served by “Star Bus”. Presently the operator has a fleet of 470 buses, out of which about 390 are standard buses and 80 are mini buses. The total passenger handling capacity of the operator is about 2.5 lakh per day. The operator serves the NMC and limited peripheral developments around the NMC. The public transport system for level two interactions is served by MSRTC (Maharashtra State Road Transport Corporation) which moves passengers within the study area and to various parts of Maharashtra and neighbouring states. Some parts of the study area are also served by MPSTRC (Madhya Pradesh State Road Development Corporation) for passengers travelling to/from Madhya Pradesh.
MSRTC Bus terminal (Left) and star bus terminal (Right) in Nagpur
Zero Mile (Star Buses Parking Area)
Morbhavan Bus Terminal, Nagpur City
The Intermediate Public Transport (IPT) system serving the level one interaction is predominantly by auto rickshaw and taxi. These modes are either used for supporting the public transport (between home and bus stop) or as an alternate to public transport. IPT for level two interaction is taken care by share auto and share taxi as some areas in NMA have a lower frequency of buses, for example, Hingni to Hingna on SH-255; Kalmeshwar to Gondhkheri on SH-265; Kuhi to Kuhi Naka on SH-261. However, IPT modes have limited trip lengths outside NMA (ranging from 20 to 50 km).
The major city bus terminals for MSRTC are located at Sitaburdi and Gandhi Bagh in Nagpur city. Mofussil and long distance services are operated from bus terminals located at Ganesh Peth near Ashirwad theatre
7-7
and MSRTC bus stand near Nagpur Railway Station in the NMC area. Bus depots (for maintenance work) are presently located at Mokshadham, Wardhaman Nagar, Ganesh Peth and Ghat road in NMC area. Other MSRTC bus terminals in NMA area are located in Mauda, Kamptee, Hingna and Parshioni. The passenger terminal facility is not available for the Star Bus Service in NMC as well as in the NMA area.
7.2.2.3 Freight Transport
Freight traffic movement, management and freight handling is another important component of traffic management. Through freight traffic passes through the city with day time restrictions during peak hours. The northern section of the Outer Ring Road is under presently under construction (southern section is partially complete and open to traffic) and results in congestion for regional through traffic and inconvenience to the local road users at Nagpur. Other freight traffic bound for Nagpur continue to use city roads due to logistics related operations, mainly loading/ unloading, at Nagpur.
Loading/unloading operations are being managed mainly at four terminal locations in the City located at Vardhman Nagar, Khapri Naka, Rajendra Nagar Naka and Wadi Naka. However, the terminals lack desired facilities for drivers/helpers and freight operators and also the parking space available does not cater to the demand. On-street parking of freight vehicles is observed at many locations which cause hindrance to the normal traffic movement.
Due to the high volume of goods movement Nagpur also supports a high number of trans-shipment operations. The need for addressed quality warehousing facilities and logistic hubs is observed. A detailed discussion about this is presented under 7.6.2.
As part of the NMA Development Plan study various traffic and transportation surveys were carried out to assess the present traffic levels and travel characteristics. Bus and freight operators were also interviewed to appreciate the issues with the present transport system in the city as well as in the study area. The details of the surveys and salient findings are presented under 7.4.
7.2.3Vehicle Growth Trends
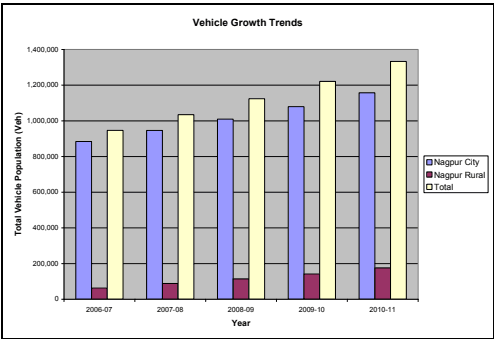
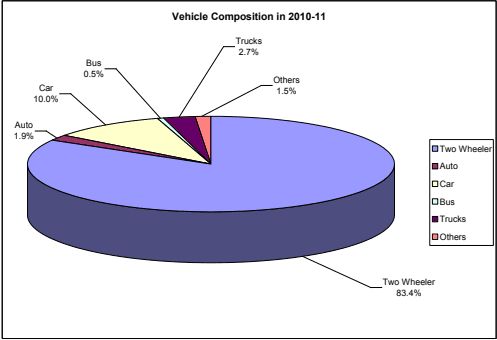
The vehicle registration data for Nagpur city and Nagpur rural areas was collected from the Regional Transport Office (RTO) for the period during 2006-2011 to assess the vehicle growth trends and its composition in the study area. The vehicle registration data is represented in Table 7-2. The vehicle composition for 2010-11 and growth rate during this period is shown in Table 7-3 and presented in Figure 7-4.
7-8
Table 7-2Vehicles registered in Nagpur
Year
Two Wheelers
Auto (Passenger and Goods)
Cars and Utility
Buses
Mini LCV Pickup and LCV
2 Axle
3 Axle and MAV
Others (Tractors)
Total
Nagpur City
2006-07
746,027
20,176
79,660
3,967
9,714
11,980
1,901
10,818
884,243
2007-08
799,023
20,721
87,606
3,890
10,373
11,513
1,925
10,980
946,031
2008-09
850,276
20,950
97,791
4,177
11,076
11,477
2,154
11,276
1,009,177
2009-10
905,327
21,850
109,050
4,646
11,750
12,193
2,883
11,560
1,079,259
2010-11
967,838
22,578
121,226
4,883
12,879
12,658
3,171
11,801
1,157,034
Rural
2006-07
4,582
106
161
55
146
6
33
176
5,265
2007-08
16,273
476
732
275
467
300
69
682
19,274
2008-09
31,827
981
1,466
355
764
797
84
1,301
37,575
2009-10
52,812
1,442
2,570
663
1,131
1,335
87
2,245
62,285
2010-11
73,214
1,927
4,696
1,086
1,598
2,065
151
3,749
88,486
Total Vehicles
2006-07
750,609
20,282
79,821
4,022
9,860
11,986
1,934
10,994
889,508
2007-08
815,296
21,197
88,338
4,165
10,840
11,813
1,994
11,662
965,305
2008-09
882,103
21,931
99,257
4,532
11,840
12,274
2,238
12,577
1,046,752
2009-10
958,139
23,292
111,620
5,309
12,881
13,528
2,970
13,805
1,141,544
2010-11
1,041,052
24,505
125,922
5,969
14,477
14,723
3,322
15,550
1,245,520
Source: Regional Transport Office, Nagpur (Urban and Rural)
Cars show an average annual growth of 13 percent while heavy trucks (3 axle and MAV) show a growth rate of 15 percent. Two wheelers and light trucks (mini LCVs, pick up and LCVs) show a growth in the range of 9-10 percent.
Table 7-3Registered vehicle growth and present composition
Area
Two Wheelers
Auto (Passenger and Goods)
Cars and Utility
Buses
Mini LCV Pickup and LCV
2 Axle
3 Axle and MAV
Others (Tractors)
Total
Average Annual Growth during 2006-2011 (%)
Nagpur City
6.7
2.9
11.1
5.3
7.3
1.4
13.6
2.2
7.0
Nagpur Rural
28.3
23.6
47.5
33.0
28.2
29.0
40.9
36.3
29.6
Total
8.6
4.7
12.9
10.7
10.1
5.3
15.3
10.6
8.9
Vehicle Composition in 2010-11 (%)
Nagpur City
83.6
2.0
10.5
0.4
1.1
1.1
0.3
1.0
100.0
Nagpur Rural
81.5
1.9
6.9
1.2
1.7
2.1
0.2
4.4
100.0
Total
83.4
1.9
10.0
0.5
1.2
1.2
0.3
1.5
100.0
Source: Regional Transport Office, Nagpur (Urban and Rural)
7-9
Figure 7-4 : Vehicle growth trends in Nagpur and composition in 2010-11
7.2.4 Accident Trends
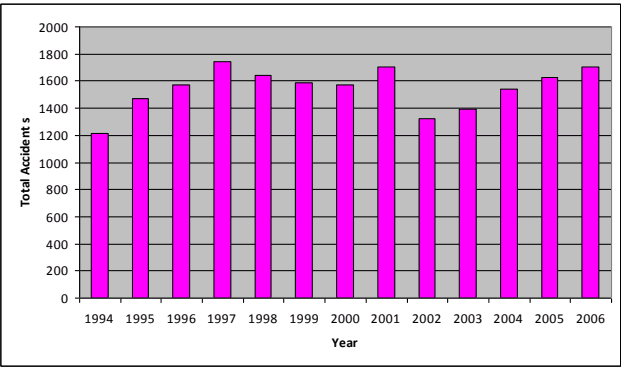
The data collected from Traffic Police for the period of 1994 to 2006 by L&T Ramboll in their report of year 2008 “Preparation of Master Plan/Perspective Plan for transportation system of Nagpur city for the year 2031” has been analysed and presented in graphical form in Figure 7-5. It is observed that the total accidents happened after 1995 are in the range of 1,400 to 1,800 except a slight drop in 2002.
7-10
Figure 7-5 : Accident trend from 1994-2006 in Nagpur
7.2.5Past Traffic Data Comparison
The past traffic data is available in L&T Ramboll report of year 2008 “Preparation of Master Plan/Perspective Plan for transportation system of Nagpur city for the year 2031”. The traffic surveys were conducted in 2007 on radial routes close to inner ring road. The traffic is compared with the results of present traffic surveys conducted by Halcrow at similar locations. The total mode wise estimated past traffic on radial roads along with present traffic from Halcrow counts are presented in Table 7-4.
Table 7-4Total estimated past and present traffic on radial roads (in vehicles)
Source
Two Wheelers
Cars
Auto-Rickshaws
Buses
Goods Vehicles
L&T Ramboll- 2007
55,831
20,046
5,538
3,717
15,781
Halcrow - 2011
59,255
25,793
5,632
6,158
18,582
Growth during 2007-2011
1.5%
6.5%
0.4%
13.4%
4.2%
From the above table, the traffic in 2007 and 2011 is used to work out the overall traffic growth rates during the last four years. The comparison shows the overall growth of 1.5 percent for two wheelers, 6.5 percent for cars, 0.4 percent for autos, 13.4 for buses and 4.2 percent for goods vehicles.
7.3Review of Past Traffic Studies
The past traffic studies carried out in the region were reviewed to study the various improvement proposals suggested, present status of the projects and to plan for the future transport infrastructure improvements for the NMA. The major relevant studies are:
Regional plan for Nagpur region, 1991-2011;
7-11
Traffic Studies for preparation of Integrated Road Development Plan by Crisil Advisory Services (CAS) and Frischman – Prabhu (FP) carried out for MSRDC in 2000;
Techno-economic feasibility study for Mass Rapid Transit System(MRTS) for Nagpur City by L&T – Ramboll carried out for MSRDC in 2003-2004;
Pre-feasibility of MRTS connecting Nagpur city with MIHAN and Butibori Industrial area conducted by L&T Ramboll in 2008 and
Feasibility study for a Multi-modal Hub Airport at Nagpur (MIHAN) by L&T-RAMBØLL Consulting Engineers Limited carried out for MSRDC in 2001.
7.3.1 Nagpur District Regional Plan
The Regional Plan was prepared by Nagpur Regional Planning Board for the duration 1991-2011 for planned development of Nagpur District. The plan included a number of proposals of infrastructure improvements including transportation. Important proposals under transport infrastructure under the Regional Plan are:
Development of Outer Ring road (bypasses to national and state highways) with alignment along Gausi (Manapur), Wihirgoan, Kapsi, Bhokara, Godkhairi, Fetri and Wanagongri
● Upgradation of SH-3 from Buti-Bori to Wardha/Yeotmal to national highways standards
Upgradation of SH-9 from Nagpur to Bhopal/Saoner and Saoner to Chhindwara to national highways standards
Proposals for new or upgradation of seven radial roads
Proposals for construction and upgradation of 16 existing state highways and other district roads as per Public Works Department Road Development Programme (1981-2001)
Proposals for 22 missing links in different tehsils
Development of Rail based High Capacity Mass Transportation Route (HCMTR) for serving upcoming new developments around NMC surroundings
Light Rail Transit (LRT) system along inner ring road, which was under construction during development of the plan
New rail connections that is Anjani to Kalmana and extension of defence siding up to Kalmeshwar forming a ring railway (which connect Hingna MIDC, Ambazari defence estate, New Nagpur, Kalmeshwar MIDC, Chindwara road, Koradi, Kamptee, APMC Wathoda and airport)
Conversion of existing narrow gauge lines to broad gauge lines in line with railway proposals
Proposals for one helipad each Buti Bori, Mauda, Umred, Saoner, Ramtek and Katol industrial estates
Some of these proposals are already implemented and some, such as the Outer Ring Road, are under implementation. The other road proposals and their alignment will be studied and suitably included in the Road Network Plan based on expected traffic levels in the NMA.
7-12
7.3.2 Study for Integrated Road Development Plan (IRDP)
A study was commissioned by Maharashtra State Road Development Corporation (MSRDC) to address the transport system of Nagpur as a whole. Nagpur, like any major city in the world, has a serious problem with the increasing vehicle population on the roads causing traffic jams and frequent accidents. The IRDP aimed at addressing these issues and achieving a better transportation system in Nagpur.
IRDP was implemented under Build - Operate - Transfer (BOT) basis to cater to the ever growing vehicular demand in Nagpur. MSRDC started this scheme in 2001 with an estimated cost of Rs. 350 crore. Funds required for this scheme were collected through contribution from various agencies and partly through toll collection. The scheme includes improvement/widening/strengthening of roads, construction of ROBs and RUBs for various governmental agencies such as NMC, NIT and PWD. The details of the works planned in IRDP are shown in Table 7-5.
Table 7-5List of activities of IRDP for Nagpur
S No
Description
Work Details (in number)
Amount (in Rs crore)
1
Improvement/widening/strengthening
Roads belonging to NMC
38 (93 km)
97.77
Roads belonging to NIT
11 (14.65 km)
18.39
Roads belonging to PWD
10 (66.84 km)
76.50
2
Improvement of railways
Railway Over Bridges (ROB)
9
103.00
3
Improvement of bridges/flyovers
Bridge/flyovers
5
54.6
Total
350.26
Source: Maharashtra State Road Development Corporation
Further details about the IRDP are presented under 7.5. The various projects being implemented/ proposed are suitably considered in the preparation of road network for the Development Plan.
7.3.3 Study for Mass Rapid Transportation System
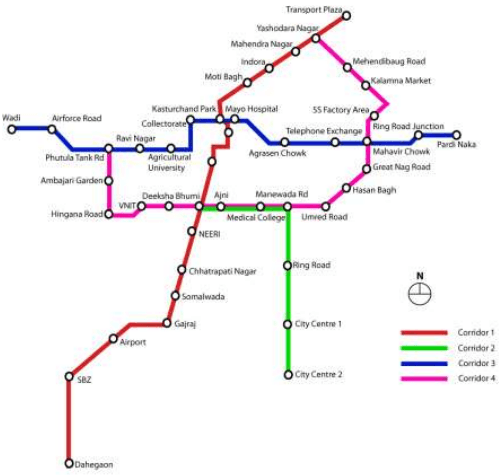
The traffic study done for Mass Rapid Transportation System (MRTS) for Nagpur City project shows that the travel pattern of the city is mainly along the radial corridors, which are along the North-South and the East-West directions. The main demand for travel was observed along the North-South corridors and in the East – West direction including the corridor encircling the core commercial/ market area of the City. This type of movement is expected for a city like Nagpur which has a ring and mono-nucleus structure.
In line with the demand, the MRTS network of the city has been proposed largely along the radial corridors and also to cater to the movement along the eastern and western parts of the city. This is expected to provide connectivity to different residential/ commercial activities which are fast growing in the peripheral areas outside CBD. The following four corridors were identified in MRTS Master Plan and Corridor 1 was recommended for implementation in Phase–I:
7-13
Corridor – 1: Corridor from MIHAN to Transport Plaza
Corridor – 2: Corridor from Dhantoli on Wardha Road to New City Centre
Corridor – 3: East-west corridor from Pardi Naka Park on Bhandara Road to Wadi on Amaravati Road via Kasturchand Park
Corridor – 4: Ring corridor from Amravati Road to Kamptee Road connecting Dhantoli on Wardha Road and Mahaveer Chowk on Central Avenue Road
The various corridors listed above are shown in Figure 7-6.
Figure 7-6 : Routes proposed to be served by MRTS
Out of these corridors, the study recommended the implementation of Corridor-1 in Phase–I. All these corridors fall in NMC area and the impact of these corridors and possible extension to NMA is incorporated in the transportation proposals for the Development Plan.
7.3.4 Study for Multi-Modal International Hub Airport at Nagpur (MIHAN)
As discussed before, the Government of Maharashtra has taken the initiative to develop a world-class Multi-modal International Hub Airport at Nagpur (MIHAN) through MADC as the SPV to cater to the needs of passengers and cargo. The development work has started in year 2005. The project will help in reducing the load on other busy airports in India by diverting the cargo and passenger traffic to Nagpur. It is also expected to make the city one of the most important business and economic centers in India and Asia.
7-14
The study was focused at the feasibility of such airport in Nagpur and addressed the various facilities/requirements to be setup and the political issues resulting from such a decision. The study suggested that MIHAN development should constitute of the following airport facilities:
Airport Complex: Includes a terminal complex, new runways and aprons, and control tower
Airport Facilities Complex: Includes a building connected by access roads, Elevated MRTS line with an elevated station, a station near the airport along the Howrah-Mumbai railway line, parking lot, cargo terminals, retail area, commercial area and Hotels.
Cargo Terminals: Inland container terminal and truck terminal
Infrastructural Facilities: Connectivity to the existing road network by arterial roads from major areas like Butibori and Nagpur city.
7.4Traffic Data Collection
In order to understand the prevailing traffic scenarios and the volume of traffic on different roads, data on different road networks, the existing traffic and travel pattern of vehicles on particular roads were collected through traffic surveys and secondary data collection from various sources in Nagpur. The details of data collection, its analysis and the results are presented in the following part separately.
7.4.1 Primary Data
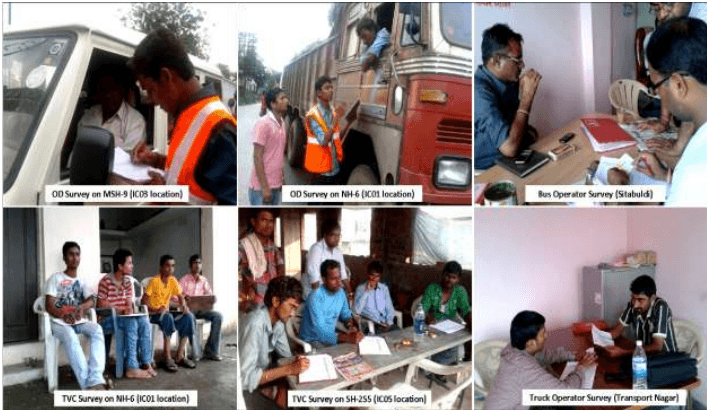
To understand the road, traffic and travel characteristics, a number of surveys were conducted at selected locations in the study area. While most of the surveys are conducted in NMA region a few opinion surveys are conducted in the NMC area to understand the issues with the existing transport system and to get an idea about future transport requirements for the city and surrounding areas. The following surveys were conducted during months of August and September 2011:
7/3/1-day mid-block traffic volume counts (Inner/outer cordon and other locations) at 13 locations;
1-day Origin-Destination (OD) surveys at 8 locations;
1-day turning movement surveys at 8 locations;
Public transport and freight transport operator surveys;
Parking surveys at important parking locations;
Road Inventory of identified road network;
Speed characteristics of identified road network.
7-15
Figure 7-7: Traffic surveys conducted in study area
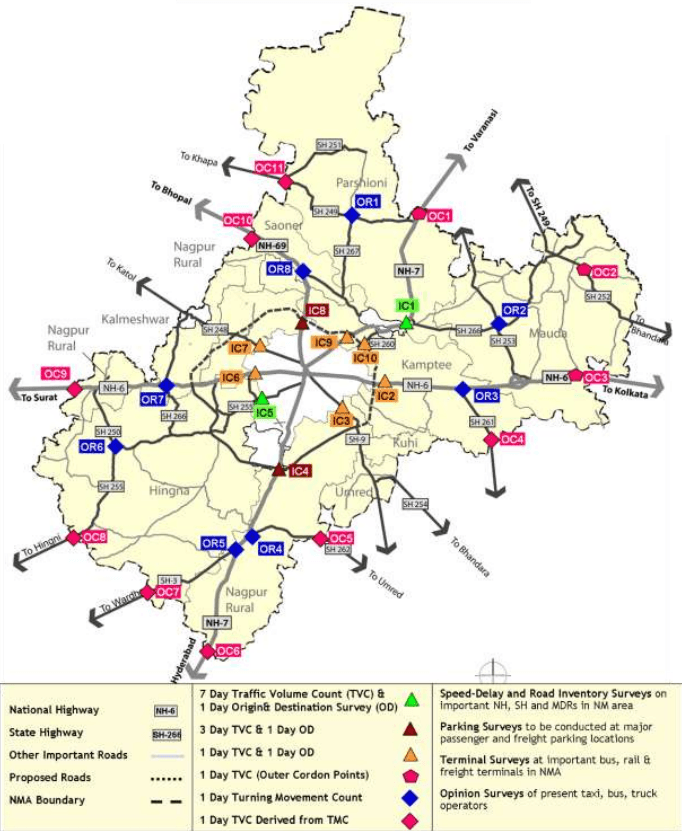
The list of locations and their survey schedule followed for these surveys is presented in Table 7-6. The pictorial representation of the different locations in NMA region is shown in Figure 7-8. The formats used for the surveys are presented in Annexure 7.1.
7.4.2 Secondary Data
In addition to the above primary data, the following secondary data has been collected from different agencies as listed below:
Road development proposals (Raste Vikas Yojna) 2001-2021 collected from PWD Nagpur division, MSRDC with their likely improvement and up gradation proposals;
Past traffic study reports for NMC and NMA (as listed in 7.3);
Past vehicle-wise registration details in Nagpur city and Nagpur rural ;
Toll/tax rates at all existing toll plazas in NMA;
Petrol and diesel fuel sale details;
Bus terminal characteristics (area, facilities available, and capacity), passenger ridership, routes in operation and depot with the addition future terminal proposals, and up-gradation details from MSRTC, NMC, NIT, and other private agencies;
Fleet size of star city buses, present parking details, and extents of operation in NMA area;
Freight terminal locations and their characteristics, capacity, parking charges, Octroi charges (tax), ingress-egress restrictions details within NMC; and
Parking as well pedestrian facilities and their future proposals in NMC and NMA areas.
7-16
Table 7-6Traffic survey locations and schedule
Location ID
Location Name
Duration (Days)
Date(s)
Traffic volume counts (TVC) – Inner Cordon Points
IC01
Kanhan Village (NH-7)
7 Days
28-Aug-11 to 3-Sep-11
IC02
Transport Nagar (NH-6)
1 Day
30-Aug-11
IC03
Dighori Naka (MSH-9)
1 Day
5-Sep-11
IC04
Khapri Naka (NH-7)
3 Days
5-Sep-11 to 7-Sep-11
IC05
Rajendra Nagar naka (SH-255)
7 Days
30-Aug-11 to 5-Sep-11
IC06
Wadi Naka (NH-6)
1 Day
7-Sep-11
IC07
Katol Naka (SH-248)
1 Day
3-Sep-11
IC08
Koradi Village (NH-69)
3 Days
29-Aug-11 to 31-Aug-11
IC09
Kamptee Naka (NH-7)
1 Day
9-Sep-11
IC10
Kanhan Naka (SH-260)
1 Day
9-Sep-11
Traffic volume counts (TVC) – Outer Cordon Points
OC01
Amdi Village (NH-7)
1 Day
3-Sep-11
OC02
Kodamedi (SH-252)
1 Day
12-Sep-11
OC03
Marodi (NH-6)
1 Day
9-Sep-11
Turning volume counts (TMC)
OR1
Parshioni (SH-267 & SH-249 Intersection)
1 Day
3-Sep-11
OR2
Tarsa (SH-253 & SH-266 Intersection)
1 Day
10-Sep-11
OR3
Kuhi Naka (NH-6 & SH-261 Intersection)
1 Day
8-Sep-11
OR4
Butibori (NH-7 & SH-262 Intersection)
1 Day
8-Sep-11
OR5
Butibori (NH-7 & MSH-3 Intersection)
1 Day
8-Sep-11
OR6
Yarangaon (SH-255 & SH-250Intersection)
1 Day
10-Sep-11
OR7
Chichbhuvan (NH-6 & SH-265 Intersection)
1 Day
8-Sep-11
OR8
Dhahegaon (NH-69 & SH-267 Intersection)
7-17
Figure 7-8 : Traffic survey location map
7.5Prevailing Traffic Scenario
The traffic characteristics such as traffic composition, peak hour traffic and interaction between NMA and NMC areas are presented below.
7-18
7.5.1 Traffic Characteristics
7.5.1.1 Average Daily Traffic
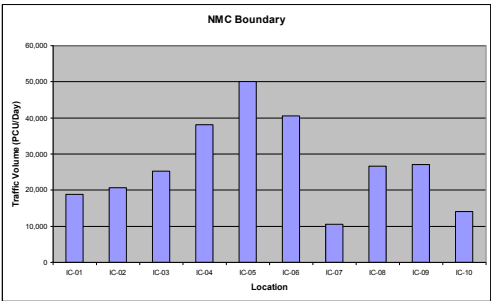
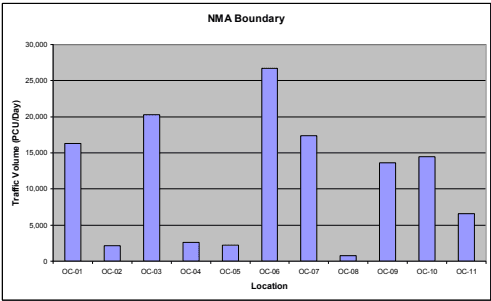
The TVC data collected during the surveys was analysed to estimate the average daily traffic (ADT) at the different locations duly applying daily correction factors on one-day and 3-day traffic volume counts. Passenger Car Units (PCUs) are estimated based on PCU factors as suggested in IRC: 64–1990 and IRC: 106-1990 for rural and urban roads respectively. The summary of ADT in terms of motorized, non-motorized and total vehicles and PCUs for all the locations is presented in Table 7-7. The vehicle-wise observed traffic at these locations is presented in Annexure 7.2. The observed average daily traffic at important locations at NMC and NMA boundaries is presented in Figure 7-9.
Figure 7-9 : Observed average daily traffic (PCUs) at NMC and NMA boundaries
The following are the important observations on the daily traffic observed at various locations in the study area:
Maximum traffic volume is observed at Rajendra Naka on SH-255 (IC-05) with around 50,000 PCUs, mainly due to presence of a number of educational institutions along the road.
7-19
NH-6 also carries a considerable traffic of more than 40,000 PCUs on western side of Nagpur (IC-06) and with 20,000 PCUs on the eastern side(IC-02). Similarly, NH-7 carries traffic of more than 38,000 and 18,000 PCUs respectively on southern (IC-04) and northern (IC-01) sides of Nagpur respectively. NH-69 has average daily traffic of about 26,500 PCUs at the NMC boundary. The traffic reduces towards NMA boundary along these national highways.
Most of the state highways in NMA area have traffic in the range of 2,000-9,000 PCUs while SH-3 (Wardha road) has traffic of about 17,000 PCUs.
Table 7-7Average daily traffic observed at various locations in 2011
Id
Location Name
Road Name
Section
Total Vehicles
Total PCUs
Motorized
Non-Motorized
Total
Motorized
Non-Motorized
Total
Inner Cordon
IC-01
Kanan Village
NH-7
Kamptee Cant.-Kanhan
16,466
1,279
17,745
18,207
555
18,762
IC-02
Transport Nagar
NH-6
Pardi Naka-Mahalgaon
15,524
1,005
16,529
20,191
546
20,737
IC-03
Dighori Naka
MSH-9
Digori Naka-Vihirgaon
21,382
2,735
24,116
24,112
1,115
25,227
IC-04
Khapri Naka
NH-7
Khapri - Dongargaon
30,700
527
31,227
37,951
222
38,172
IC-05
Rajendra Nagar naka
SH-255
Hingna T-point -MIDC
55,443
4,186
59,630
48,369
1,730
50,098
IC-06
Wadi Naka
NH-6
Ambazari lake - IRR
43,432
2,672
46,104
39,416
1,077
40,493
IC-07
Katol Naka
SH-248
IRR - Dahegaon
10,060
271
10,331
10,443
111
10,553
IC-08
Koradi Village
NH-69
IRR - Koradi
27,830
1,815
29,644
25,779
780
26,559
IC-09
Kamptee Naka
NH-7
IRR - Kamptee
25,506
1,741
27,247
26,276
744
27,020
IC-10
Kanhan Naka
SH-260
Kalamma Market - Kamptee
11,407
2,246
13,653
13,056
956
14,012
Outer Cordon
7-20
Id
Location Name
Road Name
Section
Total Vehicles
Total PCUs
Motorized
Non-Motorized
Total
Motorized
Non-Motorized
Total
OC-06
Sonegaon
NH-7
Sonegaon-MSH-3
16,819
1,488
18,306
25,941
747
26,688
OC-07
Wadgaon
MSH-3
Wadgaon-NH-7
11,237
1,237
12,474
16,766
622
17,387
OC-08
Hingni
SH-255
Hingni-SH-250
856
137
993
718
74
792
OC-09
Bazargaon
NH-6
Bazargaon-SH-265
8,836
432
9,267
13,395
219
13,614
OC-10
Patansaw angi
NH-69
Patansawan gi-SH-267
14,374
650
15,024
14,111
363
14,475
OC-11
Sawali
SH-249
Sawali-SH-267
5,716
470
6,186
6,363
255
6,618
Other Roads
OR-01
Parshivni
SH-267
Khaperkhed a-SH-249
5,592
660
6,252
4,422
407
4,830
OR-01
Parshivni
SH-249
Amdi-SH-267
8,064
942
9,006
8,264
557
8,821
OR-02
Tarsa
SH-253
Mauda-SH-266
8,047
1,061
9,108
7,174
608
7,782
OR-02
Tarsa
SH-253
Ramtek-SH-266
7,328
981
8,309
6,571
551
7,122
OR-02
Tarsa
SH-266
Kanan-SH-253
2,113
384
2,497
1,704
280
1,984
OR-02
Tarsa
SH-266
Tarsa-SH-253
2,604
373
2,977
7-21
7.5.1.2 Traffic Composition
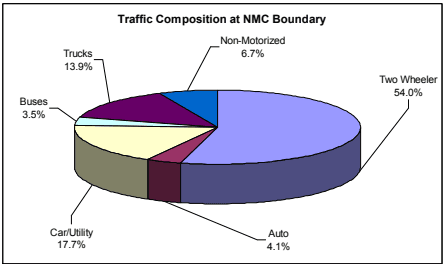
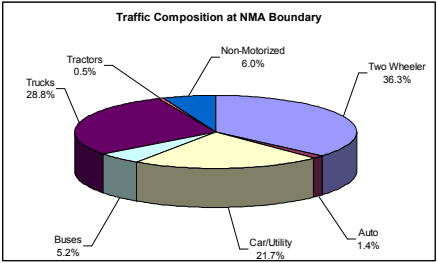
The traffic observed on the radial roads at the locations near NMC boundary and at NMA boundary is analysed to get the broad traffic composition of vehicles in the study area. The broad traffic composition results are presented in Figure 7-10.
The traffic at the NMC boundary predominantly comprises of two wheelers and cars with about 72 percent contribution while this is observed to be about 58 percent at NMA boundary. As observed, 29 percent of the total traffic comprises of freight vehicles at NMA boundary and about 14 percent at NMC boundary. The remaining modes exhibit a similar trend at both the boundaries.
Figure 7-10 : Observed traffic composition at NMC and NMA boundaries
7.5.1.3 Peak Hour Traffic
The hourly variation of traffic is also observed along with the peak hour factor (PHF) i.e. the maximum percentage of the total traffic in one single hour of the day. The peak hour factors observed at NMC boundary and rest of NMA locations are summarized in Table 7-8.
7-22
Table 7-8Observed peak hour traffic
Region
Peak Hour Traffic (PCUs)
Peak hour Traffic % (of ADT)
Observed Peak Hour
NMC boundary
17,256
6.62
10:00 hrs - 11:00 hrs
Rest of NMA
10,524
6.04
11:00 hrs - 12:00 hrs
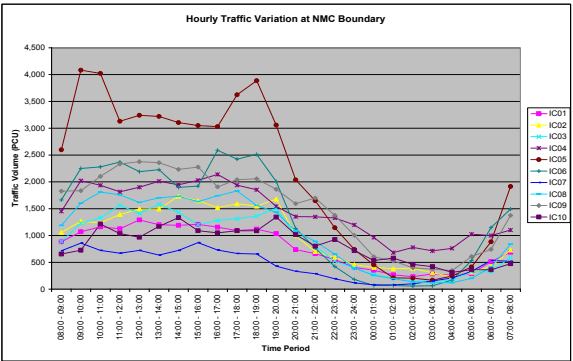
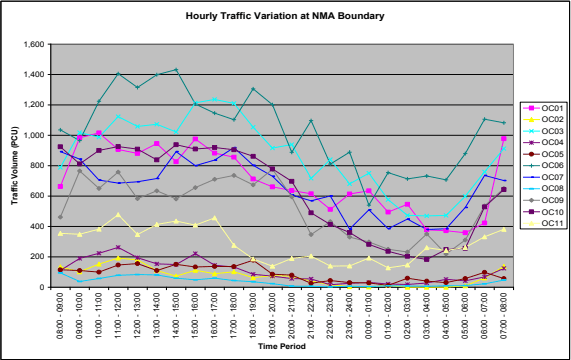
The PHF recorded on the radial roads in the study area is in the range of 6 -7 per cent of the ADT (in PCUs), and was recorded in the late morning time at both NMC boundary and NMA locations. Figure 7-11 below shows the hourly variation of average daily traffic observed in NMC and NMA boundaries. The pattern is highly intuitive with higher traffic movements during the day time.
Figure 7-11 : Hourly traffic variation on important radial roads in the study area
7-23
7.5.1.4 Average Annual Daily Traffic
The traffic plying on any road generally varies over different periods of the year depending on the cycle of different socio-economic activities in the regions through which it passes. Therefore, in order to have a more realistic picture of the traffic on the study area roads, it is required to assess its seasonal variation to estimate the annual average daily traffic (AADT). The Average Daily Traffic observed during the survey duration is multiplied by a seasonal correction factor (SCF) to get AADT.
The SCF is generally derived from secondary data sources such as past month-wise traffic data on the project road, monthly toll revenues from existing tolled highways in the immediate influence area, sales of fuel at different filling stations along the project highway, arrival of vehicles at establishments like APMC, truck terminals, and railway goods stations.
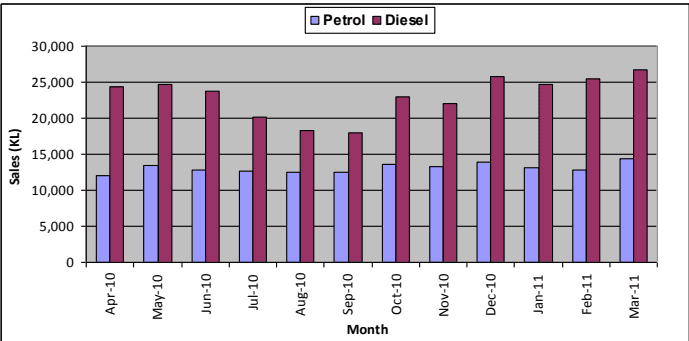
In absence of other information for the present study, the monthly fuel data for Nagpur district collected from different oil companies (BPCL, IOL, HP, Reliance, Essar) and considered for estimating SCF. The Graphical representation of the fuel sales is shown in Figure 7-12. As the present traffic surveys were conducted mainly in the month of September, the average of SCF estimated for petrol and diesel for September is considered for analysis. SCF of 1.04 for petrol and 1.16 for diesel based vehicles are adopted for the present study. From the fuel data analysis, the SCF of Diesel was estimated to be 1.28. However, as
Diesel is also used for alternative activities like agriculture, generators, etc. apart from transportation, the estimated SCF has been moderated by about 10 percent. For two wheelers, auto rickshaw, city and regional buses, as they generally ply on fixed and scheduled routes, a uniform SCF of 1.0 was considered. The AADT estimated for the various roads is summarized in Table 7-9.
Figure 7-12 : Monthly fuel sale of all stations in NMA
7-24
Table 7-9Average annual daily traffic
Id
Location Name
Road Name
Section
Total Vehicles
Total PCUs
Motorized
Non-Motorized
Total
Motorized
Non-Motorized
Total
Inner cordon
IC-01
Kanan Village
NH-7
7.1.5.5 Interaction with NMA and NMC
An analysis was carried out to find the traffic that is entering/exiting at NMA and NMC boundaries and the results are presented in Table 7-10 below. As observed from the table, about 292,000 vehicles daily enter and exit NMC from NMA while about 97,700 vehicles enter and exit NMA through various important radial roads in the NMA.
Table 7-10Interaction between NMA and NMC regions
S No
Location
Total Vehicles
Total PCUs
Motorized
Non-Motorized
Total
Motorized
Non-Motorized
Total
1
NMC Boundary
273,734
18,476
292,210
263,799
7,835
271,634
2
NMA Boundary
92,270
5,443
97,713
128,271
2,996
131,267
7.5.2.2Local and Through Traffic
Based on the travel pattern of vehicles, the traffic interaction with NMC from NMA, from outside NMA, through traffic to NMC and NMA etc has been assessed. The following five traffic streams would provide insight into the travel pattern of vehicles and its interaction with NMC at the study area.
Type 1: Originating in the NMA (Study area) and terminating in NMC (Ex: Mauda to Nagpur bus station) which is referred to as “NMA and NMC”
Type 2: Originating outside NMA and terminating in NMC (Ex: Jabalpur to Nagpur bus station) which is referred to as “Outside NMA to NMC”
Type 3: Originating in the NMA and terminating in the NMA (Ex: Hingna to Sita Buldi) which is referred to as “NMA to NMA”
7-28
Type 4: Originating out of NMC and terminating out of NMC (Ex: Hingna to Jabalpur) but only passing through NMC which is referred to as “Through to NMC”
Type 5: Originating out of NMA and terminating out of NMA (Ex: Hyderabad to Delhi) but only passing through NMA and NMC which is referred to as “Through to NMA”
The estimated trip composition for all the five categories are presented in Table 7-12.
Table 7-12Observed travel pattern by traffic streams (%)
Sr No
Traffic Stream
Two Wheeler
Auto Passenger
Car/Utility
All Buses
Light Trucks (Auto/MiniLCV/Pickup/LCV)
Heavy Trucks 2A/3A/MAV
Total Vehicles
1
NMC - NMA
82.1
81.5
55.3
41.3
37.1
17.6
67.2
2
NMC - Outside NMA
9.8
8.1
30.0
53.5
34.5
26.9
18.2
3
NMA - NMA
6.5
8.9
6.2
1.9
10.3
8.4
6.7
4
NMA - Outside NMA
1.6
1.4
6.3
1.1
14.4
21.1
4.9
5
7.5.2Travel Pattern
Traffic characteristics of the traffic plying on various roads were presented above, while travel pattern of vehicles and their characteristics are presented under this sector. Traffic and travel characteristics of vehicles in the study area together would be used for development of traffic model and future projections of traffic in the study area. Travel pattern of vehicles using the network are assessed through road side OD surveys.
7-26
OD surveys were conducted for 24 hours, by roadside interview method as described in IRC: 102-1988. Both passenger and commercial vehicles plying on the road were stopped on a random sampling basis and interviewed. Trained enumerators under the supervision of transport planners and traffic supervisors collected the trip characteristics using survey forms designed for this purpose. The OD survey elicited characteristics like origin, destination, local/non-local registration, length and purpose of the trip, occupancy, fuel type and age of vehicle for passenger vehicles. For goods vehicles, the survey elicited characteristics like origin, destination, local/ non-local registration, length of the trip, commodity & load being carried, and age of vehicle.
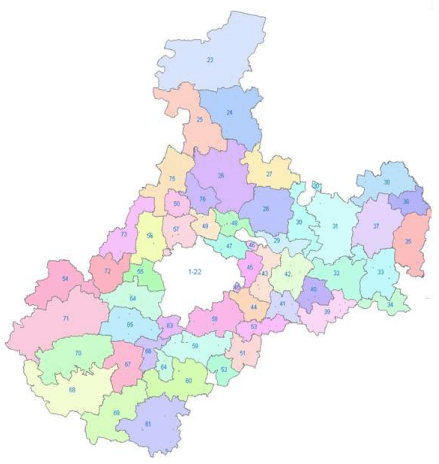
The survey was conducted at 8 locations on the boundary of NMC on all the major radial routes at Nagpur (NH-6, NH-7, NH-69, MSH-9, SH-248 and SH-255). The exact location of the surveys and the dates of survey can be seen in Table 7-6 and Figure 7-8 presented above. To broadly understand the nature and distance of the trip, a detailed traffic zoning system was created with 110 zones and the same is presented in Annexure 7.3. The traffic zoning system is shown in Figure 7-13.
7.5.2.1Regional Traffic Distribution
Based on the zoning system devised for this study, the sample data has been coded, analysed, and expanded using factors estimated based on the total AADT. Combined OD for the study area has been prepared based on likely travel pattern of vehicles observed at the eight OD locations. The zone-wise trip productions and attractions from the expanded O-D matrices for all the vehicle categories are presented in Annexure 7.4. Based on the above OD matrices, the regional distribution of vehicles is estimated and the results are presented in Table 7-11.
Figure 7-13 : Traffic zoning system
7-27
Table 7-11Percent traffic distribution of vehicles by regions
Region/Modes
Passenger vehicles
Freight vehicles
Two Wheeler
Auto Passenger
Car/Utility
All Buses
Light Trucks (Auto/ Mini LCV/ Pickup /LCV)
Heavy Trucks 2A/ 3A/ MAV
Total Vehicles
Nagpur City
50.8
48.8
46.4
48.4
38.2
23.2
46.4
NMA area
40.2
41.4
30.8
20.5
29.3
22.1
35.3
Rest of Nagpur
6.4
7.7
8.6
7.5
9.3
9.4
7.4
District
Wardha
0.6
0.0
3.1
5.9
2.1
1.5
1.4
Bhandara
1.0
0.8
3.0
2.9
1.7
3.1
1.7
Chandrapur District
0.4
0.2
7.2.5.3NMC and NMA Interaction
The interaction between NMA and NMC is studied to asses’ major traffic generation and attraction areas in Nagpur. The major areas of attraction points in both NMA and NMC for both Passenger vehicles are listed in Table 7-13.
Table 7-13Major traffic attracters/generators in NMC and NMA region
S No
NMA Region
NMC Region
1
Wanadongri
Nagpur Railway Station
2
Hingna
Rajbhavan
3
Wadi
Indora Chowk
4
Tarsi (Butibori)
Ratan Nager
5
Koradi
Gandhi Bag
6
Chinch Bhuvan
Ajni Chowk
7
Vihirgaon
Shanker Nager
8
Kanhan
Taj Bag
9
Fetri
Vardhaman Nager
7-30
S No
NMA Region
NMC Region
10
Khapri
Medical Chowk
11
Khapsi
Pardi
12
Mauda
Manewada
13
Pratap Nagar
Within the NMA, Hingna, Wanadongri, Koradi zones have many colleges and Institutions in the region which attract trips (education based) from various parts of the city. While the Wanadongri, Wadi, Tarsi (Butibori), Kanhan, Chinch Bhuvan, and Vihirgaon zones have majority of industrial areas and attract trips (employments based) from various parts of the city.
Within the NMC, Nagpur and Ajni are railway junctions and over the time they have turned into key local business hubs creating job and small business opportunities. Rajbhavan, Indora Chowk, Gandhi Bag, and Shankar Nagar, are both residential and commercial regions which attract and generate trips from/to various parts of NMA.
7.2.5.5Commodity and Tonnage Analysis
To have a broad understanding of the freight movement in the study area, the commodities have been sorted into 18 categories and commodity analysis was carried out. Table 7-16 shows the percentage split of freight being carried by various vehicle types and
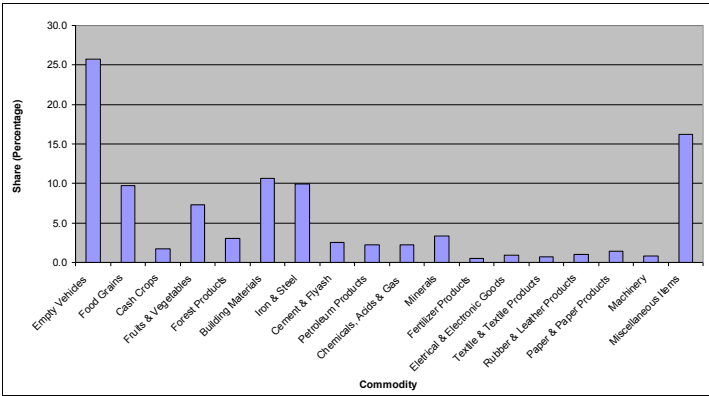
Table 7-17 shows the average commodity weight (tonnage) of goods being carried by the various vehicle types (only loaded vehicles). Commodity distribution for freight vehicles is shown in Figure 7-17. The major commodities being carried include food grains, building materials, iron and steel with nearly 30 percent contribution in the total freight traffic and empty vehicles are observed to be about 26 percent.
Table 7-16Distribution of commodities by vehicle type (in percentage)
Commodity
Auto-Goods
Small Trucks
2 Axle
3Axle/MAV
Total
Empty Vehicles
23.9
26.2
28.2
24.2
25.8
Food Grains
18.9
14.3
6.0
7.4
9.7
Cash Crops
3.1
2.7
1.0
1.2
1.7
Fruits and Vegetables
16.1
15.0
4.0
2.5
7.3
Forest Products
4.2
4.0
1.9
2.9
3.0
Building Materials
5.3
8.5
16.4
9.0
10.6
Iron and Steel
0.0
3.3
11.3
15.5
10.0
Cement and Fly Ash
0.3
1.1
2.6
3.9
2.5
Petroleum Products
0.0
0.3
2.9
3.6
2.2
7-32
7.2.5.4Work Purpose and Occupancy Analysis
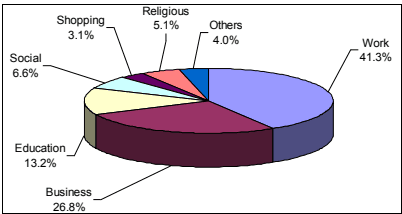
The movement of the passenger traffic on different roads in the study area is guided by factors as land use, purpose of travel and occupancy levels. Such variations are observed on roads at surveyed locations (Ex: More of educational trips have been observed on Hingna Road (SH-255) with higher passenger occupancy levels while on Umred Road (MSH-9), more of work related trips are observed with lower occupancy levels. The results are combined at various locations and the average levels are estimated which indicate the general pattern in the study area. The percentage split of trip purpose for private vehicles is presented in Table 7-14 and shown in Figure 7-16. As observed, in case of two wheelers its predominantly work and business related trips while for the autos and cars the purpose of the trip can be work, education or social trips. The average vehicle occupancy for passenger vehicles is shown in Table 7-15.
Table 7-14Purpose wise trip distribution (in percentage)
Trip Purpose
Two Wheeler
Auto Passenger
Car
Utility
Pvt. Mini Bus
Pvt. Stand. Bus
Total
Work
47.3
21.9
42.3
35.3
34.5
15.8
41.3
Business
26.1
39.0
29.3
31.4
0.0
0.0
26.8
Education
11.6
8.6
8.3
12.2
19.1
61.6
13.2
Social
4.1
16.5
5.4
6.5
36.4
20.0
6.6
Shopping
2.5
3.9
4.6
3.2
0.0
0.3
3.1
Religious
5.1
7.0
5.5
4.5
6.4
1.2
5.1
Others
7.2.5.6Fuel Type
To understand the number of vehicles using each fuel type, the Origin and Destination survey consisted of the question about fuel type being used by the vehicle. The percentage of each type of fuel used by the different passenger vehicles in the study area is tabulated in Table 7-18.
Two-wheelers use only petrol and larger vehicles (utility, buses) use only diesel. Auto Rickshaws (upto 95 percent) of larger size use diesel while the smaller ones use petrol or gas (very few). In case of car, majority users are still use petrol while a reasonable amount of diesel users have been identified and a very few gas users.
Table 7-18Fuel type distribution (%)
Vehicle Type
Petrol
Diesel
Gas
Total
Two Wheeler
100.0
0.0
0.0
100.0
Auto-Pass
94.5
4.7
0.8
100.0
Car/Utility
48.3
49.6
2.1
100.0
Bus (Mini/Stand.)
0.0
100.0
0.0
100.0
Trucks
0.0
100.0
0.0
100.0
7.2.5.7Local/Non-Local Vehicles
Both passenger and freight vehicles plying in the study area consist of vehicles registered as local (in the state of Maharashtra) and non-local (out of Maharashtra). The information is collected through OD survey to assess the quantum of non-local vehicles in the study area. The percentage split of local and non-local vehicles by vehicle type is presented in Table 7-19.
Table 7-19Local and non-local traffic (%)
Vehicle Type
Local
Non Local
Total
Two Wheeler
99.9
0.1
100.0
Auto (Passenger/Goods)
99.0
1.0
100.0
Car/Utility
97.3
2.7
100.0
Buses
95.8
4.2
100.0
Light Trucks (Auto/Mini LCV/Pickup/LCV)
85.0
15.0
100.0
Heavy Trucks (2A/3A/MAV)
63.3
36.7
100.0
The share of passenger vehicles registered under Maharashtra (MH) in the study area is very high (95-100 percent). However for freight vehicles, the share of non-local vehicles increases as the size (load carrying capacity) of the vehicle increases. Non local light trucks are about 15 percent while non-local heavy trucks are about 37 percent.
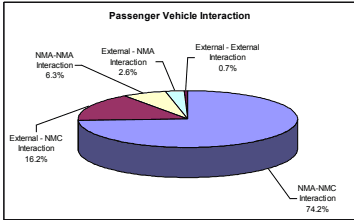
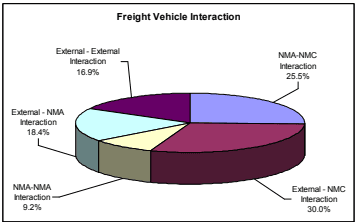
In case of two wheeler and passenger auto, about 82 percent of the trips are between NMC and NMA. In case of cars, 55 percent of the total cars have interaction with NMC while another 30 percent have interaction from outside NMA. A similar pattern is observed for buses where 41 and 54 percent have interaction with NMC and NMA respectively. Light trucks have about 37 percent interaction with NMA and 35 percent from outside NMA. Only 4 percent through traffic to NMA (Outside NMA-Outside NMA) is observed for light trucks. For heavy trucks, about 18 percent have interaction with NMC and 27 percent with outside NMC with 26 percent of through traffic. The graphical representation of the traffic interaction for various streams for passenger and freight vehicles separately in Figure 7-14.
Figure 7-14 : Traffic interaction for passenger and freight vehicles
7-29
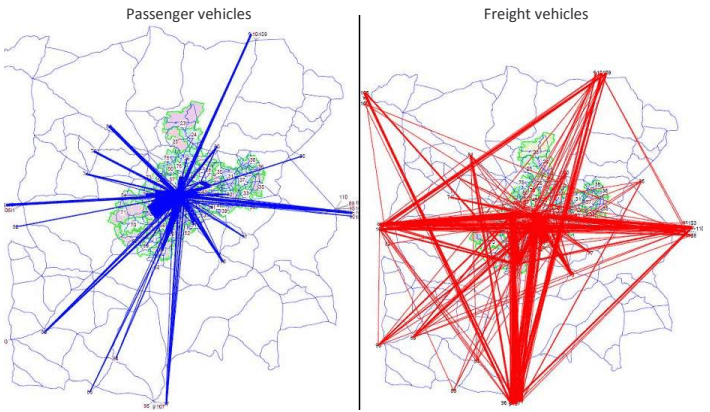
The other important finding from this data is the traffic that is just passing through Nagpur city. About 10 percent of the total is through passenger traffic and about 55 percent of the total freight traffic passes through Nagpur. It is understood that after the construction of the Outer Ring Road (ORR), this traffic will bypass using the ring road without entering the city. The travel pattern of passenger and freight vehicles at Nagpur based on OD surveys conducted at NMC boundary is shown in Figure 7-15. As observed major interaction of passenger vehicles is observed in NMC and NMA while freight vehicles show interaction at regional level.
Figure 7-15 : Travel pattern of vehicles in NMA region
1.8
4.1
2.2
2.6
1.1
Yavatmal District
0.0
0.0
0.9
2.6
0.5
0.5
0.3
Gondia District
0.0
0.0
0.3
0.1
0.2
0.5
0.1
Gadchiroli District
0.2
0.3
0.4
0.9
0.6
0.4
0.3
Rest of Maharashtra
0.2
0.3
2.2
4.3
8.5
8.5
2.0
Andhra Pradesh
0.0
0.0
0.1
0.2
1.8
5.5
0.7
Madhya Pradesh
0.2
0.2
1.7
2.0
1.6
2.7
0.9
Chhattisgarh
0.0
0.1
0.7
0.6
1.7
6.2
0.8
Uttar Pradesh
0.0
0.0
0.1
0.0
0.4
2.1
0.2
Rest of India
0.1
0.2
0.1
0.1
2.0
11.7
1.3
Total
100.0
100.0
100.0
100.0
100.0
100.0
100.0
The major share of passenger traffic is observed from Nagpur City and the NMA. It ranges from 69 percent for buses to 91 percent for two wheelers. A share of 6 to 9 percent of passenger traffic is also observed from the rest of Nagpur District (Kalmeshwar, Khapri, Kamptee and such area in Nagpur District but outside NIT area). This trend is justifiable as the passenger traffic (except for buses) is short distance in nature and has major influence in the areas close to Nagpur.
The same trend is observed for light trucks and the majority of the trucks (up to 77 per cent) are from Nagpur (Nagpur City, NIT jurisdiction, Rest of Nagpur District) and a small share is from rest of Maharashtra. However in the case of heavy trucks, about 54 percent of them are from Nagpur District. The rest is divided among various parts of India of which 18 percent are from Maharashtra and about 28 percent from the rest of India.
Within the NMA, Wanadongri, Wadi and Tarsi (Butibori) all have MIDCs. While Kanhan is major coal mining area and Khapri has a HP Fuel Gantry. Hence all these regions have heavy truck movement to the city.
Within the NMC, the main railway station, Ajni Chowk, Rajbhavan, Indora Chowk and Gandhi Bag are the key local business hubs attracting small and medium sized trucks. While Pardi and Vardhaman Nagar are part of an Octroi free zone and hence attract a major share of heavy trucks.
Commodity
Auto-Goods
Small Trucks
2 Axle
3Axle/MAV
Total
Chemicals, Acids and Gas
0.6
0.6
2.9
3.3
2.2
Minerals
0.0
0.1
3.5
6.0
3.3
Fertilizer Products
0.0
0.1
0.4
0.9
0.5
Electrical and Electronic Goods
1.1
0.4
0.8
1.4
1.0
Textile and Textile Products
0.0
0.1
0.8
1.2
0.7
Rubber and Leather Products
0.0
0.8
0.9
1.4
1.0
Paper and Paper Products
0.6
1.7
1.3
1.6
1.5
Machinery
0.6
0.2
0.7
1.5
0.8
Miscellaneous Items
25.6
20.8
14.5
12.6
16.2
Total
100.0
100.0
100.0
100.0
100.0
Table 7-17Average load being carried by loaded freight vehicles
Vehicle Type
Average Load (Tones)
Auto-Goods
1.0
Mini LCV
1.2
Pickup
1.7
LCV
5.9
2 Axle
10.2
3 Axle
14.3
MAV
19.8
Figure 7-17 : Commodity distribution of freight vehicles
7-33
3.3
2.9
4.6
6.9
3.6
1.2
4.0
Total
100.0
100.0
100.0
100.0
100.0
100.0
100.0
7-31
Table 7-15Average occupancy of passenger vehicles
Vehicle Type
Average Occupancy
Two Wheeler
1.6
Auto-Pass
3.9
Car
3.0
Utility
5.0
Mini Bus
17.9
Standard Bus
32.0
Figure 7-16 : Trip purpose distribution of passenger vehicles
7.5.3Road Network Characteristics
The present road network characteristics of important roads in NMA are also surveyed for lane configuration, pavement condition, median width and shoulder conditions and vehicle speeds to carry out capacity analysis and assess the present level of service (LOS) offered based on observed traffic levels. The
7-34
road characteristics for the roads in the study area and the results of capacity analysis are presented in this part.
7.5.3.1 Lane Configuration and Prevailing Speeds
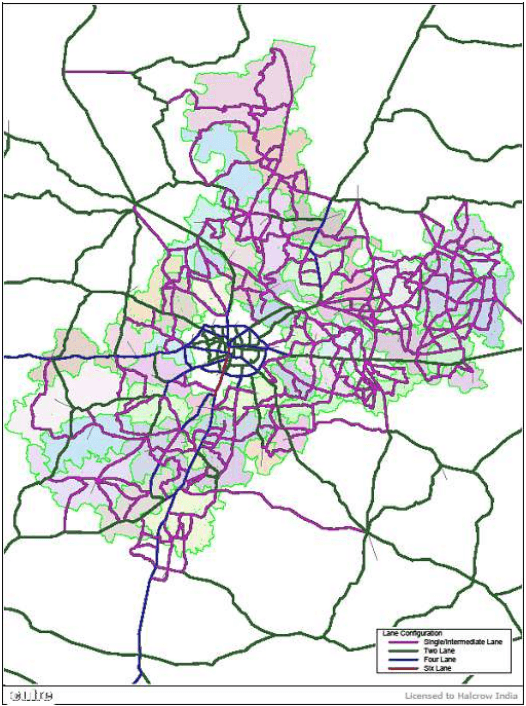
Road network in the study area mainly has 2 lane or narrow 2 lane configuration while NH-7 and NH-6 are partially upgraded to 4 lane configuration recently. The journey speeds on the road network are in the range of 30-40 km/h on national highways and 20-30 km/h on various state highways and district roads. The detailed lane configuration by road sections and traffic stream speeds of vehicles observed though road inventory and speed-delay surveys are shown in Annexure 7.5. The summary of lane configuration of various important roads in the study area is presented in Table 7-20 and the same is graphically depicted in Figure 7-18.
Figure 7-18 : Present lane configuration of important roads in the NMA
7-35
Table 7-20Lane configuration and prevailing traffic stream speeds in the study area
Road
Road Type (Divided-1, Undivided-
No. of Lanes
Distance (m)
Journey Speed (km/hr)
National Highway
2)
NH-7 North
Divided/ Undivided
4/2
46.00
34.5
NH-7 South
Divided/ Undivided
4
43.50
41.4
NH-6 East
Undivided
2
58.40
31.2
NH-6 West
Divided/ Undivided
4
41.40
42.1
NH-69
Undivided
2
23.60
33.7
State Highway
MSH-3
Undivided
2/1.5*
15.90
28.9
MSH 9
Undivided
2/1.5
19.40
34.2
SH-248
Undivided
2/1.5
19.20
36.0
SH-249
Undivided
2/1.5
49.50
36.7
SH-250
Undivided
2/1.5
11.70
28.1
SH-251
Undivided
2/1.5
12.20
27.1
SH-252
Undivided
2/1.5
19.40
24.8
SH-253
Undivided
2/1.5
10.00
20.7
SH-254
Undivided
2/1.5
6.00
30.0
SH-255
Divided/ Undivided
4/2
48.80
31.5
SH-260 (Inner Ring Road)
Divided/ Undivided
4/2
41.80
23.0
SH-260 B
Undivided
2/1.5
31.00
22.4
SH-261
Undivided
2/1.5
27.00
25.3
SH-262
Undivided
2/1.5
15.10
18.5
SH-265
Undivided
2/1.5
11.80
29.5
SH-267
Undivided
2/1.5
18.10
24.7
SH-345
Undivided
2/1.5
30.80
21.7
SH- 353
Undivided
2/1.5
9.30
31.0
Major District Roads
MDR 20
Undivided
1.5/1
30.70
30.2
MDR 22
Undivided
1.5/1
44.75
32.5
MDR 23
Undivided
1.5/1
23.90
32.3
MDR 25
Undivided
1.5/1
31.40
24.7
MDR-31
Undivided
2/1.5
28.00
21.2
MDR-33
Undivided
2/1.5
30.90
18.5
MDR 34
Undivided
1.5/1
15.60
28.3
Other District Roads
Patansaongi - Brampuri
Undivided
1.5/1
9.80
26.4
Navegaon- Surdhara
Undivided
1.5/1
6.30
24.2
Kamptee-Koradi
Undivided
2/1.5
15.40
28.5
Hudekeshwar Road
Undivided
2/1.5
24.80
24.2
Hingna-Dongargaon
Undivided
2/1.5
13.00
29.1
(via Gumgaon)
*1.5 – Intermediate Lane Configuration
7-36
7.5.3.2 Capacity Analysis
The speeds observed on any stretch of road are dependent on the condition of the road, the traffic volume levels on that road and the existing capacity of the road. Capacity analysis is carried out to assess the level of service offered by road sections in the study area. The v/c ratio that is volume of traffic on the road and capacity of the road would give idea about the congestion levels and level of service. The level of service (LOS) is defined as under, where LOS A refer to free flow conditions while LOS F refers to congested conditions.
LOS A – V/C ratio upto 0.30
LOS B – V/C ratio between 0.30 and 0.50
LOS C – V/C ratio between 0.50 and 0.70
LOS D - V/C ratio between 0.70 and 0.85
LOS E - V/C ratio between 0.85 and 1.00
LOS F – V/C ratio more than 1.00
The total traffic levels, capacity available and the estimated level of service (LOS) on the various roads in the study area are shown in Table 7-21 . As observed, the roads close to NMC boundary reached their capacity and operate under LOS C, D or E at various locations indicating the necessity of capacity augmentation. Most of the roads in NMA area are operating under capacity as of now and they need to be widened in line with future expected traffic levels.
Table 7-21Capacity and level of service analysis for roads in study area
Id
Road Name
Section
Average Daily Traffic(PCU/Day)
Capacity (PCU/Day)
V/C Ratio
LOS
Inner Cordon
IC-01
NH-7
Kamptee Cant.-Kanhan
20,311
35,670
0.57
C
IC-02
NH-6
Pardi Naka- Mahalgaon
22,914
35,670
0.64
C
IC-03
MSH-9
Digori Naka-Vihirgaon
27,365
28,500
0.96
D
IC-04
NH-7
Khapri - Dongargaon
41,568
85,670
0.49
B
IC-05
SH-255
Hingna T-point - MIDC
52,753
69,000
0.76
C
IC-06
NH-6
Ambazari lake - IRR
42,583
85,670
0.50
B
IC-07
SH-248
IRR - Dahegaon
11,314
28,500
0.40
B
7.5.3.3 Transport Infrastructure Improvements
A number of important road networks and other transport infrastructure improvements are under progress and they are expected to provide better level of service to the road users. Important improvement projects in the study area are listed below:
Development of Outer Ring Road (ORR)
The total length of the proposed outer ring road is 84 km. The alignment of the road passes through Gavsi, Manapur, Sondapur, Jamatha, Kotewada, Sumthana, Shiv Madka, Kirimati, Khadka, Sukali, Hingna, Raipur, Wanadongri, Sangam, Sawargota, Pendhri and Gondkhairi villages. The outer ring road will have ROBs at Tarodi (SEC Railway – Kolkata line), Jamtha (Central Railway – Mumbai line) and Bharatwada (Central Railway – Delhi line). When outer ring road is complete it will connect Kalmeshwar, Hingna and Butibori MIDCs.
The NHAI has taken up the construction of ORR connecting NH-7 (Nagpur-Jabalpur), NH-6 (Nagpur-Raipur) and NH-7 (Nagpur-Hyderabad) covering a length of 21.6 km under PPP under NHDP, Phase–VII. The feasibility study of balance section of ORR connecting Amravati road (NH-6), Saoner road (NH-69) and Jabalpur road (NH-7) is under progress.
A 30 km stretch of road – Gavsi Manapur to Kamptee – Kanhan bypass is being constructed under National Highway Authority India’s North – South Corridor and expected to open for traffic in 2012. The existing 2 lane section of Gondhkhairi – Gavsi Manapur stretch will be widened to a four lane road under Jawaharlal Nehru National Urban Renewal Mission (JNNURM). Remaining outer ring road will be constructed by the PWD.
Integrated Road Development Plan (IRDP) for Nagpur
The most important project as regard to the city transport is ‘Integrated Road Development plan for Nagpur’ by MSRDC. IRDP was prepared under Build Operate and Transfer (BOT) basis to cater the increasing traffic demand of the city. The scheme includes improvement/widening/strengthening of roads, construction of ROBs and RUBs for various governmental agencies such as NMC, NIT and P.W.D. Total length of roads is more than 150 km and cost of the project is Rs. 350 crore. The list of ROB and RUB and their status in Nagpur as of now are given in Table 7-22.
Table 7-22Status of ROB and RUB being implementated in Nagpur city
S No
Name of ROB
Estimated Cost (in Lakhs)
Status
1
ROB Santra Market
5,534.00
Started (Jan. 2006)
2
ROB near Itwari Railway Station
404.29
Not Taken Up
7.6Passenger/Freight Terminals
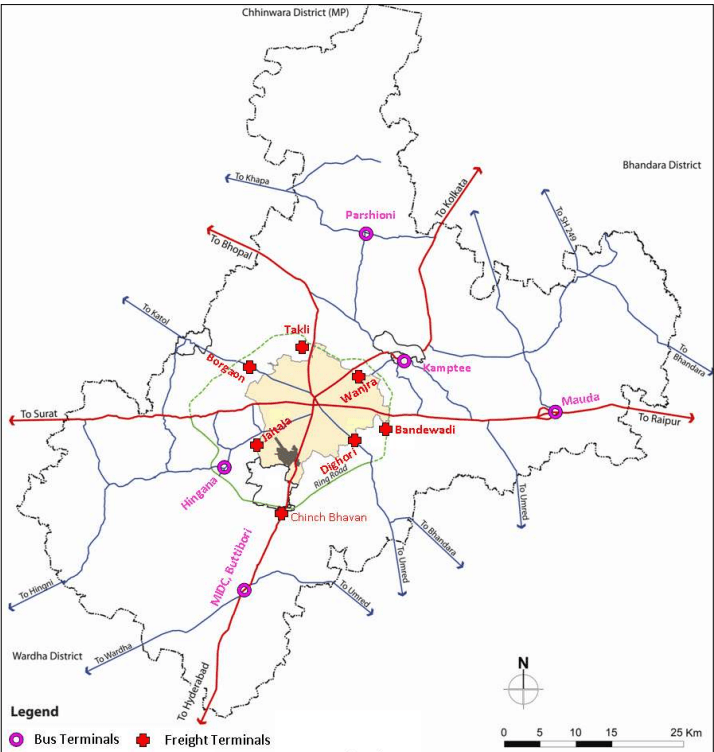
Passenger terminals for bus, rail and air traffic and freight terminals for truck traffic are some of the important infrastructure facilities generally required for effective and efficient management of passenger traffic and freight traffic. The availability of required infrastructure facilities and its efficient integration with the rest of the transport network at these terminals provide smooth operation and minimise discomfort to the passengers and vehicle drivers, operators. The important terminals present in NMC and NMA are presented in Figure 7-19.The terminals are surveyed to assess their characteristics and operators surveys are carried out to appreciate operational issues as discussed below. This will assist in planning for the future terminals in the study area.
7-40
Figure 7-19 : Major transport terminal locations in NMC and NMA
7.6.1Bus Terminals
As observed through traffic count and origin-destination surveys, about 9,663 buses ply on important radial roads at NMC boundary and about 4,700 buses at NMA boundary. They carry about an estimated 2.8 lakh passengers at NMC boundary and 1.4 lakhs at NMA boundary. This demand is expected to increase in line with the proposed land use in NMA and may necessitate alternate public transport systems for meeting passenger demand.
7-41
7.6.1.1 Bus Terminal Surveys
MSRTC is the government entity that runs the transport service for intercity, interstate, interstate travel. It has two bus stations in Nagpur city at Ganeshpeth (CBS-1) and Morbhawan (CBS-2) at Sitabuldi. MSRTC operates around 1600 daily services from CBS-1 to long and short distances within state and to major cities like Jabalpur, Indore, Hyderabad in other surrounding states. It also operates 750 daily services from CBS-2 to short distances within several districts of Vidarbha. The fleet size includes semi-luxury 2x2 Neem Aaraam, Parivartan 2x2, Asiad 2x2 and ordinary ST bus 2x3. Madhya Pradesh State Road Transport Corporation (MPRTC) runs their buses from Ganesh Tekdi bus stop. The details of bus terminals in NMC area are summarised and given in Table 7-24. There are several bus depots located in NMC area as listed in Table 7-25 where maintenance work, washing, fuel fillings are carried out.
Table 7-24Bus terminals in NMC area
S No
Name of Bus Terminal
Area (hector)
Number of Bays
Operation
Facility Available
1
Ganeshpeth (CBS-I)
4.12
205
UrbanRural
Controller Room with pass issueWork shop and DepotPolice stationOnline reservation counterCanteen and Retail areaFuel stationParcel collection stationRest Room with Toilets (M & F)
2
Morbhawan (CBS-II)
1.04
11
Rural
Controller Room with pass issueSnacks barDrinking waterUrinals Online reservation CounterDriver/ Conductor rest room with toilets
3
Ganesh Tekdi
0.47
4
Intra State
Controller Room with pass issueSnacks barDrinking waterUrinals
Table 7-25Bus depots characteristics in NMC area
S No
Name of Bus Depot
Area (Hectares)
Facility Available
12
Mokshdham Harihar Mandir, Wardhman nagar.
2.512.52
Department Manager Quarter Dept. Building (Office Building) Rest Room (M&F) with Toilets
Washing Ramp Cycle stand Fuel stations Security room
3
Ghat road
1.31
Fuel station Rest room (M & F ) with toilets
4
Divisional workshop
2.43
Fuel station
7-42
S No
Name of Bus Depot
Area (Hectares)
Facility Available
▪ Rest room (M & F ) with toilets
The details of bus terminals available in NMA area at tehsil level are summarised in Table 7-26. A new bus terminal has been proposed in MIDC ButiBori area.
Table 7-26Important bus terminals in NMA area at tehsil level
S No
Name of Bus Terminal
Area (Hectors)
Number of Bays
Facility Available
1
Mauda
0.36
3
Controller Room with pass issue Snacks bar Drinking water Urinals
2
Kamptee
0.59
4
Same as Above
3
Hingna
1.74
3
Same as Above
4
Parshioni
0.42
4
Same as above (under construction)
5
MIDC, Butibori
2.50
Proposed Terminal
Nagpur Mahanagar Parivahan Limited (NMPL) is the company formed with elected municipal corporators on board that caters to the city public transport. It has contracted Vansh Nimay Infraprojects Limited (VNIL) to run city buses. It has a fleet of 470 low floor Star Buses that serve around 2.5 lakh citizens daily in the urban, suburban, metro areas. Of the total fleet 80 are low floor mini buses, and 390 are low floor 50 seater star buses. 240 buses are acquired under JNNURM and 230 are acquired under purchase-runtransfer basis by VNIL.
The present parking facilities for star buses are located at Parwardhan Maidan (0.483 hectare), Zero Mile (0.074 hectare), Baidhya Nath Chowk (0.278 hectare) and Hingna Naka (0.836 hectare). The buses require another 40 hectare area for parking. As of now Star buses don’t have any designated bus terminals in NMC as well as NMA area.
7.6.1.2 Bus operator Survey
To appreciate the present bus operational issues, infrastructure facilities and to get suggestions on future locations and desired facilities, bus operator survey was conducted with a sample of operators (43 operators) in Nagpur area. The important findings of the surveys are presented below.
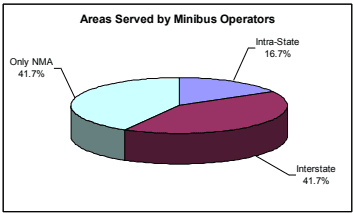
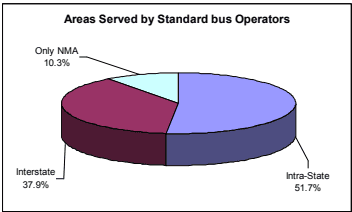
The composition of their operation by interstate and intrastate regions is presented in Figure 7-20. As observed, 42 percent of mini buses and 38 percent of standard buses operate outside Maharashtra state.
Figure 7-20 : Percentage split of bus operators by regions
7-43
The opinion of bus operators is noted on a set of important public transport infrastructure issues with rating of good, average and bad conditions. The results of their response to the issues are presented in Table 7-27. As observed from the table, bus operators are happy with the passenger demand and gave mixed response on condition of fleet, transport infrastructure in NMA/ NMC and rental charges. The main issues coming out this survey are quality of terminal facilities, parking space, road network condition, traffic management and operation and maintenance costs. This indicates the necessity of development of state of art terminal facilities, good quality road network, parking facilities and better traffic management.
Table 7-27Bus operator response to different issues
Issues
Response (%)
Good
Average
Bad
Total
Present Terminal/Stopping Points
4.7
41.9
53.5
100.0
Number of Passengers Served
65.1
34.9
0.0
100.0
Quality of Terminal Facilities
0.0
39.5
60.5
100.0
Parking Spaces Available
0.0
9.3
90.7
100.0
Condition of Fleet
27.9
67.4
4.7
100.0
Road Network Condition
IC-08
NH-69
IRR - Koradi
28,083
35,670
0.79
C
IC-09
NH-7
IRR - Kamptee
28,977
85,670
0.34
B
IC-10
SH-260
Kalamma Market - Kamptee
15,245
28,500
0.53
B
Outer Cordon
OC-01
NH-7
Amdi - Ramtek
18,352
80,500
0.23
A
OC-02
SH-252
Kodamendhi - Morgaoon
2,278
29,330
0.08
A
7-37
Id
Road Name
Section
Average Daily Traffic(PCU/Day)
Capacity (PCU/Day)
V/C Ratio
LOS
OC-03
NH-6
Mouda - Borgaon
22,876
34,500
0.66
C
OC-04
SH-261
Kuhi Naka-NH-6
OC-05
SH-262
Junapani-NH-7
5,193
23,000
0.23
A
OC-06
NH-7
Sonegaon-MSH-3
7,336
23,000
0.32
B
OC-07
MSH-3
Wadgaon-NH-7
9,671
23,000
0.42
B
OC-08
SH-255
Hingni-SH-250
8,435
23,000
0.37
B
OC-09
NH-6
Bazargaon-SH-265
7,735
23,000
0.34
B
OC-10
NH-69
Patansawangi-SH-267
2,104
23,000
0.09
A
OC-11
SH-249
Sawali-SH-267
2,489
23,000
0.11
A
Other Roads
OR-01
SH-267
Khaperkheda-SH-249
27,075
23,000
1.18
E
OR-01
SH-249
Amdi-SH-267
2,936
23,000
0.13
A
OR-02
SH-253
Mauda-SH-266
43,405
80,500
0.54
B
OR-02
SH-253
Ramtek-SH-266
43,263
23,000
1.88
E
OR-02
SH-266
Kanan-SH-253
2,494
29,330
0.09
A
OR-02
SH-266
Tarsa-SH-253
43,768
80,500
0.54
B
OR-03
NH-6
Gumthala-SH-261
29,636
23,000
1.29
E
OR-03
NH-6
Mauda-SH-261
19,112
29,330
0.65
C
OR-04
NH-7
Dongargaon-SH-262
810
34,500
0.02
A
OR-04
NH-7
Butibori-SH-262
847
23,000
0.04
A
OR-05
NH-7
Butibori-MSH-3
828
23,000
0.04
A
OR-06
SH-255
Hingna-SH-250
18,003
80,500
0.22
A
OR-06
SH-250
Bazargaon-SH-255
15,101
23,000
0.66
C
OR-07
NH-6
Wadhammna-SH-265
6,420
23,000
0.28
B
OR-07
SH-265
Kalmeshwar-NH-6
14,667
34,500
0.43
B
OR-08
NH-69
Koradi-SH-267
15,746
23,000
0.68
C
OR-08
SH-267
Khaparkheda-NH-69
7,192
23,000
0.31
B
7-38
3
ROB at LC-2 near Mehandibagh
1,203.37
Work in Progress
4
RUB for Service Road ROB near Kalumna Market
100.002,945.35
Work Completed Project Approved
5
ROB Mekosabaugh
1,089.52
Work Completed
6
ROB Mankapur
1,152.28
Work in Progress
7
ROB at Mangalwari
727.64
Work in Progress
8
ROB at Maskasath
200.00
Not Taken Up
7-39
S No
Name of ROB
Estimated Cost (in Lakhs)
Status
9
RUB at Mominpura
250.00
Not Taken Up
10
RUB at Narendra Nagar
1,000.00
Work Completed
11
ROB at Narendra Nagar
4,000.00
Work Paused
Apart from this, connectivity to other cities in Maharashtra is being improved by making existing 2 lane roads to 4 lane roads. One of the important projects is the improvement of the Nagpur-Aurangabad-Mumbai highway from its present two lane configuration to a four lane expressway. The project length of the proposed express highway is 686.55 km and the proposed cost of the project is Rs 700 crore. The project has been divided into eight consultancy packages and 29 construction packages. Consultants have been appointed for four of the consultancy packages and agencies for ten packages have been fixed and work is under progress. For remaining works, appointment of agencies is in progress.
Road Proposals in NIT Region
As per the Road Development Proposals (2001-2021) for Nagpur District, there are new proposals in NIT region. The list of important projects is given in Table 7-23.
Table 7-23Proposed road developments in NIT region
S No
Road name
Section Name
Length (km) Remarks
1
NH-7
Outer ring Road (ORR)
23.00
2
Bypass
Kamptee - Kanhan 2-lane bypass
26.40 Part of ORR
3
SH-296
Kalmeshwar Town Bypass
14.00 Earlier SH-248 ( Katol Road)
4
SH-336
Parshioni Town Bypass
4.50 Earlier SH-249
5
MDR-36
Thane- Kachhimedh- Matkazari
9.00
6
MDR-37
Khapri - Matkazari
4.00
7
MDR-38
Chikhaldhokda - Nandara - Chnoda
5.00
8
MDR-44
Kaladongri - Kharsoli - Pipla
9.00
2.3
34.9
62.8
100.0
Traffic Management
2.3
23.3
74.4
100.0
Regional routes Toll/Tax
18.6
30.2
51.2
100.0
O&M costs
0.0
27.9
72.1
100.0
Rental charges
9.3
86.0
4.7
100.0
NMC Transport Infrastructure
16.3
51.2
32.6
100.0
NMA Transport Infrastructure
0.0
53.5
46.5
100.0
Apart from above, the major issue raised by the private bus operators is regarding the location of terminals and their condition. Majority of the terminals are in the city and the long distance buses (inter-state and intra-state) have to enter the city, causing congestion on the streets as well as unnecessary delay for passengers. Hence the development of new bus terminals in the study area is beneficial for reducing the congestion and increasing the efficiency. Also, the construction of such terminals would make the operation of the busses between the NMC and NMA much more efficient and effective with better level of service to the passengers. The suggested locations of such terminals as per the operator’s opinion are tabulated in Table 7-28.
Table 7-28 : Preferred bus terminal locations in NMA
7-44
Preferred Location
Road Name
Butibori
NH-7 (South)
Degori Naka
MSH-9
Kamptee
NH-7 (North)
Kapsi Naka
NH-7 (South)
Kondhali
NH-6 (West)
Koradi Naka
NH-69
Pardi Naka
NH-6 (East)
Pili Nadi
NH-6 (East)
Somalwada
NH-7 (South)
Teka Naka
NH-7 (North)
Wadi
NH-6 (West)
Wardha Road
NH-7 (South)
Amravati Rd
NH-6 (East)
Sonegaon
NH-7 (South)
The basic facilities to be provided or looked at while constructing new bus terminals would be as listed below
Providing regular and frequent bus service from the city to the bus terminal
Facilitating the terminal with a reasonable parking area for busses as well as private vehicles. The same parking area could be used as a park and ride facility for passengers moving into the city
The terminals need a workshop area for repair and maintenance of the busses using the facility.
The terminal area should be provided with other retail and safety facilities (restaurants, ATM, accommodation and medical facilities)