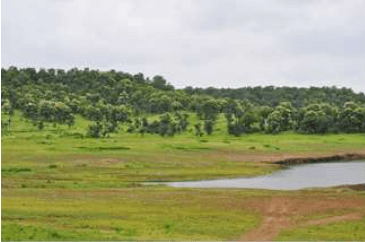
The NMA exhibits topographical features that of the Nagpur district. The area has an average elevation between 350 m and 260 m above sea level (Survey of India topographical map). Its relief features are characterised by the residual hill ranges of the Satpudas and their detached members, enclosing undulating black soil valleys between them. The topography is typical of the Deccan traps1 having flat-top and terraced features, low buttressed sides, and isolated knolls. The landscape changes eastwards and north-eastwards due to the change in the underlying rocks. The greater part of the NMA is an undulating plateau. The terraced landscape of the Deccan lavas on the west has several flat-topped hills well-furrowed on their sides by streams. In the north, the upland ranges are an extension of the Satpuda ranges; these are narrow in the west but widen to a breadth of about 19 km (twelve miles) towards east. South of this upland range stretch the Ambegad hills. Major landforms observed in the region are Pediplain2, Inselbergs 3 and Piedmont zone4in the northern part of the NMA area. Valley fills exist in the north-west to south-east direction. Few highly dissected areas are noticed towards the south.
Landforms of the NMA (Source: Halcrow)
1 A large igneous province located on the Deccan Plateau of west-central India
2 Broad, relatively flat rock surface formed by the joining of several pediments (a gently inclined erosion surface carved into bedrock)
3 A residual relief feature – an isolated hill, knob, ridge or small mountain that rises abruptly like an island from a gently sloping or virtually level surrounding plain
4 Area at or near the foot of a mountain
3-1
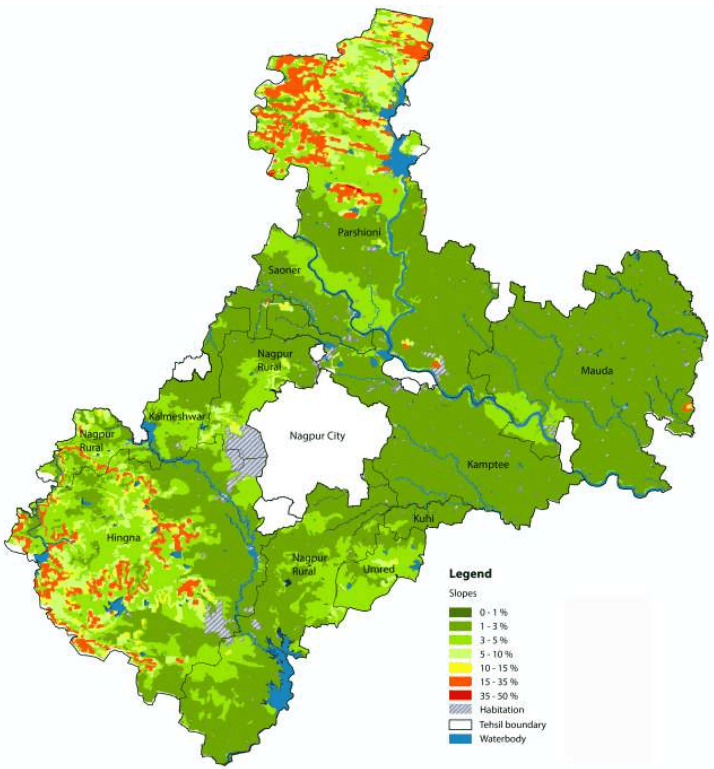
Figure 3-1Figure 3-1 shows the slope within the NMA. As observed, more than 90 percent of the project area ranges within 0-3 percent slope. Northern and the south-western parts have a steeper slope as compared to the rest of the NMA in the range of 10-35 percent. Table 3-1 presents a summary of percent slopes in the NMA.
Table 3-1Summary of percent slopes in the NMA
Slope
Percent Area Covered
0 - 5 %
99.78 %
5 - 10 %
0.08%
10 - 15 %
0.01%
15 - 35 %
0.14%
35 - 50 %
0.01%
3.2Geology
3.2.1 Geomorphology
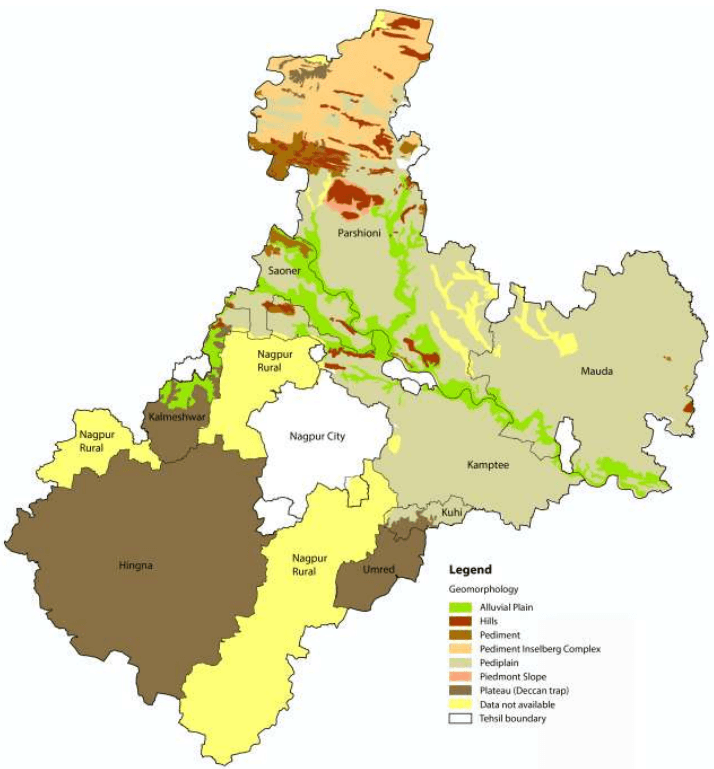
Geomorphologically, the NMA can be divided into two parts - the region west of Nagpur city occupied by the Deccan trap formation and the region east of Nagpur city occupied by the metamorphic and crystalline series. The other two formations found in the region are the Lametas and the Gondwanas. These two formations found only along the junction of the trap are crystalline.
Geologically, crystalline rocks of Archean age, sedimentary rocks of Permian age and alluvium of recent age underlie the NMA area. Almost all the major geological formations starting from ancient crystalline rocks in the north and east to volcanic flows of Deccan trap in the west and south are presented in the area. Besides these, there are relatively younger sedimentary rocks, which are coal bearing.
3-2
Figure 3-1: Slope in the NMA
Data source: MRSAC; Map prepared by Halcrow
3-3
Figure 3-2: Geomorphology in the NMA
Data source: MRSAC; Map prepared by Halcrow
3-4
3.2.2 Soil Type and Textures
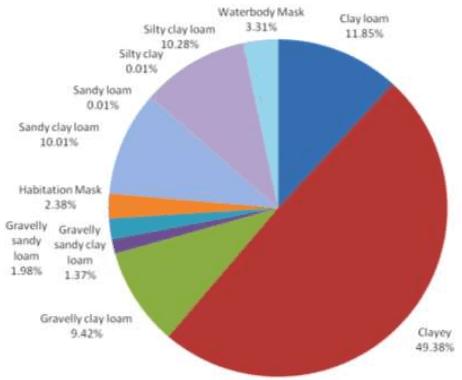
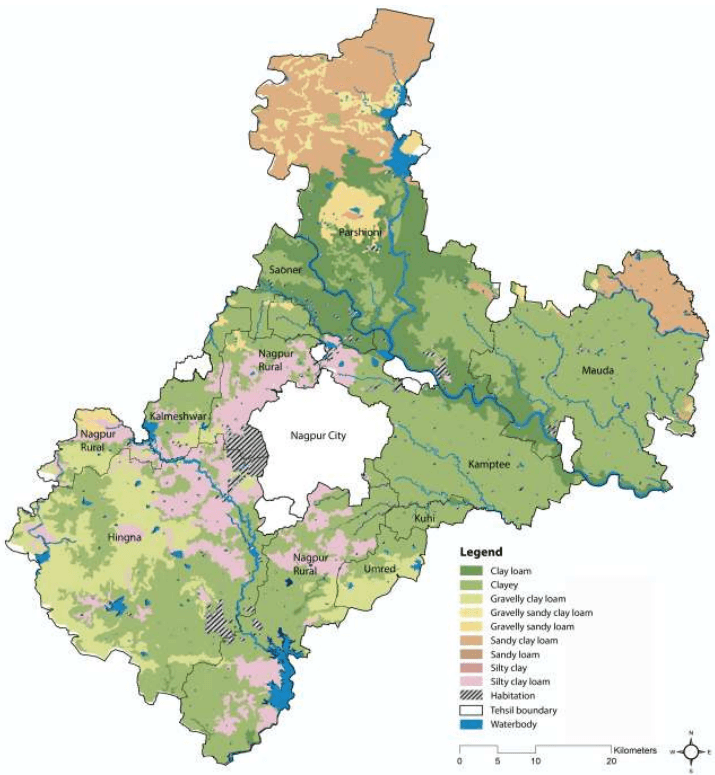
Soils in the NMA represent black cotton soils of the Deccan traps formed from the cotton soil modified by intermixtures with soil derived from the gneissic formation that surrounds it. The black colour in the soil is generally due to the presence of organic matter and iron, alumina, lime, magnesium, potash, phosphorous and nitrogen. This black cotton soil determines to a large extent the nature of the agriculture or cropping pattern in the area. Figure 3-3 shows the land share by soil textures and Figure 3-4 shows the soil textures within the NMA.
The major soil types are moderately alkaline in nature with pH ranging 8.0 to 8.5 covering the central, eastern, south eastern and southern parts of the district. The soils in NMA have medium to very high water holding capacity and moderate to very high erodibility. Majority of land within the NMA is cultivable, however it exhibits limitations in the level of productivity at many locations due to low soil depth and poor irrigation facilities. Towards the east of the district, the underlying rock is crystalline and yields to sandy soil that is more suitable for irrigation.
As observed, there is a high concentration of clayey loam along the periphery of the Kanhan and Pench rivers. The extreme north of NMA, which is the forest region of Parshioni, consists of Sandy Clay Loam for the most part. There is a large concentration of Silty clay loam to the east and south-east of the city limits. The largest share among all soil types is occupied by clayey soil (about 50 percent).
Figure 3-3: Land share by soil texture
3-5
Figure 3-4: Soils in the NMA
Data source: MRSAC; Map prepared by Halcrow
3-6
3.2.3 Rocks and Minerals
Industrial minerals and rocks found in various geological formations of the district are tabulated below in the Table 3-2.
Table 3-2Useful rocks and minerals in different geological formations
Geological formations
Minerals and rocks of economic value
Soil
Brick clays and kankar
Deccan basalts
Building material (dolerite and basalts),ornamental stones and ochres
Lameta
Building material, limestones
Kamthis
Building material, abrasives and clays
Barakar
Coal and clays
Talchirs
Nil
Archaean Rocks
Abrasives; building material; ores of copper, manganese, lead and tungsten; limestone; ornamental stones and clays
Source: District Gazette of Nagpur
Geologically the area comprises rock formations ranging from Archean to recent ages. The central portion of the district comprises of Granulites, granitic gneisses, Migmatic gneisses with calc-silicates, Quartzites, Ultramafics and Amphibolites of Archean to Paleo proterozoic age. The Sausar group of Meso Proterozoic age covers the northern part with Schists, intercalated quartzite, calc-gneiss; quartzite, muscovite; crystalline limestone and dolomite. Coal seems to occur in the Barakar formations underlying the Kamptee formations.
Lameta beds of Cretacous age are exposed between northwest of Nagpur and south of Umred as disconnected patches. Almost half of the district is occupied by Deccan traps with 60 m thick pile of basaltic flows of Cretacous to Paleozoic age. At places, inter trappings (sedimentary) beds separate individual flows. Alluvial deposits of Pleistocene to recent age are found along Vena and Kanhan rivers. Important coal deposits are located in Kamptee and Umred. Clay deposits associated with rocks of Kamptee formation are located near Nagpur. Almost half of the study area is covered by basalt and associated lavas.
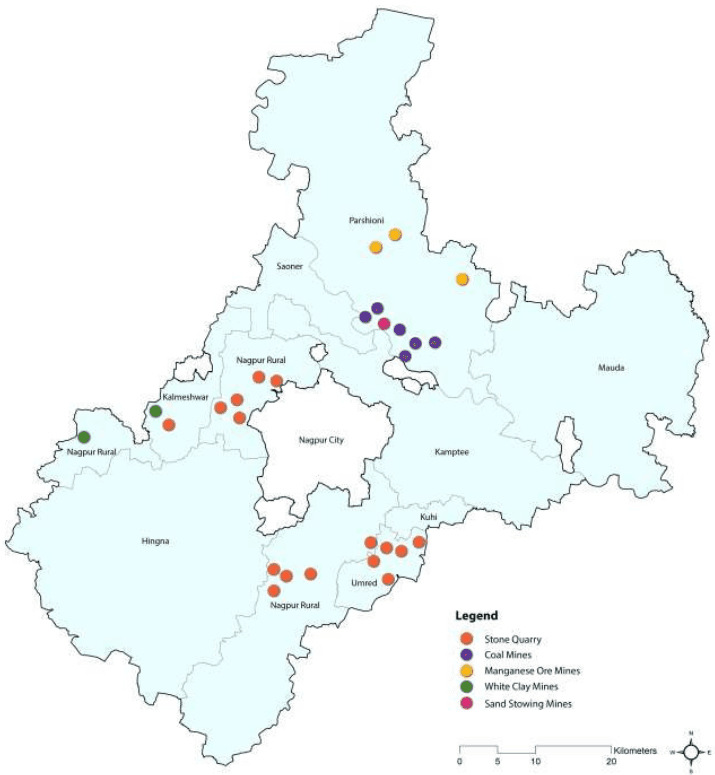
Currently, minerals such as manganese, coal, white clay and sand (stowing) are mined within the boundaries of the NMA, in Parshioni, Saoner, Kalmeshwar and Nagpur rural tehsils. Figure 3-5 illustrates the locations where existing mining operations are being carried out in the NMA.
3-7
Figure 3-5: Minerals of the NMA
Source: District Resources Map, Geological Survey of India
3.3Climatology
The climate of Nagpur is dry and tropical, typical to the central part of Deccan plateau. As per the India Meteorological Department (IMD) four seasons, summer, southwest monsoon, post monsoon, and winter are observed in the region. Summer starts from March and continues up to middle June. This is followed by the southwest monsoon lasting up to September. October and November constitute the post monsoon season. Weather is generally cold during December to February. The IMD operates a meteorological station at Nagpur airport. As meteorological data is applicable for over 40 km from the location of the
3-8
station this information is considered to be representative of the climate within the NMA. The IMD data of this station for the duration 2001-2011 has been studied and presented in this chapter.
3.3.1 Temperature
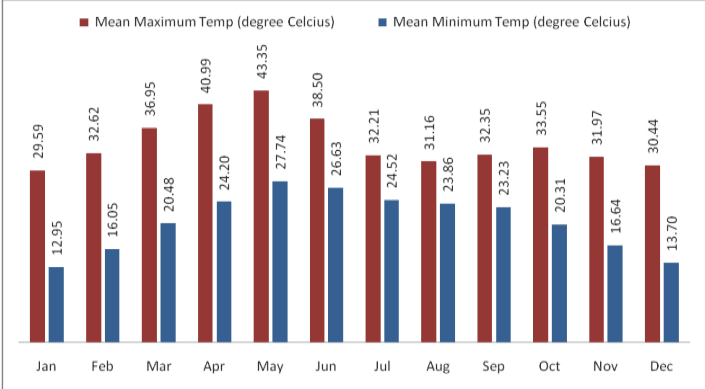
Monthly variation in temperature at Nagpur from 2001-2011 has been shown in Figure 3-6. It is clear from this table that May is the hottest month of the year with mean daily maximum temperature of about 43 Centigrade. With the onset of monsoon, temperature decreases appreciably in June but remains steady thereafter till September. During the period, the weather is generally pleasant. After monsoon, day temperature increases slightly and there is secondary maximum temperature in October. The climate becomes cool in December and continues up to February. December and January are the coldest months of the year.
3.3.2 Rainfall
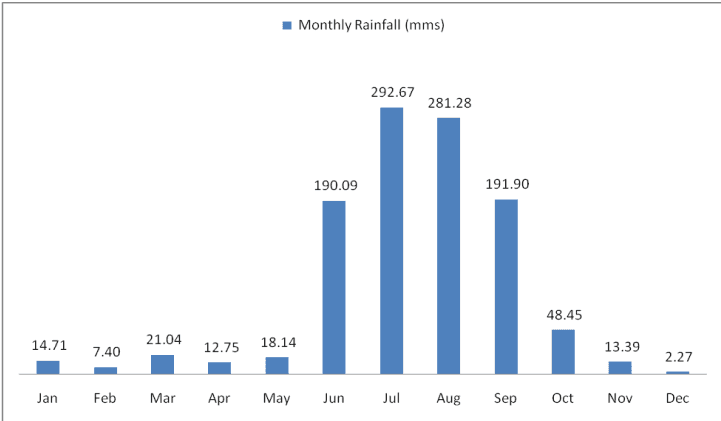
On an average the Nagpur district receives an annual rainfall of about 1,200 mm which classifies it in the moderate rainfall zone. Nagpur receives precipitation on account of both monsoons, namely southwest and northeast. The southwest monsoon occurs during June to September and northeast monsoon during October to December. Average monthly rainfall at Nagpur is shown in Figure 3-7.
As observed, July and August are the wettest months with continuous rainfall. Table 3-3 gives rainfall and number of rainy days by tehsils during monsoon. On an average there are 81.1 rainy days in a year in the NMA, of which 55.9 rainy days are in the period from June to September.
3-9
Figure 3-6 : Monthly average variation in dry bulb temperature at Nagpur
Data source: IMD data, 2001-2011
Figure 3-7: Average total monthly rainfall in the NMA (mm)
Data source: IMD data, 2001-2011
3-10
Table 3-3Total rainfall and rainy days in the tehsils of the NMA during monsoon
Tehsil
June
July
August
September
Rainfall (mm)
Rainy Days
Rainfall (mm)
Rainy Days
Rainfall (mm)
Rainy Days
Rainfall (mm)
Rainy Days
Kalmeshwar
146.9
11.5
462.3
16.5
248.0
14.8
181.7
10.3
Kamptee
136.7
17.6
311.4
17.6
274.6
17.6
181.9
11.3
Kuhi
149.1
10.4
347.8
17.7
334.5
17.3
180.9
11.5
Umred
139.8
11.1
340.4
17.2
335.1
17.4
161.7
10.3
Nagpur Rural
136.4
11.0
307.9
11.0
253.7
15.9
196.2
10.9
Saoner
168.5
11.7
282.0
17.2
196.0
14.5
177.2
9.5
Parshioni
141.7
11.0
353.4
19.6
249.2
16.7
172.9
12.3
Hingna
160.6
10.7
364.0
19.2
302.4
18.5
210.2
11.5
Mauda
169.2
10.3
277.8
16.5
229.8
15.7
155.3
9.1
Data source: IMD data, 2001-2011
3.3.3 Humidity
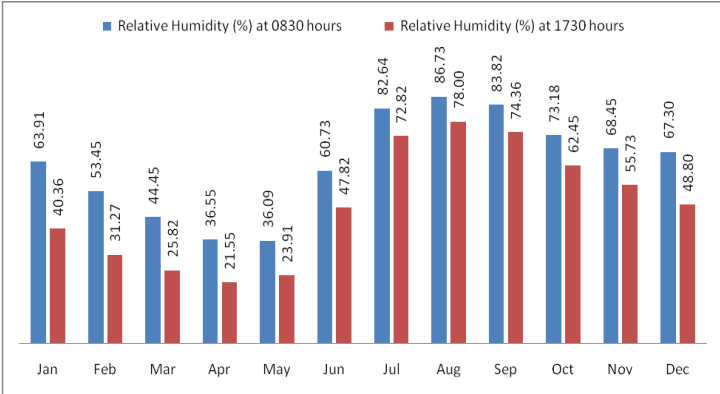
Monthly variation of humidity at Nagpur has been given in the Figure 3-8. An increase in temperature results in corresponding decrease in relative humidity and vice versa. Therefore, as observed from the figure, summer months form the driest part of the year when relative humidity is low, particularly in April and May. The climate is highly humid in monsoon, particularly in August. The average relative humidity in monsoon months goes as high as 85 percent.
Figure 3-8: Monthly average variation in relative (percent) humidity at Nagpur
Data source: Nagpur IMD observatory data
3-11
3.3.4 Cloud Cover
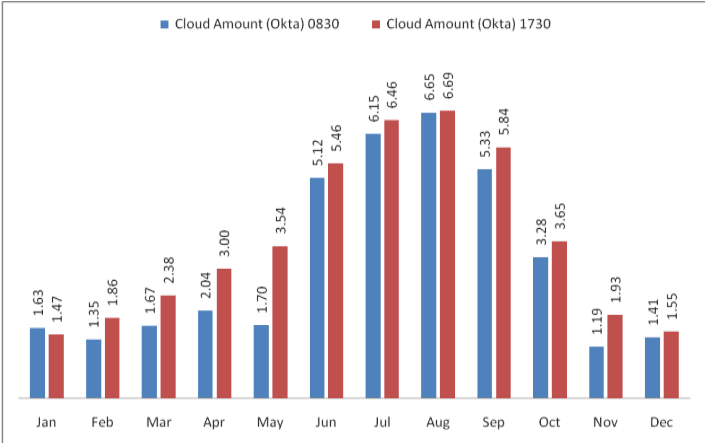
The cloud cover data for Nagpur IMD observatory is presented in Figure 3-9. As observed, the sky is heavily clouded to overcast during southwest and southeast monsoon and moderately clouded in post monsoon. During rest of the year the sky is clear or lightly clouded. Cloud cover is measured in Oktas5.
Figure 3-9: Monthly variation in cloud cover at Nagpur
Data source: IMD Metrological Station, Nagpur
3.3.5 Solar Radiation and Potential for Solar Energy Generation
India is located in the equatorial sun belt of the earth, thereby receiving abundant radiant energy from the sun. The annual global radiation in the country varies from 1,600 kWh/m2to 2,200 kWh/m2, which is comparable with radiation received in the tropical and sub-tropical regions. The equivalent energy potential is about 6,000 million GWh per year.
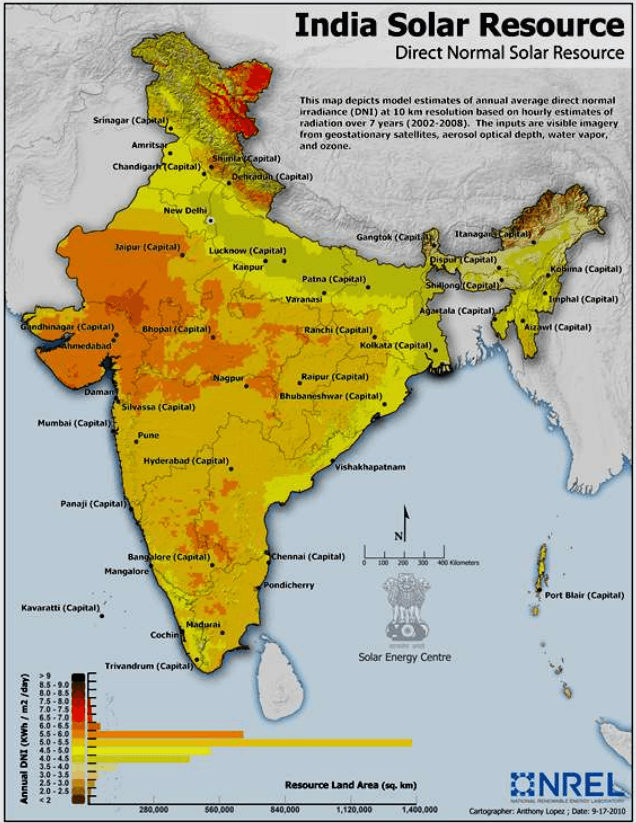
The Ministry of New and Renewable Energy (MNRE) in collaboration with the IMD has published the typical climatic data for selected radiation stations in India, including Nagpur (data from period 1986 to 2000). This is presented in Table 3-4. Also, the US National Renewable Energy Laboratory (NREL) in collaboration with MNRE has developed a map representing ‘Direct Normal Solar Irradiance in India. This is shown in Figure 3-10.
5In meteorology, an okta is a unit of measurement used to describe cloud cover. Sky conditions are estimated in terms of how many eighths of the sky are obscured by cloud, ranging from completely clear, 0 oktas, through to completely overcast, 8 oktas.
3-12
The average annual solar radiation in Nagpur is about 5.09 kWh/m2/day with more than 300 sunny days per year. Unobstructed exposure to sunlight for most or for the whole day, throughout the year is very essential in order to harness solar energy, making the NMA geographically suitable for development of solar energy resources and infrastructure. However it should be noted that parts of Gujarat, Rajasthan are more suitable than most others and the solar irradiance at Nagpur is generally within the average range observed in majority parts of India.
Table 3-4Mean annual solar radiant exposure over select IMD radiation stations in India
S No
Station
Solar Radiant Exposure (KWh/m<sup>2</sup>/day)
1.
Srinagar
4.27
2.
Kolkata
4.49
3.
Shillong
4.51
4.
Ranchi
4.55
5.
New Delhi
5.06
6.
Mumbai
5.06
7.
Nagpur
5.09
8.
Vishakhapatnam
5.13
9.
Bhopal
5.18
10.
Ahmedabad
5.36
11.
Chennai
5.37
12.
3.3.6 Wind
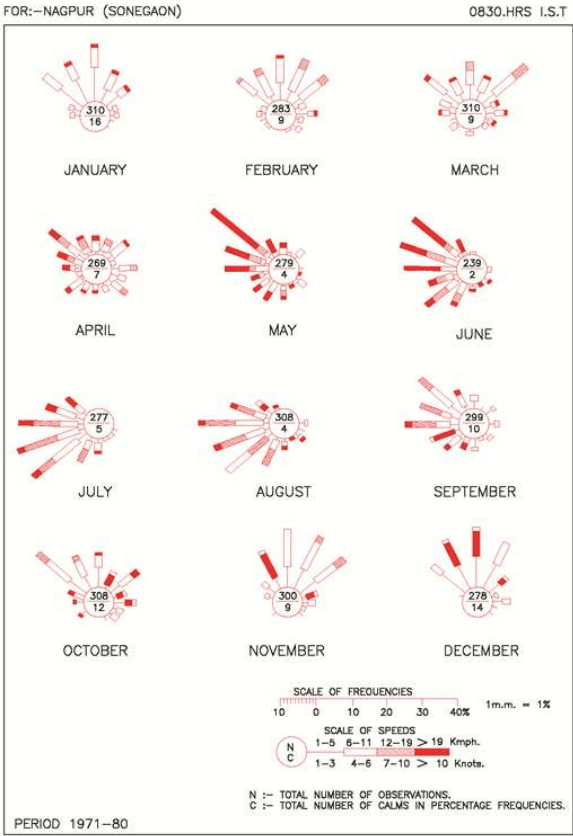
Wind velocity observed in the NMA ranges from light to moderate with some increase during the latter part of the summer and monsoon seasons. Monthly average wind speed recorded by IMD at Nagpur is presented below in the Table 3-5. The monthly wind rose diagrams showing wind persistence in various directions are shown in Figure 3-11. During this period the wind directions are mostly from southwest and northwest directions. In April, May and June winds generally blow from the northwest. During October to December, winds mainly blow from northerly and north-easterly in the forenoons and north-easterly to easterly in the afternoons. The prevailing wind direction is from north-west and north-east in the period from May to September and from west and south-west during June-July and August months. It is clear from the wind rose diagram that the dominant wind direction is North West-West to South East-East.
In the month of May and June, the climate undergoes a low pressure period resulting in the wind blowing at a speed of 20 km/h or more. But for the rest part of the year, wind speed is between 5 km/h to 6 km/h.
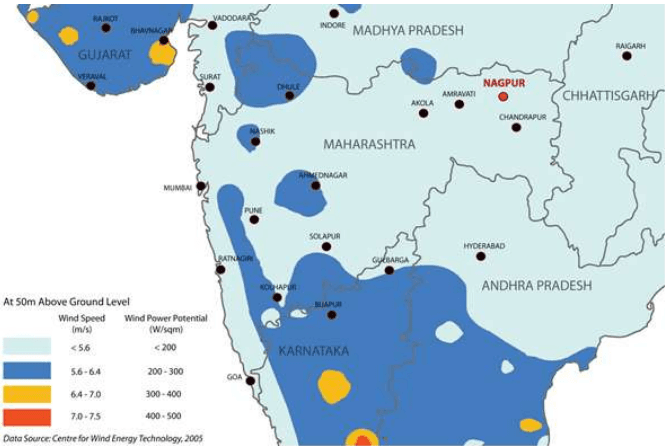
Figure 3-12 illustrates the average wind speed and wind power potential at 50 m above ground level in parts of Maharashtra. It is seen that wind power potential observed within the Nagpur region is below 200 W/m2, which does not make it a viable location for wind power generation.
Table 3-5Monthly average wind speed at Nagpur
S No
Month
Average Wind Speed (km/h)
1.
January
6.6
2.
February
7.9
3.
March
8.5
4.
April
9.6
5.
May
13.4
6.
June
14.1
7.
July
12.0
8.
August
11.1
9.
September
9.5
10.
October
7.6
11.
November
7.2
12.
December
6.4
Source: IMD metrological station, Nagpur
3-15
Figure 3-11 : Monthly wind-rose diagram
3-16
3.3.7 Air Quality
The Maharashtra Pollution Control Board (MPCB) is responsible for monitoring air quality in the region. This is being done as part of National Air Monitoring program (NAMP), through independent institutes who directly report to the Central Pollution Control Board (CPCB). The CPCB has six sanctioned NAMP stations in Nagpur. National Environmental Engineering Research Institute (NEERI) and Vishveshwarya National Institute of Technology (VNIT) are the responsible implementation agencies for air quality monitoring at 3 stations each. Table 3-6 presents the air quality of these six stations for 2006-2008.
As observed from the above air quality monitoring data, the levels of S O 2 and N O X are well below the National Ambient Air Quality Standards (NAAQS) at all the monitoring locations for 2011, 2012 and 2013. Not much difference is observed in the trends of concentration of these parameters. However, the levels of Respirable Suspended Particulate Matter (RSPM) are exceeding the prescribed limits at most of the locations with some exceptions. It may be mentioned that out of these monitoring stations only one monitoring station (MIDC office, Hingna Road) falls in NMA. Other locations are within the Nagpur city.
3-17
Table 3-6Annual average air quality in Nagpur
Location
MIDC Office, Hingna Road, Nagpur
Govt. poly technique College, Nagpur
Institution of Engineers, North Ambazari Road, Nagpur
RO Office Premises, Civil Lines, Nagpur
Type of Land Use/Year/Parameters
Industrial
Rural & other areas
Residential
Residential
2011
SO2
10
9
9
9
NOX
36
30
34
27
RSPM
106
80
86
57
2012
SO2
11
10
11
9
NOX
40
36
38
30
RSPM
132
86
96
54
2013
SO2
11
7
10
9
NOX
34
34
31
24
3.4Water Resources
3.4.1 Surface water
The NMA is drained by the Kanhan and Pench rivers in the centre, the Wardha in the west, and the Wainganga in the east. Both Wardha and Wainganga rivers later merge as Pranahitha, tributary of Godavari River. The area has a natural slope in two directions. The upper portion slopes from north to southeast and lower portion has slopes from south west to southeast. Due to the slope in dual direction and because of presence of many nallahs and rivers the total project area has excellent natural drainage pattern.
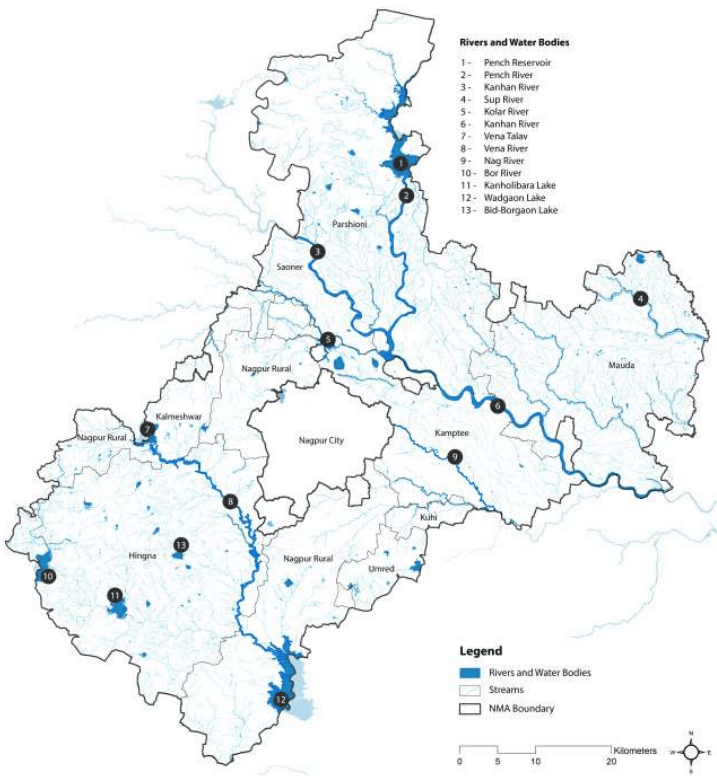
Approximately 70 percent of the NMA drains into River Wainganga through Kanhan River and its tributaries. Tributaries of Kanhan that drain from project area are Pench, Chandra Bagha, Nag, Pilli and Kanhari. Rivers Bawanthari, Surgay Mukhi drains directly into Wainganga River. Southwest portion of the NMA drains into River Wardha through Vena, Bor and Amghat. Figure 3-13 illustrates surface water resources of the NMA.
Though the topography of NMA provides an excellent natural drainage pattern, some areas are susceptible to water logging during heavy rains. Information sought through local enquiry has affirmed the same. Heavy downpour in year 2010 at regular intervals had inundated many low‐lying areas. A similar situation is reported almost every year after heavy rains. However, the NMA has not witnessed floods since 1994.
3-19
Figure 3-13: Surface water resources of the NMA
Data source: NIT, Survey of India Topographic Sheets; Map prepared by Halcrow
3-20
3.4.2 Ground Water
As the area is mostly covered by Deccan traps, unclassified gneisses, granites, sandstones and shales, the underground aquifers are mostly due to secondary porosity and fractures in the rocks. The yields range between 1 to 5 litres/sec in the NMA.
Ground water is available from both confined and unconfined aquifers. Dug wells generally tap upper shallow aquifer and whereas bore wells tap both upper shallow and deep aquifers. Previous studies indicate that the water levels in the area range from 400m below ground level (BGL) in the north to 250m BGL in the east. In general the groundwater flow direction in the entire area is towards east. Few areas around Kamptee, Saoner, Mauda and to the south of Hingna are identified as favourable for the tapping of groundwater in the area. The water table depth variation in the region during different seasons is given in Table 3-7.
Table 3-7Variation in water table across seasons
S No
Season
Water Table Depth (m)
1.
Winter
7.6-10.7
2.
Summer
13.7-18.3
3.
Monsoon
6.1-7.6
4.
Post Monsoon
6.1-7.6
Source: Rapid Environmental Impact Assessment for 2 x 61.5 MW (Phase-II Expansion) coal based captive power plant in MIHAN Area at Nagpur, MADC Nagpur Energy Pvt. Ltd; 2009
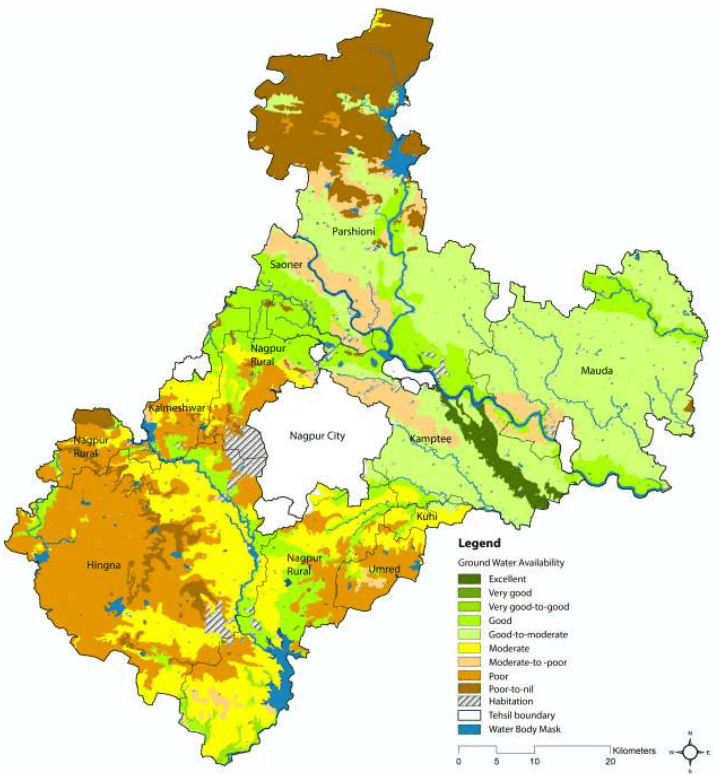
The Central Ground Water Board (CGWB) and Groundwater Survey and Development Agency (GSDA) have jointly estimated the ground water resources of Nagpur district. Ground water availability within the NMA as per the database prepared by MRSAC in different tehsils is shown in Figure 3-14. It can be seen that ground water availability in the areas bordering the western municipal city limits is poor. This area includes parts of Nagpur Rural and Hingna which have witnessed urban growth in the last few years.
As per the estimation during 2004, the total annual ground water recharge in the Nagpur District was 1102.27 million cubic meter (MCM) with the natural discharge of 60.38 MCM, thus the net annual ground water availability came out to be 1041.89 MCM. The total gross draft for all uses was estimated at 452.95 MCM with irrigation sector being the major consumer having a draft of 394.30 MCM. The allocation for domestic and industrial water requirements for the next 25 years is worked at 102.28 MCM. The net ground water availability for future irrigation is estimated at 567.62 MCM. Stage of ground water development varies from 13.57 percent (Mauda) to 98.53 percent (Katol). The overall stage of ground water development for the district is 43.47 percent.
In terms of ground water resources, all tehsils falling under NMA belongs to “Safe” category. The nature and yield potential of the aquifers occurring in different areas in the district has been assessed by the CGWB. As per the assessment, six tehsils of the NMA i.e. Hingna, Mauda, Umred, Kalmeshwar, Kuhi, and Kamptee, have medium to high yield potential and, Parshioni and Saoner tehsils have low to high yield potential. The suitable abstraction structures are dug-well and dug-cum-borewells (DCB).
3-21
Figure 3-14: Ground Water Availability in the NMA
Data source: MRSAC; Map prepared by Halcrow
3.4.3 Water quality
The surface water (SW) and ground water (GW) quality monitoring in the Maharashtra State is carried out by several agencies, namely, the Central Water Commission (SW), Central Pollution Control Board (GW), Groundwater Surveys and Development Agency (GW), Hydrology Project (SW), Maharashtra Pollution Control Board (MPCB), Central Ground Water Board (CGWB) and Directorate of Irrigation Research and Development (DIRD). The Hydrology Project monitors surface water quality through sampling points spread across the State throughout the year. DIRD monitors dug wells in the command area of major and
3-22
medium Irrigation Projects. Ground Water Surveys and Development Agency also monitors the dug wells as well as ground water levels of the State intermittently.
3.4.3.1 Surface Water Quality
MPCB is executing the GEMS (Global Environmental Monitoring System) /MINARS (Monitoring of Indian National Aquatic Resources) projects under National Water Quality Monitoring Program (NWMP) funded by CPCB to understand the nature and extent of pollution control required in the state. At present MPCB monitors 48 surface water and 25 ground water locations in Maharashtra. Monitoring at these stations is done as per the uniform protocol for water quality monitoring prescribed by MoEF and CPCB. Table 3-8 shows the surface water quality of the rivers falling in NMA.
Table 3-8Surface Water Quality for the year 2007
Sr.No.
Station Name
Monitoring Frequency
Parameters
Desired Range
Apr-07
Jul-07
Oct-07
1
Kanhan River, Agargaon, Kuhi D/s. of Nagpur
Quarterly
pH
6.5 to 8.5
7.4
7.5
8.1
BOD (mg/l)
<4mg/l
4
7
6.9
DO (mg/l)
>10mg/l
5.2
5.3
6.5
Tot. Coliform (per 100ml)
200
1,600
280
2
Kolar river before confluence with Kanhan river at Waregaon Bridge, Kamptee
Quarterly
pH
6.5 to 8.5
8.1
8.2
BOD (mg/l)
<4mg/l
7.5
9.6
DO (mg/l)
>10mg/l
4.8
5.4
Tot. Coliform (per 100ml)
240
70
Thiruvanathpuram
5.4
13.
Pune
5.41
14.
Bangalore
5.47
15.
Jodhpur
5.54
16.
Panjim
5.55
Source: MNRE solar radiation handbook (2008)
3-13
Figure 3-10: Estimates of annual average direct normal solar irradiance in India
The annual average levels of Suspended Particulate Matter (SPM), S O 2 and N O X in Nagpur city during the years 1991 to 2003 were analysed by NEERI to assess the trend variations in the three representative activity zones. Annual air quality trends (in terms of SPM, SO2 and N O X ) at the industrial, commercial and residential sites in Nagpur are presented in Annexure 4.1, along with the applicable CPCB standards and World Health Organisation (WHO) guidelines. Analysis of SPM data indicates that the SPM levels were marginally higher than the corresponding CPCB standards. SPM levels were consistent during 1998-1999, then increased in 2000 and remained quite consistent (in the range 129-145 µ g/m ³ during 2000- 2003. Annual mean S O 2 levels remained more or less consistent at all the three sites, and were always much below the corresponding CPCB and WHO standards throughout the period. Annual mean N O X levels were also much below the corresponding CPCB and WHO standards throughout the period.
Monitoring of particles of 10 micrometers or less (PM10) levels was included in CPCB stations during 2001. Annual mean levels of PM10 in Nagpur, Pune and Mumbai during 2001-2003 are presented in Annexure 4.2. In general, PM10 levels exceeded the CPCB standard of 6 0 µ g / m 3 in all the three cities during this period. A decreasing trend in PM10 concentrations was observed in Nagpur.
Concentration of all the pollutants is lowest in Nagpur as compared to other cities and is well below the prescribed CPCB standards. However, it should be noted that there are many industries outside the Nagpur
6 State of environment, Maharashtra, 2006-07
3-18
municipal limits (within NMA) including MIDC Hingna and Butibori industrial area. Industries belonging to Red, Orange and Green categories exist within the NMA. Majority of the industries belong to Orange category, which are comparatively less polluting than Red category industries (classified as heavily polluting).
3
Wainganga after confluence with Kanhan. Village-Ambhora, Taluka- Kuhi,
Quarterly
pH
6.5 to 8.5
7.3
7.7
8
BOD (mg/l)
<4mg/l
5.5
6.5
6.3
DO (mg/l)
>10mg/l
5
5.7
6.7
Tot. Coliform (per 100ml)
500
1,600
500
Source: Water Quality under GEMS MINARS Project- Monitored by MPCB
As observed from the above table, the pH of surface water ranges from 7.3 to 8.3. The limits specified for pH in IS: 2296 and IS: 10500 is 6.5-8.5. Thus, the same is on the higher side. The BOD concentration in all the rivers above is greater than 4mg/l depicting that water is contaminated with organic matter making it unfit for drinking purpose.
The concentration of DO ranges from 4.5mg/l to 6.6mg/l, which indicates presence of good biological life in the rivers. But DO level is less than desirable level of 10mg/l. Higher coliform count in rivers indicates that water is contaminated with biological waste and is not suitable for drinking without disinfection. The contamination is taking place due to direct mixing of untreated waste water of cities/town located along these rivers through local drains.
3-23
3.4.3.2 Ground Water Quality
In the district, 35 water samples were collected by CGWB during May 2007 to assess the ground water quality. Groundwater quality as monitored by CGWB for three years (2007, 2008 and 2009) by tehsils is as given in Table 3-9.
Table 3-9Ground Water Quality by Tehsil (2007, 2008 and 2009)
Tehsil
Ground Water Quality as per CGWB
Hingna, Mauda,
The water quality evaluations of the villages of these tehsils indicated that the overall
Nagpur Rural and
ground water quality was good in all these tehsils for the available data set, except
Parshioni
Hingna Industrial area. Also, it was observed from the descriptive statistics that except high nitrate levels in 23-36% samples, almost all other samples were within the desirable or permissible limit.
Kamptee
The overall water quality of Kamptee tehsils was poor for the available data set. The poor water quality could be due to the high levels of fluoride and nitrate in all the samples.
Umred
Umred village in Umred tehsil, monitored in 2008, showed that the water quality was excellent as all the parameters were within the desirable or permissible limit.
Saoner
In this tehsil, water quality varied from good to poor. The overall ground water quality was found to be poor in 2007 while good in 2008-09. The probable reasons for poor water quality could be the high levels of TH, Mg and nitrate in the range of 17 to 20% and 33-50% respectively.
Kuhi
The ground water monitoring carried out in Kuhi village of Kuhi tehsil indicated that the ground water quality was excellent in both the years i.e. 2007-08.
Kalmeshwar
Kalmeshwar and Dhapewada villages in Kalmeshwar tehsil varied between poor to unsuitable for drinking. The overall ground water quality of the tehsil was very poor in 2007, unsuitable for drinking in 2008 and poor in 2009. The high contamination levels of TDS, TH, Ca, Mg and nitrate is about 50-100% in ground water.
It can be concluded from above water quality description that Umred and Kuhi showed excellent water quality in NMA. Good water quality is observed at Nagpur Rural, Parshioni, Mauda and Hingna whereas Kamptee and Kalmeshwar had poor water quality. The high concentration of TH, Mg and nitrate along with fluoride exceedance in some part of this region, are the major issues for this district. Excessive nitrate in the water could be due to intensive agriculture, un-sewered sanitation in densely populated areas or from point sources such as irrigation of land by sewage effluents. Agricultural (use of phosphatic fertilizers) and industrial activities (clays used in ceramic industries or burning of coals) contribute to high fluoride concentrations in groundwater. During weathering and circulation of water in rocks and soils, fluorine can leach out and dissolve in groundwater and thermal gases. The fluoride content of groundwater varies greatly depending on the geological settings and types of rocks. Also high levels of Mg and total hardness in water are due to excessive application of lime and other chemicals to the soil in agricultural areas.