A comprehensive understanding of a region is often developed through the study of its economic characteristics. This chapter outlines the economic profile of the NMA and also discusses the relevant growth trends across various sectors of the economy. The growth trends for the Nagpur district have also been analysed to understand relevant trends and draw inferences from.
5.1 Economic Resource Base
The economic resource base of a region often determines the pace at which development will be driven over time. The resources available within a region also help determine the nature of economic activities that are existent as well as can be focused upon in the future for incremental development. The resource base also needs to be looked upon from a larger perspective since it allows development opportunities that may not necessarily be ascribed to the locations or regions. Nagpur district as a whole has a rich material resource base which pans across agricultural, mineral, forest, animal husbandry and fisheries. These have been discussed below.
5.2District Domestic Product
At current prices, the gross district domestic product5(GDDP) of Nagpur for 2008-2009 is estimated to be Rs. 33,020 crore while the net district domestic product (NDDP) is estimated to be Rs. 28,424 crore.
At constant prices, the GDDP of Nagpur for 2008-2009 is estimated to be Rs. 20,595 crore. The state domestic product (SDP) of Maharashtra is estimated to be Rs. 442,320 crore.
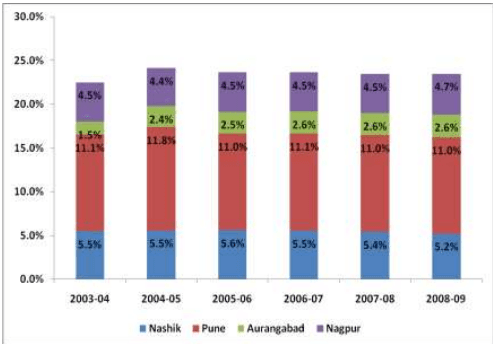
In 2008-2009 at constant prices, Nagpur district’s contribution to SDP was rougly 4.7 percent. This is lower in comparison with the contribution of Nashik and Pune, where Pune contributes a little over twice than Nagpur to the SDP.
Figure 5-5 : Comparison of districts’ contribution to SDP
Source: District statistical abstract for respective years and CRIS analysis
5.2.1 GDDP Distribution
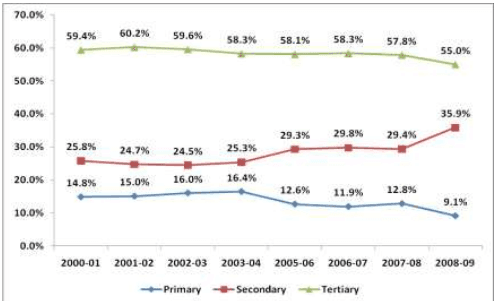
The sectoral distribution of the GDDP can amplify the course that the economy has taken over time. In case of Nagpur, the sectoral contribution to GDDP is dominated by the tertiary sector. The tertiary sector has bagged a lion share of the contribution over the past decade or so with the contribution ranging between 55 percent and 60 percent.
5 Gross District Domestic Product (GDDP) represents the sum of economic value of all goods and services produced within the geographical boundary of the district after deducting the necessary inputs consumed in the process of production and Financial Intermediation Services Indirectly Measured (FISIM). From this gross District Domestic Product, Consumption of Fixed Capital (CFC) is deducted to arrive at the Net District Domestic Product (NDDP) which is normally termed as District Income. The District income is divided by the mid-year estimated population of the district that is in question to get Per Capita Income of that district.
5-10
Figure 5-6 : Sectoral distribution of GDDP
Source: District socio-economic profile for respective years, CRIS analysis
It is evident that the secondary sector (manufacturing and construction activities) has also started gaining importance with a sizable growth in the last couple of year. This suggests that there is possibly a case of large investments in manufacturing as well as construction activities.
Share of agriculture has significantly reduced in the district. It demonstrated a sharp decline between 2007-2008 and 2008-2009.
A detailed analysis of the GDDP of Nagpur for the past 10 years or so indicates some interesting trends. The analysis carried out points that the growth in the GDDP has largely been driven by the Secondary Sector comprising of Manufacturing and Construction. The Compounded Annual Growth Rate (CAGR) of the sector works to be 19 percent between 2001 and 2009.
The tertiary sector has been growing at a CAGR of 13 percent between 2001 and 2009 while the primary sector has grown at a CAGR of 8 percent for the same period. This clearly indicates that the economy is being driven by the secondary sector.
Table 5-11Detailed GDDP analysis for Nagpur
Sectors
Contribution (in Rs. Lakhs)
CAGR
2001
2002
2003
2004
2005
2006
2007
2008
2009
Primary Sector
Agriculture including livestock
1066
1154
1777
1493
1507
1643
1749
2318
1836
7%
Forestry & logging
62
66
71
62
67
98
167
124
150
12%
Fishing
22
21
649
23
37
40
42
53
54
12%
Mining &
499
565
2527
578
653
760
793
953
969
9%
5-11
Sectors
Contribution (in Rs. Lakhs)
CAGR
2001
2002
2003
2004
2005
2006
2007
2008
2009
Quarrying Sub-Total - Primary Sector
1649
1805
5025
2156
2264
2540
2750
3448
3008
8%
Secondary Sector
Manufacturing (Rg)
1183
1043
1255
1478
1758
2866
3516
4028
4791
19%
Manufacturing (UnRg)
537
548
603
689
789
885
1044
1186
1270
11%
Construction
939
1078
11108
1369
1504
1757
1884
2150
4897
23%
Electricity, gas and water supply
213
301
334
363
355
398
439
542
898
20%
Sub-Total - Secondary Sector
2873
2969
13301
3900
4406
5906
6883
7907
11856
19%
Tertiary Sector
Railways
190
194
206
245
275
296
346
379
417
10%
Transport & Storage
499
534
580
643
764
868
1021
1193
1356
13%
Communication
410
449
373
426
480
556
622
739
1123
13%
Trade, Hotel and Restaurants
1402
1468
1754
2008
2406
2969
3462
4008
5021
17%
Banking and Insurance
1301
1566
1790
2062
2239
2499
2899
3255
3660
Source: District statistical abstract of various years and CRIS analysis
Within the secondary sector, growth has been commanded by ‘construction’ and allied activities (electricity, gas, water) activity which has displayed a CAGR of 23 percent (20 percent for electricity, gas and water). Organized manufacturing has also contributed significantly over the years displaying a CAGR of 19 percent.
Table 5-12Annual growth of GDDP and its constituents
Sectors
Annual Growth Rates
2004-2005
2005-2006
2006-2007
2007-2008
2008-2009
Primary Sector
Agricultureincluding livestock
1%
9%
6%
33%
-21%
5-12
Sectors
Annual Growth Rates
2004-2005
2005-2006
2006-2007
2007-2008
2008-2009
Forestry & logging
8%
46%
70%
-26%
21%
Fishing
61%
7%
6%
25%
2%
Mining & Quarrying
13%
16%
4%
20%
2%
Primary Sector Growth
5%
12%
8%
25%
-13%
Secondary Sector
Manufacturing (Registered)
19%
63%
23%
15%
19%
Manufacturing (Unregistered)
15%
12%
18%
14%
7%
Construction
10%
17%
7%
14%
128%
Electricity, gas and water supply
-2%
12%
10%
24%
66%
Secondary Sector Growth
13%
34%
17%
15%
50%
Tertiary Sector
Railways
12%
8%
17%
10%
10%
Transport & Storage
19%
14%
18%
17%
14%
Communication
13%
16%
12%
19%
52%
Trade, Hotel and Restaurants
20%
23%
17%
16%
25%
Banking and Insurance
9%
12%
16%
12%
12%
Professional Services
16%
14%
17%
17%
12%
Public Administration
20%
5%
10%
27%
10%
Other Services
8%
10%
14%
10%
6%
Tertiary Sector Growth
14%
14%
15%
16%
17%
Year on Year GDDP Growth
13%
19%
15%
17%
23%
Source: District statistical abstract of various years and CRIS analysis
If we analyze the annual growth rates of various economic activities that constitute the GDDP, it is observed that the bulk of the growth in the past 5 years or so has been driven by both the secondary and tertiary sectors.
Construction and electricity, water and gas activities demonstrated a very buoyant growth between 2008 and 2009 with a growth rate of 128 percent and 66 percent respectively. The secondary sector grew at a rate of 50 percent during the same period on the back of these strong performances. The tertiary sector grew at a rate of 23 percent during the same period.
Thus, it is apparent that the growth in Nagpur is more Nagpur city centric since a bulk of the construction activities as well as industrial activities is happening in and around the Nagpur city. Nagpur city houses
5-13
50 percent of the district’s population and hence obviously acts as the growth driver for the larger NMA region as well as the district.
5.2.2 NMA Contribution to GDDP
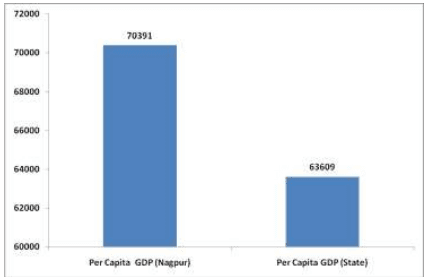
The per capita GDP for Nagpur district was estimated to be Rs. 70,391/- which is higher than that of the state which is estimated to be Rs. 63,609/-.
Figure 5-7 : Per-capita GDP for Nagpur and Maharashtra
Source: District statistical abstract, 2010 and CRIS analysis
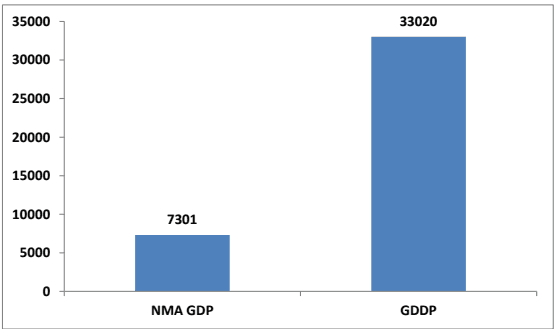
The domestic product data is not available below the district level. In the absence of such disaggregate data; the per-capita GDP can be a reasonable measure to gauge the domestic product of a particular area. Using the per capita GDP as a base, the NMA’s GDP works out to be Rs. 7,301 crore. NMA’s contribution to district GDP is mere 22 percent.
Figure 5-8 : NMA share in district product
Source: District statistical abstract, 2010 and CRIS analysis
5-14
5.3Workforce Participation in NMA
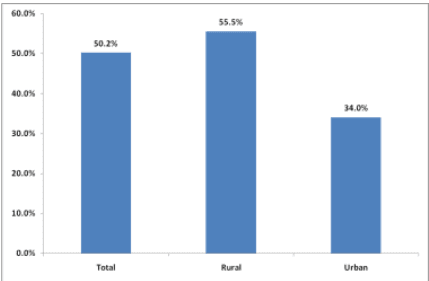
The workforce participation rate (WPR) for the NMA is observed to be 50.2 percent with 365,518 workers which is higher than that of the district (37.8 percent). The rural WPR is observed to be 55.5 percent with a workforce of 304,487 indicating that a large amount of population contributes to economic activity as compared to the urban areas where the WPR is 34 percent with a workforce of 61,031. The male WPR for NMA is observed to be 54.1 percent with male workforce of 240,388 while the female WPR is observed to be 30.9 percent with a female workforce of 125,180. Interestingly, the female WPR for urban areas in NMA is only 8.2 percent while that for the rural areas is 38.1 percent.