This chapter discusses the existing utilities infrastructure provisions such as water supply, power, sewerage, drainage, telecom and gas in the NMA. The collated data is based on the available information from published reports, studies and interactions with various government agencies supported by observations during site visits. As discussed earlier in this report, the major urban areas such as the NMC, Kamptee and Kalmeshwar Municipal Councils and MIDC areas are outside the NMA extents. The areas within NMA are either developing rural areas or growing urban areas on the fringes of NMC and Municipal councils, which currently are not being serviced with utilities.
Much of the available information pertaining to utilities infrastructure is limited to the NMC and municipal council limits. The Nagpur District Regional Plan 1991-2011 broadly addresses the issue of infrastructure development in the new urban areas and rural areas within the metropolitan area.
This chapter covers a summary of key findings for various utility components in the NMC and municipal councils, supported by available information pertaining to growing urban and rural areas. Although the corporation and council areas are outside NMA boundaries, study of infrastructure provisions for these urban areas helps provide some background to that in the NMA.
8.1Water Supply
Water supply within the NMA and the larger region is sourced from surface and ground water sources. Based on the type and source of supply, the region can be categorised into three main categories:
urban areas including municipal corporation and municipal councils/ nagar parishads outside the NMA;
rural village settlements and census towns;
agricultural land
Water supply for urban areas is sourced from surface water sources like lakes, rivers and reservoirs to cater to the domestic, commercial, institutional, and industrial demands of city as well as ground water.
In the rural areas, water is being supplied through the rural water supply schemes implemented by agencies like the Zilla Parishad (ZP), the Maharashtra Jeevan Pradhikaran (MJP) or the Groundwater Survey and Development Agency (GSDA) that tap ground water by developing tube wells, hand pumps and bore wells. Surface water for domestic consumption is sourced from local water bodies or canals whereas irrigation of the agricultural land is being done through a combination of ground and surface water sources such as canals, tube wells and bore wells.
Water supply to the urban areas is dependent upon both surface and ground depending upon its availability. Details of major water sources available for the development of NMA are addressed below.
8.1.1Ground Water Sources
Ground water is the main source of NMA area and is being developed by two types of abstraction structures; bore wells and dug wells. Dug wells are the main ground water abstraction structures with yield
8-1
varying from 20 to 380 m3/day. Minor irrigation census data (2000-2001) indicates that area irrigated by ground water is 914.68 km2 whereas surface water accounts for 241.74 km2 of area. It shows that the ground water is main source of irrigation in the NMA accounting about 73 percent of net irrigated area. The district has a total number of 59,407 irrigation dug wells, creating an irrigation potential of 1,413.71 km2 out of which 1,236.25 km2 of irrigation potential is utilised (Source - Nagpur Regional Plan 1991-2011).
The Government of Maharasthra (GoM) has developed a large number of bore wells fitted with hand pumps and electric motors for rural drinking water supply purposes in the district. Upto the year 2006-2007, the GSDA and the GoM have developed about 9,953 bore wells for rural water supply, out of which 9,483 are fitted with hand pumps and 470 with electric pumps (Source – MJP).
The NMA lies in the Godavari river basin contributing to the catchments of Waingangā River through the Kanhan River passing from the centre of the district. The Central Ground Water Board (CGWB) has conducted several studies in the district to understand the characteristics of ground water reserves in the region and assess the development potential of Nagpur. Salient features of ground water availability within the tehsils of the NMA are summarised in Table 8-1.
Table 8-1Salient features of ground water availability
Tehsil
EW
Wells OW
PZ
Depth (mbgl)
SWL* (mbgl)
Discharge (lps)
Draw-Down (m)
Zones (mbgl)
Parshioni
17
4
2
27.5-199.64
4.05-19.6
0.08-7.76
-
6.0-163.05
Hingana
2
3
-
85.4-234.8
14.68-27.65
0.5-21.33
-
-
Nagpur (Rural)
2
-
1
76.59-159.45
24.15
1.37-2.64
-
7.0-75.0
Mauda
2
1
-
174.5-187.25
1.0
1.37-4.43
25.06-42.58
34.75-147.65
Kamptee
6
3
-
29.93-202.45
4.53-16.45
1.37-8.85
-
11.0-140.4
Saoner
8
17
1
43.0-307
2.30-29.05
0.38-14.40
8.05-31.06
5.25-140.2
Kalmeshwar
9
4
79.3-278
4.55-28.5
0.38-17.92
5.6-11.95
28.0-107
Umred
2
2
67.5-200
3.64-5.07
0.01-2.16
24.0-122
Kuhi
4
3
36.5-200
-
-
-
5.0-99.75
Total
52
35
6
27.5-307
1.0-29.05
0.01-21.33
5.6-42.58
5.0-163.05
Source: Ground Water Information Nagpur District Maharashtra, Central Region Nagpur 2009
EW -Exploratory wells, OW - Observation wells, PZ – Piezometers, mbgl – metre below ground level;* SWL: Shallow Water Level
The depths of wells vary from 6.5 to 307 metres below ground level (mbgl) across Nagpur district and ranges from 27.5-307 mbgl within the tehsils of the NMA. Quantity of discharge varies between 0.01 and 38.5 litres per second (lps) across Nagpur district and 0.01 and 21.33 lps within the NMA. The deepest water level has been recorded at Pipla village in Saoner Tehsil that is 29.05 mbgl and the deeper aquifer zones have been encountered in many wells beyond 50 m depth, the deepest being at 287.73-296.57 m at Sillewada exploratory well in Saoner Tehsil.
Dynamic ground water potential in Nagpur District:
o Net annual ground water availability: 1041.89 million cubic metres (mcm)
o Annual ground water draft (irrigation - domestic): 452.95 mcm
8-2
8-3
o Allocation for domestic and industrial requirement up to next 25 years: 102.28 mcm
o Stage of ground water development: 43.47%
Source: Ground Water Information Nagpur District Maharashtra, Central Region Nagpur 2009
Ground water control and regulation assessment in Nagpur District:
o Over-exploited tehsils None
o Critical tehsils None
o Semi-critical tehsils Katol and Narkhed
o Notified tehsil None
Source: Ground Water Information Nagpur District Maharashtra, Central Region Nagpur 2009
Ground Water Quality
The available data also reveals that the water quality in many of the villages in NMA is affected by the presence in excessive quantity of nitrate (NO3), chloride (Cl), fluoride (F), iron (Fe) and total dissolved solids (TDS). Use of the water in a particular area can be decided after getting the water quality tested. Ground water quality in parts of Nagpur city is adversely affected by nitrate contamination, whereas in Kalmeshwar and Hingna MIDC areas the contamination of ground water in the phreatic zone has been observed due to discharge of industrial effluents (Ground Water Information Nagpur District Maharashtra, Central Region Nagpur 2009).
Prevailing Ground Water level in NMA
The CGWB periodically monitors the National Hydrograph Network Stations (NHNS) across the Nagpur district four times a year that is January, May (pre-monsoon), August and November (post-monsoon) to assess the dynamics of water levels in the district. Water level depths in the area in different seasons of the year have been described under the following subheads:
o Pre-monsoon (May-2007)
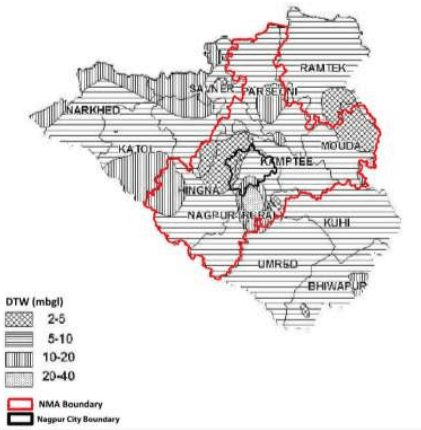
The depth to water levels in the district in May 2007 ranged between 2.00 mbgl (noted at VRCE, Nagpur) to 39.70 mbgl (noted at Panchgaon- PZ). Pre-monsoon water level depths across the district and within the NMA have been depicted in Figure 8-1. The studies show the shallow water levels within 10 mbgl in almost entire district and the shallowest water levels are observed near Nagpur city and area near Mauda. Water levels in the range of 10-20 mbgl are observed in the western and north western part of district in parts of Narkhed, Saoner and Katol Tehsil and isolated patches in Parshioni, Bhiwapur and Nagpur Rural Tehsil.
Figure 8-1 : Depth of ground water level (May 2007)
Source: Ground Water Information Nagpur District Maharashtra, Central Region Nagpur 2009
o Post-monsoon (Nov, 2007)
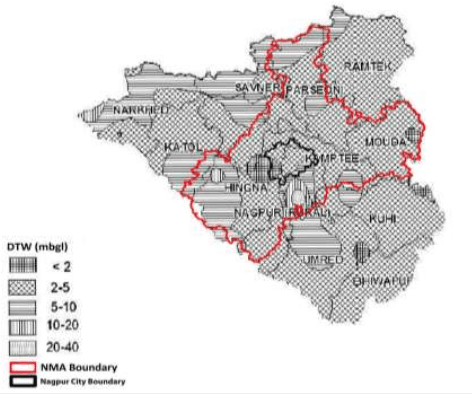
The depth to water levels in the district in November 2007 has been observed between 0.65 mbgl (noted at Waddhamna) and 28.65 mbgl (noted at Panchgaon-PZ). The spatial variation in post-monsoon depth to water levels is shown in Figure 8-2. In the entire district the water levels are shallow within 10 mbgl. The water levels of 2 to 5 mbgl is the most dominant range occupying major parts of Ramtek, Mauda, Kuhi and Bhiwapur Tehsils. Water levels of less than 2 mbgl are observed in isolated patches near Nagpur City and in parts of Mauda Tehsil. The northern peripheral part of the district from Narkhed to Ramtek Tehsil and two big patches in the middle portion covering parts of Katol, Hingana, Umred and Nagpur Rural Tehsils have deeper water level of more than 5 mbgl.
8-4
Figure 8-2 : Depth of water level (Nov 2007)
Source: Ground Water Information Nagpur District Maharashtra, Central Region Nagpur 2009
o Seasonal Water Level Fluctuation – (May to Nov 2007)
Rise in water levels has been observed in the entire Nagpur district and in major part of the district it has raised from 0.25 m (recorded at VRCE, Nagpur) to 11.05 m (recorded at Panchgaon - PZ). The rise in water level is mostly within 7.5 m. Major parts of the district covering entire Ramtek, Parshioni, Mauda, Umred, Hingna and Nagpur (Rural) show higher fluctuation of 4 m to 7.5 m. The western part comprising of Katol, Narkhed, Saoner and Kalmeshwar tehsil and Bhiwapur tehsil in the east have lower fluctuation of less than 4 m.
Ground Water Reserves in the NMA
The CGWB and GSDA have jointly estimated the ground water reserves of Nagpur district. Ground water reserves by tehsils and its use for different purposes have been presented in Table 8-2. The total annual ground water recharge in the district is about 1,102.27 mcm with the natural discharge of 60.38 mcm making 1,041.89 mcm water available for the annual extraction and for different purposes.
8-5
Table 8-2Ground water resources in the NMA by tehsil
Tehsil
Area Type
Net annual ground water availability (ha.m/yr.)
Annual Ground Water Draft (ha.m/yr.)*
Allocation for domestic and industrial requirement for next 25 years (ha.m/yr.)
Groundwater availability for future irrigation (ha.m/yr.)
Stage of Ground water development (%)
Category
Irrigation
Domestic and Industrial Uses
Total
Parshioni
Command
6822.35
638.09
218.53
856.62
437.06
5747.20
12.56
Safe
Non-command
1362.09
340.97
73.50
414.47
146.99
874.13
30.43
Total
8184.45
979.06
292.03
1271.09
584.05
6621.33
15.53
Hingna
Command
696.32
211.15
34.23
245.38
68.45
416.71
35.24
Safe
Non-command
7525.66
1857.59
401.93
2259.51
763.48
4904.59
30.02
Total
8221.98
2068.74
436.15
2504.89
831.93
5321.30
30.47
Nagpur (Rural)
Command
198.71
32.39
9.97
42.36
19.94
146.37
21.32
Safe
Non-command
6638.73
2427.29
369.17
2796.46
738.34
3473.09
42.12
Total
6837.44
2459.68
379.14
2838.83
758.28
8.1.2Surface Water Sources
The total surface water runoff from the geographical area of Nagpur district is estimated to be about 4039 mcm, out of which about 984 mcm can be utilised for irrigation as well as other purposes. The catchments have only two perennial rivers that is Kanhan and Pench which confluence near village Bina. After this confluence, the Pench River merges into the Kanhan River, which is a tributary of the River Wainganga. There are some seasonal rivers like Kolar and Nag which are tributaries of the Kanhan River and contribute to Kanhan during monsoon. Vena is another main seasonal river which is tributary of the Wardha River. These rivers have been intercepted by constructing dams and runoff water from the catchments is stored and is used for irrigation as well as domestic and other purposes.
Nave Gaon Kheri and Totla dam projects are the two major projects in the region on the Pench River. The Right Bank canal of Pench project on Pench River which originates from Totla dam is the main source of water supply for the NMC and NMA.
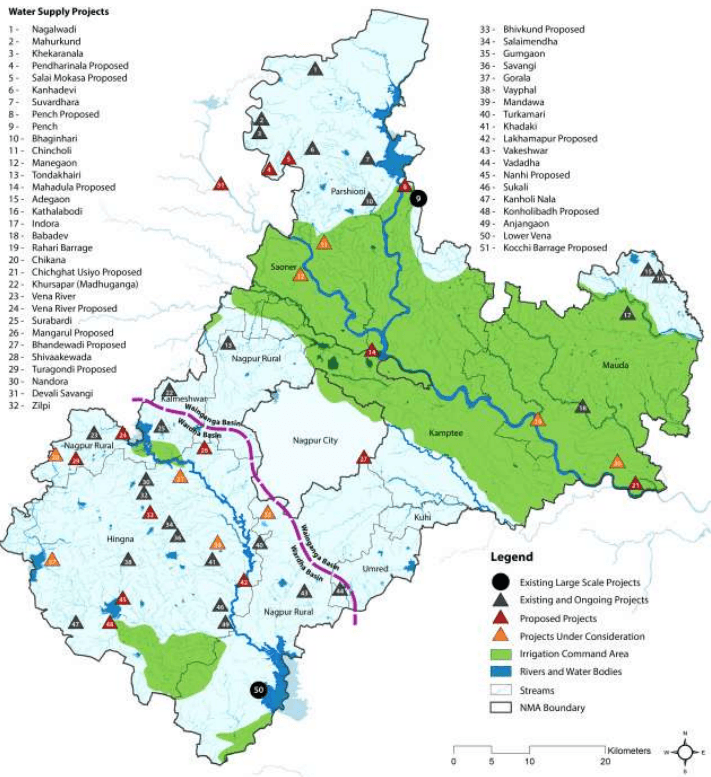
Kochi Barrage and Rehari barrage are two major projects in the region that are proposed on Kanhan River as shown in the Figure 8-3. The Rehari barrage is located near village Rehari at downstream of confluence point of Pench and Kanhan rivers. This was being considered as a potential source for Nagpur City, however the project was not undertaken by the NMC subsequently.
There are some smaller projects constructed on the seasonal rivers to store the run off to be used for irrigation purposes and for smaller developments. The Lower Vena project has been constructed on Vena River located near village Bela and Butibori. It has been designed to provide water for irrigation as well as drinking purposes in its command area. Existing and proposed potential surface water sources and tentative allocations of water from them are described in Table 8-3 and Table 8-4.
8-8
Table 8-3Potential surface water sources (existing) for the NMA
S No
Name of Scheme
Available Water (Total Live Storage)
Allocation of water for
Remarks
Drinking/Non Irrigation Uses
Industrial Uses
Irrigation Uses
mcm
mcm
mcm
mcm
1
Pench Project (Nave Gaon Kheri dam and Totla dam, constructed on Pench River) Full Water Levels (FWL): • Totla Dam – 490 m • Navegaon Kheri dam – 325 m Minimum Water Levels (MWL): • Totla Dam – 464 m • Navegaon Kheri dam – 31 4m
1,328.00
168.00
76.00
961.00
Water allocated for NMC from RBC at Mahadula: I. 112 mcm permanent allocation II. 78 mcm after paying to irrigation department about Rs. 100 crore Total allocation from Pench project is 190 mcm against 168 mcm planned non-irrigation water. Further, there would be no surplus water in pench project for future allocation to NMC/NIT. The “Pench Diversion” is another project proposed by the Government of Madhya Pradesh to tap pench river at upstream in the state of Madhya Pradesh to fulfil irrigation and non-irrigation demands of the state from this river in that region. Once the project is implemented, the surplus availability of water in Pench Project would be greatly reduced and only the allocated water from the Pench project would be available for allocated uses.
2
Lower Vena River Project: This project is constructed across the river Vena, a tributary of Wardha river located near
189.18
90.02
-
53.79
Total non-irrigation water allocation from the reservoir is 90.02 mcm and has been budgeted as follows: • Drinking water demand of Hinganghat and Sindhi towns of district Wardh – 7.27 mcm
8-9
S No
Name of Scheme
Available Water(Total Live Storage)
Allocation of water for
Remarks
Drinking/Non Irrigation Uses
Industrial Uses
Irrigation Uses
mcm
mcm
mcm
mcm
village Bella right near Buti Bori and river Nand.FWL:Badgaon – 255 mNand – 247 mMWL:Badgaon – 245.80 mNand – 241 m
MIDC Butibori area (MIDC)- 19.18 mcmDRDO - 0.18 mcmKesalapar – 0.015 mcmBarkhedi Railway – 0.54Ruch Soya Industries, Butibori – 0.21 mcmPurti power sugar factory – 1.31 mcmMIHAN - 26. 16 mcmIdeal Energy Power Centre-1 – 7.80 mcmVidarbha Industries – 12.35 mcmIdeal Energy Power Centre-2 – 10.00 mcmAparna Infra Energy – 5.00 mcmTotal budgeted water is 90.02 mcm. There is no additional water available for NMC/NIT.Source:Office of the superintending Engineer and secretary (Maharashtra-Madhya Pradesh interstate control board for Joint Hydel and Irrigation Projects) and the irrigation department
3
Kanholi Project:This project has been developed on the river Krishna.FWL: 314.24mMWL: 301.600m
22.213
-
-
20.485
No allocation for drinking and other non-irrigation uses.
8-10
S No
Name of Scheme
Available Water (Total Live Storage)
Allocation of water for
Remarks
Drinking/Non Irrigation Uses
Industrial Uses
Irrigation Uses
mcm
mcm
mcm
mcm
4
Upper Vena River project: This project is constructed on upstream of Vena river in Hingana TahsilFWL: 337.415mMWL: 330.405m
21.64
11.55
7.59
2.50
Out of 11.55 mcm, 9.9 mcm is allocated for MJP for rural and suburb water supply. There is no surplus water for future allocation. Also, many times the reservoir does not fill completely to provide the designed allocation of water.
5
Wakeshwar DamFWL: 275.69 mMWL: 271.29 m
2.07
2.07
-
-
0.2 mcm allocated for Sahara city and demand is 0.5 mcm. The balance water can be used for NMA
6
Kanhan intake works (at Kamptee)
Pumping
65.71 mcm (180 mld) allocated for NMC area and 4.38 mcm (12 mld) allocated for Kamptee municipal council.
7
Vishvasariya Barrage
100.00 (assumed)
100.00 (assumed)
-
-
The barrage has been abandoned, however if the river changes its course, the project can be revived as it has good water potential and can be considered as an important and sustainable source of water for future development
Source: Book of Progress and Current Status of Irrigation Projects in Nagpur District: Jal Sampada Department
8-11
This page is intentionally left blank.
8-12
Table 8-4Potential surface water sources (proposed) for the NMA
S No
Name of Scheme
Available Water
Allocation of Water for
Remarks
Drinking uses
Industrial uses
Irrigation uses
mcm
mcm
mcm
mcm
1
Kochi BarrageThe project has been proposed at Kanhan River near Kochi village in M.P.Maximum Water Level(MWL)318.00 mMaximum Draw Down Level (MDDL) - 311.00 m
75.07
5.39 (for rural water supply)
15.0 to MACB
48.48
The project has been approved and is under construction. There is no further scope to increase the size of the project and storage of water for further allocation.
2
Rehari BarrageA proposed scheme near Rahari village on Kanhan river in tehsil Mauda.The catchment area of the project is 11,753 km² Gross annual yield is 90% dependable - 3,172.41 mcmNet annual yield 90% dependable - 564.32 mcmGross storage at the barrage site - 65.86 mcmLive storage at the barrage site - 65.69 mcmMWL - 271mFull Resevoir level (FRL) - 270mReservoir bed level (RBL) - 251.1mCrest Level - 256m
128
128
-
-
175mld water is proposed for the NMC area as per 2011 demand and about 350mld water for the future demand in 2031. This scheme has been approved for implementation and was abandoned due to the shortage of funds.The project has a very good potential for tapping the flood water from the upstream catchments as well as perennial water flowing through the river and use it to cater to the water demands of the NMC and NMA areasThis project can be seen as a long term sustainable source for the region. The project, however, seems to be high in operational cost as the barrage is quite downstream of the region and the NMC.The operational cost of the scheme can be brought down by having an interdepartmental understanding with the irrigation department and the NMC/NIT. NMC/NIT may provide water from the barrage to irrigation department for irrigation purpose to the Downstream command area and in return receive water from irrigation department from the right bank canal from Pench project at higher elevation and transport it to the desired location of treatment by gravity.
3
Lakhma pur Irrigation project on local nallah
6.783
0.5
2.7
3.583
0.5 mcm water for Butibori water supply and 2.7 mcm water for MIDC area
4
Bhiv Kund SchemeConstructed on Local nallahFWL: 113.80 mMWL: 101.25 m
2.853
-
8-13
S No
Name of Scheme
Available Water
Allocation of Water for
Remarks
Drinking uses
Industrial uses
Irrigation uses
mcm
mcm
mcm
mcm
Preliminary study and survey work is in progress.
8
Savangi Project:FWL - 319.25mMWL - 311.50m
4.976
1.171
-
Water is yet to be allocated.
9
Nirgandi project to tap surplus water from Lower Vena during monsoon.Total proposed storage- 13.16 mcmTotal proposed utilisation-23.15 mcm
-
-
-
-
For irrigation use and rural water supply.
10
Vena Feeder: Mordham Nala is to be diverted to feed Upper Vena reservoir to contribute about 6 mcm water.
-
-
-
-
Currently the Vena reservoir is not filling up to its full capacity if rain fall in the region is less. Allocated water from the Vena project is not available to fulfil the desired demand in its command area.
11
Jamghat Project:The project has been proposed on Kanhan River in MP at Jamghat. The project has been formulated and the master plan has been prepared.Total water availability at the Jamghat HEP project would be 14.25 TMC (Thousand Million Cubic Metre) out of which:- 4.25 TMC (150 mcm) will be utilised by MP from Saledhana Reservoir/barrage; and- 10.00 TMC (353 mcm) will be provided to Maharashtra through canal.
This 353 mcm (970 mld) water would be available at high altitude and could be transported to Upper Vena reservoir by gravity for further storage and utilisation at the downstream. This project if commissioned may prove as a boon for the NMA and could fulfil more than half of the entire NMA demand including the NMC area.
Source: Book of Progress and Current Status of Irrigation Projects in Nagpur District: Jal Sampada Department
8-14
Figure 8-3 : Location of potential existing and proposed schemes for surface water sources
Data Source: Book of Progress and current status of Irrigation projects in Nagpur District: Jal Sampada Department; Map prepared by Halcrow.
8.1.3Short and Medium Term Availability of Fresh Water in NMA
Based on the observations on the dynamics of surface water in the region and its utilisation by different water projects (as shown in the Table 8-3 and Table 8-4), the medium term sources mentioned below can
8-15
be considered. These sources can fulfil the water requirement in the region during the development stages in addition to the existing uses and allocation from other sources.
Upper Vena River project: Upper Vena project can provide about 6.00 mcm water to the region can by diverting Mordham nala to feed upper Vena reservoir.
Lower Vena River project: Lower Vena lies close to the NMA boundary and can be considered as a potential fresh water source for medium term development of the region. Though the total water available at the Vena reservoir has been already allocated for different uses as mentioned in the Table 8-3 there may be some scope of a supplement/swapping arrangement. The wastewater to be produced near the command area of the project can be treated up to the desired standards and used for irrigation purposes in the command area and an equivalent amount of fresh water from the reservoir can be used for the domestic purposes in the surrounding areas of NMA.
Nirgandi project: This project has been proposed to tap surplus water from Lower Vena during monsoon. It can be developed for potable water supply as well as irrigation purposes. The availability of water is still to be ascertained.
Akoli Barrage: The project has been planned to tap water from Nag River which is basically untreated sewage from the Nagpur city during the lean period. About 50 mcm (140 mld) of water can be made available for the region for irrigation as well as domestic purposes by treating the water up to the desired standards. The river carries untreated sewage from the town and disposes it to Kanhan River at the upstream of the Kampti intake works. The water is polluted in the river and it becomes necessary to treat the sewage before its disposal in to the river.
8.1.4Long Term Availability of Fresh Water in NMA
As per the information shown in Table 8-3 and Table 8-4, following sources can be considered as long term and reliable water sources for the NMA:
Pench Project (Nave Gaon Kheri dam and Totla dam): This project is the backbone for the area and will continue to provide the allocated water for irrigation domestic and industrial purposes.
Vishvasariya Barrage: This is an existing barrage on the Kanhan River. The river has changed its course and the barrage is not functional. If the project gets revived due to the course of river it can produce about 100 mcm (275 mld) water for the region.
Rehari Barrage: This project has been proposed on the Kankan River near Rahari at the downstream of the proposed NMA. This project will provide about 128 mcm (350 mld) water to the region if commissioned. Operation and maintenance cost of the project may be higher due to high pumping head but it can also be brought down with inter departmental understanding with NIT/NMC and irrigation department as mentioned in Table 8-4 If commissioned and proper O&M is assured, this project may prove to be boon for the region.
8-16
Jamghat Project: The project has been proposed on Kanhan River in Madhya Pradesh at Jamghat. The project has been formulated and the master plan is ready. This project would provide about 10.00 TMC (353 mcm/970 mld) fresh water to Maharashtra if commissioned. This could be an ultimate fresh water source for the region and could contribute to more than half of the total demand in NMA including NMC.
This water could be transported by gravity up to the water treatment plant site closest to the development area and would safeguard huge energy by avoiding pumping requirements.
8.1.5Existing Water Supply Mechanism in Nagpur District
The Maharashtra Water Supply and Sewerage Board (MWSSB), Rural Development Department, Zilla Parishad, Jeevan Pradhikaran Nigam, Environmental Engineering Department (EED), MIDC, NMC, and the State Irrigation Department are the government agencies responsible for the supply and development of water in the district. The Irrigation Department does not have any direct role in water supply though it supplies bulk quantity to MWSSB, MIDC and NMC from the dams constructed for irrigation purpose. Zilla Parishad is involved in small rural water supply schemes and Environmental Engineering Department implements the large rural water supply schemes. These agencies develop water resources to suit their individual requirements.
Within the NMA, the existing water supply schemes are mainly dependent on ground water sources like tube wells, bore wells, hand pumps etc. As per Nagpur District Regional Plan 1991-2011 Part - I, the EED and Zilla Parishad are mainly involved for preparation of water supply schemes. Scheme costing less than Rs 10 lakh are implemented by Zilla Parishad and more above are implemented by EED.
As discussed with the Irrigation Department (Pilot Project), 15 percent of the irrigation water from the irrigation schemes (storage created at the dam sites) is allocated for drinking purposes and the allocation is considered from the planning stages of the schemes.
8.1.6Existing Water Supply Scenario in the Surrounding Municipal Corporation and Councils
Nagpur Municipal Corporation
o Water Supply Sources for the NMC
The main sources of water supply for NMC are the Kanhan River and right bank canal of Pench project. Water for the Nagpur city is drawn from the following three surface sources:
- Gorewada Tank
一 Kanhan river
Pench canal
Ambazari Lake and the Vena irrigation tank are used for supplying water to the MIDC area, defence area and its surroundings respectively. The NMC produces about 582 mld of treated water from the different surface water sources. Table 8-5 indicates the present supply to the city from
8-17
different sources and capacities of water works and Table 8-7 below indicates the command areas of water supply by various sources in NMC.
Table 8-5Present treated water supply in NMC and capacities of Water Works
S No
Name of Water Works
Supply (mld)
Capacities of Water Treatment Plants
A
Surface Source
1
Old Gorewada WW
16
16
2
Kanhan WW
170*
240*
3
Pench Phase - I
136
136
4
Pench Phase - II
140
133
5
Pench Phase - III, Stage-I
120
118
Total
582
643
* After modification of Kanhan water works 170 mld (120+50). Capacity of WTP has been increased to 240 mld
Source: 1) MJP Project Report – May’98 / Master Plan for Water Supply: TCE Consulting Engineers Limited.
DPR on rehabilitation plan to implement 24x7 water supply project for Nagpur city- Dinesh Rathi and Associates 3) City Sanitation Plan report, March 2011, NMC
o Present Water Allocation from different sources to the NMC
Total allocation of water for the Nagpur city is about 261.51 mcm from the different sources as mentioned in the table below, out of which NMC is already drawing about 246.80 mcm fresh water.
Table 8-6Water sources for NMC
Sr No
Sources
Quantity allocated
Actual withdrawal
mcm
mld
mcm
mld
1
Kanhan Intake work at Kampti
65.71*
180.00
65.71*
180.00
2
Pench Project (PRBC) from Mahadula
112.00(Permanent allocations)
306.88
174.29*
477.50
78.00to be procured by NMC
213.72
3
Gorewada Lake
5.80
16.00
6.80
19.00
Total
261.51
716.6
246.80
676.50
Source: 1) DPR on rehabilitation plan to implement 24x7 water supply project for Nagpur city- Dinesh Rathi and Associates 2) Nagpur Municipal Corporation. * NMC data
Amba Kheri Lake having storage capacity of about 3.67 mcm also lies with NMC and NMC can integrate this water with city water supply though the quantity is less.
8-18
There is no other potential water source available in the region to provide fresh water to the NMC or NMA. NIT/NMC has to be dependent either on the proposed schemes or have to develop new sources for long term development of the NMA.
Existing Water Distribution System in the NMC
The existing water distribution system of Nagpur city consists of piped network of about 2100 km of which has been broadly divided in to three areas:
- North / east / south part of Nagpur city with water supply from Kanhan Head Works and WTP;
North / west / south / central part of Nagpur city with water supply from Pench project and WTP at Gorewada;
North / central part of Nagpur city with water supply from both the sources i.e. Pench and Kanhan
The total city area has been divided into ten water supply zones for better operation and maintenance. Water is supplied to the city by Master Balancing Reservoirs at Seminary Hills (SH) and Government Houses (GH). The population, service area, and approximate water supply to respective zone are given in Table 8-7.
Table 8-7Water supply service areas within NMC
S No
Zone
Population (2004)
Area (Ha)
Quantity of water supplied (mld)
1.
Dharampeth
261,666
4084.63
78.55
2.
Laxmi nagar
257,960
3516.31
54.05
3.
Hanuman nagar
165,717
2181.52
27.91
4.
Dhantoli
236,701
815.37
36.16
5.
Nehru nagar
198,411
1423.69
27.22
6.
Sokta bhawan
290,076
556.07
61.03
7.
Satranjipura
336,267
744.48
91.98
8.
Lakhadganj
176,716
2406.16
16.04
9.
Ashi nagar
225,881
3225.02
23.14
10.
Mangalwari
204,606
2109.06
44.26
11.
Pumping/feeder main Total
2,354,001
21,062.00
29.65490.00
Source: DPR on rehabilitation plan to implement 24x7 water supply project for Nagpur city- Dinesh Rathi and Associates -Water Audit and leak detection Report March 2004
As per the population projections, the city is expected to attain a population of 4.75 million by the year 2031 (Source: 24x7 water supply project for Nagpur city). NMC has taken enough initiatives and actions to augment
Kamptee Municipal Council
Kamptee Municipal council is receives water from an existing intake well on the Kanhan river. The total yield of water lifted from intake is 12 mld against the 10 mld demand of the town. The demand is based on 100 lpcd water supply for Kamptee town and 55 lpcd for villages close proximity to the town i.e. Ranala, Yerkheda, Gada, Ajjani and Ghorpad. A raw water transmission main of 610 mm diameter in a length of about 7.0 km has been laid from intake pump house to water treatment plant (WTP) of 15 mld treatment capacities.
Total length of the existing water supply distribution network is about 82 km with the construction material of CI, DI and PVC. Water is supplied to the town with the help of an existing GLSR of capacity 1.2 million litre capacity and three Over Head Storage Reservoirs (OHSRs) of capacities 0.26, 0.9 and 1.5 milion litres each.
Kalmeshwar Municipal Council
Water is pumped to Kalmeshwar from Itangoti Village Lake which is about 20 km away from the City. The total yield of water from this lake is 3.0 mld. Other source of water supply to the town is ground water and about 3.8 mld water is being extracted from six number of bore wells and three number of tube wells to cater to the demand of the town. Total length of distribution system is around 15 km.
The city receives an alternate day’s water supply due to less shortage capacity which is about 5.4 million litres in three OHSRs. Three new OHSRs of capacities 0.115, 0.1, 0.8 million litres have been proposed to augment the storage capacity.
8-20
8.1.7Existing Rural Water Supply Status in the NMA
Existing water supply in rural areas is mostly dependent on the ground water reserves and few of the villages situated in suburbs are covered by regional water supply schemes. The Zilla Parishad and EED are engaged in preparation and execution of water supply schemes in rural areas. Departments that are responsible for planning and implementation of the schemes in the region have implemented a large number of water supply schemes based on different sources. The different water supply schemes in rural areas of the NMA have been summarised by tehsils in the Table 8-9.
8-21
Table 8-9Existing rural water supply status in NMA
S No
Block
No of villages
Total population
Water Supply Status and water sources
Total no of individual PWS
No. of functional individual scheme
No. of working stand post
No. of hand pump
No of functional hand pump
No. of Public well
No. of Public well actually used
Total water supplied with PWS in litres per day
Regional PWS
Fully covered block
1
Parshioni
113
158949
87
79
481
460
374
239
230
4500341
0
2
Hingna
134
208355
110
110
777
682
566
392
390
5449320
18
3
Nagpur
141
223130
135
119
381
1034
941
320
75
482655
12
4
Mauda
119
151629
87
84
628
545
429
451
331
4708910
12
5
Kamptee
76
125100
78
78
510
558
468
137
115
2709268
3
Partially covered block, villages covered in the project area
6
Saoner
27
89577
30
30
249
95
95
24
22
1962750
0
7
Kalmeshwar
21
19439
17
17
90
76
69
23
23
133000
0
8
Umred
10
12068
9
8
27
20
20
17
15
314500
1
9
Kuhi
07
5570
7
7
32
43
43
9
9
122000
0
Source: Data collected from Zilla Parishad
8-22
8.1.8Existing Water supply for irrigation in Nagpur district
The Nagpur district has a total geographical area of 9,931 km2 out of which 709,500 hectare is cultivable area. The total surface runoff from the geographical area of the District is estimated to be about 4039 mcm out of which about 984 mcm can be utilised for surface irrigation purposes by construction of dams, canal systems and lift irrigation schemes.
Irrigation schemes (medium irrigation and minor irrigation schemes in both state and local sector) with irrigation potential of 68,867 hectare, have been completed as on July 1990 contemplating use of 565 mcm of surface water.
After the completion of all feasible schemes (utilising 984 mcm), the area that can be brought under irrigation will be 2.68 lakh hectare from surface water resources from the District which is covered by Wardha and Wainganga basins. The future available source of water for the District from river Wardha and Wainganga is 4,031 mcm and 10,872 mcm respectively.
There are many other small tributaries also in the district namely Warna, Jam, Kar, Kanhan, Pench, Kolar, Bawanthari, Sur and Gaotala and have been taped by constructing small irrigation schemes for the irrigation uses. By end of June 1990, 941 projects of irrigation schemes were completed with a potential of 154,066 hectare in the district. Full surface utilisation of 2.68 lakh hectare of land was proposed to be achieved by providing and completing various irrigation schemes. Position of completed irrigation schemes in the District as on 30 June 1990 have been given in the Table 8-10.
Table 8-10List of completed irrigation schemes
S No
Type of irrigation scheme
No. of schemes completed
Net irrigation potential in ha
1
Major Projects
1
83,076
2
Medium Projects
15
6,257
3
Minor (state sector)
114
43,677
4
Minor (Local Sector)
811
21,056
5
Lift irrigation schemes Total
-941
-1,54,066
Source: Nagpur Regional Plan 1991-2011
8.1.9Ongoing and Proposed Water Supply Projects
Nagpur Municipal Corporation
NMC has prepared the master plan for water supply to meet the water supply up to 2031 from identified sources. The proposed schemes for the supply of water for irrigation as well as for the city are Rahari barrage and Kochi barrage on Kanhan River. The development need of water supply for the city up to the year 2031 would be met from these future potential schemes. Year wise development of the water supply sources for the city water supply is presented in Table 8-11.
8-23
Table 8-11Proposed water supply sources for NMC and their capacities
Sr No
Source
Year wise cumulative capacities(mld)
2011
2021
2031
1
Pench Stage III Phase II (mld)
113
113
113
2
Rahari Barrage 30 kms from Nagpur City
-
175
350 (128 mcm)
3
Kochi Barrage, 33 kms from Nagpur City Total
-113
108396
108571
Source: Master Plan for Water Supply, Nagpur Municipal Corporation, September 2000
Rural Water supply
The rural water supply schemes of villages are implemented by three departments – The MWSSB, ZP and GSADA. MWSSB implements schemes costing above INR 5.0 lakh, ZP implements schemes costing less than INR 5.0 lakh and GSDA implements the bore well program. A total of 151 of 726 villages of the NMA have been selected by the ZP under the annual action plan for the year of 2011-12 for the development of water supply schemes. Details for this have been summarised in Annexure 8.
8.1.10Demand Supply Gap from the Potential Water Sources
The demand and gap assessment in water supply has been illustrated in Table 8-12. The assessment is made on the basis of existing and proposed water schemes to fulfil future demand. It is considered that partial demand will be fulfilled by private owners through individual bore wells/tube wells, however this is not accounted in this assessment.
Table 8-12Total supply of water from existing and proposed schemes and demand by year
S No
Description
Year-wise supply and demand
2011
2021
2031
1
Existing Schemes
Pench project
396
396
396
Kanhan water works
180
180
180
Old Gorewada
16
16
16
2
Proposed Schemes
Pench Project. Phase-III, Stage-II
113
113
113
Kochi Barrage on Kanhan Rivers
-
108
108
Rehari Barrage on Kanhan Rivers
-
175
350
Total Supply (including distribution losses)
695
978
1153
Total Demand (within the NMC limits)
532
709
934
Total treated water demand including NMC limits, fringe area and special projects (CIDCO and MIHAN)
558.72
738.38
987.8
Total raw water demand including NMC limits, fringe area and the special projects (CIDCO and MIHAN)
690(252 mcm)
915(334mcm)
1,222(446 mcm)
8-24
The table shows that there is likely to be surplus water which can be made available for the future growth within the NMA.
8.2Power Supply
8.2.1 Introduction
This part describes the overall power scenario in Maharashtra and the existing distribution and transmission networks in the State and the NMA.
Generation, transmission and distribution of electricity in the entire state, except Mumbai, was under the purview of Maharashtra State Electricity Board (MSEB). With the passage of the Electricity Act 2003, the Organisation was divided into three Companies viz. Maharashtra State Electricity Distribution Co. Ltd. (MSEDCL) for power distribution, Maharashtra State Power Generation Co. Ltd. (MAHAGENCO) for power generation and Maharashtra State Electricity Transmission Co. Ltd. (MAHATRANSCO), for power transmission.
Kamptee, Kuhi, Mauda and Umred fall within Division I and Hingna, Kalmeshwar, Parshioni, Saoner and Nagpur (Rural) fall within the Division II of the MSEDCL. (Source: MSEDCL).
8.2.2Power Supply Scenario in the State
MSEDCL’s sources of power include thermal, hydro, gas and non-conventional sources like solar, wind, bagasse etc. apart from the hydro power at Koyna. Thermal power constitutes a major share which it gets from MAHAGENCO projects, Central Sector projects and the Ratnagiri Gas and Power Pvt Ltd (RGPPL).
In terms of infrastructure, MSEDCL operates a vast far flung network comprising of 33 Kilo Volts (kV), 22 kV and 11kV lines, sub-stations and distribution transformers spread over 3 km2geographical area of Maharashtra covering 41,015 villages and 457 towns. It has 1,947 sub-stations (33 kV) with 49,000 Mega Volt Ampere (MVA) of transformation capacity, 10,334 high voltage (HV) feeders, and several thousand circuit kilometers of high tension (HT) and low tension (LT) lines.
MSEDCL’s existing network handles a load of about 10,000 to 11,000 Mega Watts (MW). By 2012, there will be an addition of another 10,000 MW in the system. With a view to cater future load, provide quality, reliable energy supply and reduce losses MSEDCL formulated a Rs. 11,000 crore infrastructure plan. The plan envisages erection and commissioning of 586 sub-stations, 52,351 circuit kilometers of HT lines, 58,629 distribution transformers besides augmentation of existing network. MSEB had erected 1,846 substations during its life time, whereas MSEDCL aims to construct 586 sub-stations in just two years. The project is being implemented on total turn-key basis and through 119 detailed project reports.
The state of Maharashtra which has the highest installed and generating capacity for power in the country as on date, is also currently facing peak power deficit of around 4,700 MW and energy deficit of about 21.2 percent which has resulted in heavy load shedding, ranging from 4 to 8 hours a day severely impacting the industrial sector of the state (RIL). As of September 2010, the State has an installed power
8-25
generation capacity of 17,266 million units (MU) capable of generating 83,008 MU annually, including power from renewable sources like wind, solar, bio-mass and small hydel (hydro-electric) power plants. However, the annual power shortage in Maharashtra is presently 2,609 MU, against average national deficit of 8,980 MU. (Source: Business World)
Power Supply Scenario in Maharashtra from 2001 - 2010
Table 8-13Present Power Supply Scenario in Maharashtra
Year
Peak
Demand (MW)
Availability (MW)
Peak Shortfall (-)
State
MSEDCL
Mumbai
/Surplus(+) (MW)
2001-02
11895
10119
1776
10879
-1016
2002-03
13418
11425
1993
10997
-2421
2003-04
13692
11357
2335
11650
-2042
2004-05
14822
12749
2073
11777
-3045
2005-06
16049
14016
2033
11889
-4160
2006-07
17161
14825
2336
13027
-4134
2007-08
18390
15946
2444
12522
-5868
2008-09
18072
15630
2442
13189
-4883
2009-10
19120
16582
2538
14952
-4168
Source: MAHATRANSCO
8.2.3Existing Power Demand by Tehsils in the NMA
Though the exact power demand in the tehsils within the NMA has not been established, the Table 8-14 shows the annual power import for the year 2010-2011 including the units measured and loss due to various reasons.
Table 8-14Present power demand in the NMA
Tehsil
Total Energy Import (LT)
Metered Billing (MU)
Total Energy Sale(MU)
Loss (MU)
Percent Loss
Division I
Kamptee
5.329
1.745
1.792
3.536
66.369
Kuhi
2.814
0.709
2.266
0.548
19.477
Mauda
5.406
1.443
2.708
2.698
49.904
Umred
3.673
1.688
2.284
1.389
37.823
Division II
Saoner
113.61
104.34
104.34
9.27
8.20
Hingna
100.45
82.90
87.62
12.84
12.80
Parshioni
12.71
10.54
10.67
2.04
16.00
Kalmeshwar
231.54
225.46
226.14
5.40
2.30
8-26
Tehsil
Total Energy Import (LT)
Metered Billing (MU)
Total Energy Sale(MU)
Loss (MU)
Percent Loss
Nagpur (Rural)
217.39
193.32
195.19
22.20
10.20
Note: No captive generation of power is considered in any of the above tehsils
8.2.4Existing and Proposed Power Generation Capacity
8.2.4.1 Existing Power Generation Capacity in Maharashtra
The power generation in the Maharashtra state is by state, private and central government through thermal, gas, hydro, nuclear and hydro based power plant.
The Table 8-15 gives a summary of the existing installed power generation capacity in Maharashtra by sectors (State, Central, Private companies). A detailed breakup of this table is provided in Annexure 9.
Table 8-15Summary of existing power generation installed capacity in Maharashtra (March 2010)
S No
Sector
Hydro
Thermal
Nuclear
Renewable
Total
Coal
Gas
Diesel
Total
1
State
2884.84
7300
912
0
8212
0
233.72
11330.56
2
Private
447
1900
180
0
2080
0
2204.25
4731.25
3
Central
0
2003.5
2623.93
0
4626.98
690.14
0
5317.12
4
Total
3331.84
11203.05
3715.93
0
14918.98
690.14
2437.97
21378.93
Source: CEA Report April 2010
8.2.4.2 Proposed Augmentation in the State Power Generation Capacity
The Table 8-16 gives a summary of the proposed power generation capacity for Maharashtra by sectors/ companies. A detailed break-up of this is given in Annexure 9.
Table 8-16Summary of proposals to augment power generation capacity in Maharashtra
Year
A
B
C
D
E
F
Total*
Total Demand (Coincident al)
Total Demand (Non-coincidental)
Peak Shortfall/Surplus (Coincidental)
2010-11
8,775
2,087
3,582
3,130
2,281
802
20,657
20,795
27,449
(-) 138
2011-12
9,414
2,166
4,422
3,342
4,304
802
24,450
22,635
29,199
(+) 1,815
2012-13
11,497
3,228
5,372
3,571
7,154
802
31,624
24,638
31,291
(+) 6,986
2013-14
12,113
3,228
5,838
3,817
7,244
802
33,042
26,610
32,996
(+) 6,432
2014-15
13,301
3,228
5,838
4,174
7,244
802
34,587
28,738
35,067
(+) 5,849
A: Mahagenco; B: State Govt/ Inter-state/ Mahadiscom; C: Central Sector; D: Mumbai; E: IPP; F: Wind Generation Note: *Availability considered subject to timely commissioning of upcoming generation
8-27
8.2.4.3 Existing Power Generation in the NMA
The Table 8-17 and Table 8-18 give the capacities of existing power plants located in the NMA and the proposed power plants in the NMA respectively.
Table 8-17Existing power generation capacity within the NMA
S No
MAHAGENCO Power Generating Station
Capacity (MW)
1
Koradi (4X115MW + 2X210MW + 1X200MW)
1,080
2
Khaparkheda (4X210MW )
840
Total capacity
1,920
Source: MSEDCL
8.2.4.4 Proposed Power Generation Capacity in the NMA
Table 8-18Proposed power plants within the NMA
S No
Company Name
Location
Capacity (MW)
1
MADC
Khairi, Hingna
100
2
MADC
MIHAN
271 (4x61.5 MW+25 MW DG set)
3
National Thermal Power Corporation (NTPC)
Mauda
1000
4
Vidarbha Industries Limited Total
Butibori
3001,671
Based on above details on existing and proposed power capacity for NMA the year wise projection for the power situation in the area is projected to be as given in the Table 8-19.
Table 8-19Power Generation Capacity within the NMA by 2015
S No
Company
Location
Year
2010-11
2011-12
2012-13
2014-15
2015-16
1
MAHAGENCO
Khaparkheda
840
0
0
0
0
2
MAHAGENCO
Koradi
1,040
0
0
0
0
3
MADC
MIHAN
0
271
0
0
0
4
MADC
Hingna
0
100
0
0
0
5
Vidharba Industries Limited
Butibori
0
0
300
0
0
6
National Thermal Power Corporation
Mauda
0
0
1,000
0
0
8-28
8.2.5Power Transmission and Distribution Networks
8.2.5.1 Existing conventional power transmission and distribution networks in Maharashtra
Table 8-20Public and private sector power transmission network (March 2010)
S No
Voltage
Number of EHV S/S
Transmission Capacity (MVA)
EHV Lines Ckt
MSETCL
1
500
2
3,582
1,504
2
400
21
13,270
6,562
3
220
149
31,161
12,357
4
132
246
19,517
11,063
5
110
33
2,080
1,691
6
100
35
2,323
678
7
66
34
1,139
3,270
Sub-total
520
73,072
37,125
TATA
1
220
7
3,120
364.86
2
110
11
4,272
713.06
Sub-total
18
7,392
1,077.92
Reliance
1
220
3
1,475
484.59
2
110
0
0
0
Sub-total
3
1,475
484.59
Source: MAHATRANSCO
8.2.5.2 Existing Conventional Power Transmission and Distribution Networks in the NMA
There are 726 villages and urban areas within the NMA with an approximate population of about 1,037,172 (Census 2001). The transmission is done via 400 kV Trans DC (direct current) lines by the Maharashtra State Transmission Company Limited (MAHATRANSCO).
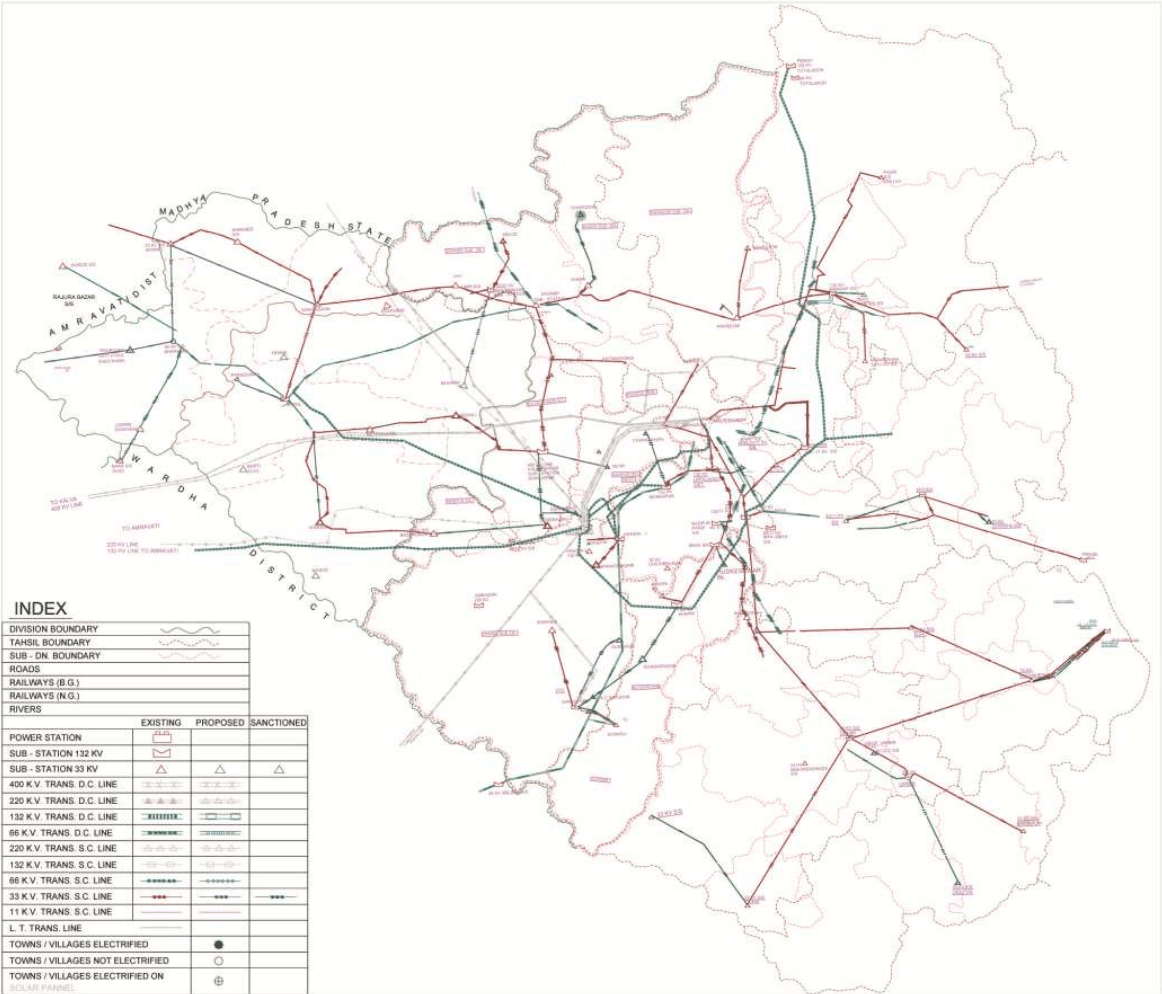
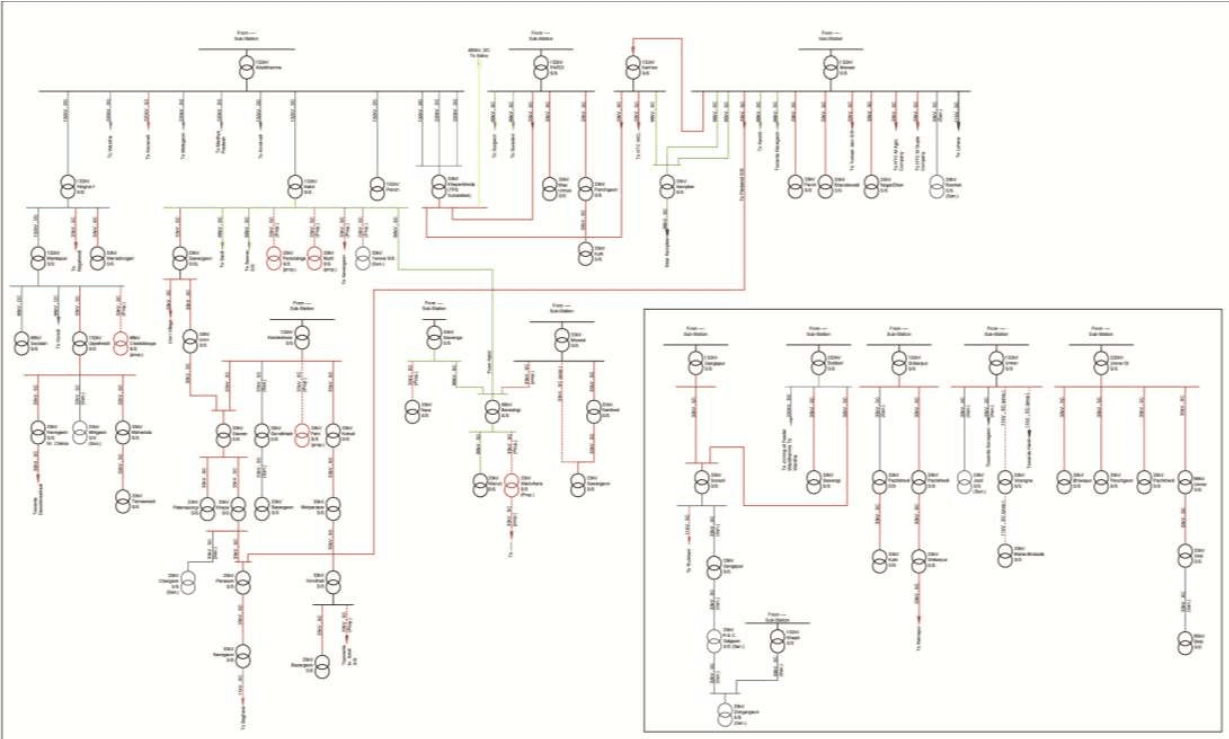
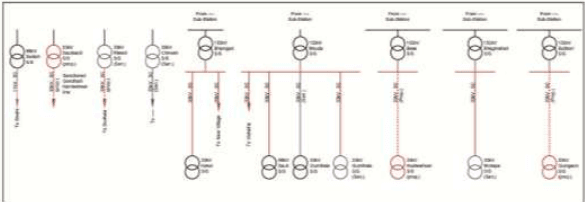
The Figure 8-4 illustrates the existing conventional power transmission and distribution network in the entire Nagpur Division and Figure 8-5 illustrates the same in a line diagram.
Power is transmitted from Kalwa to the Khaparkheda Electrical Sub- Station (ESS), where it is stepped down from 400 to 220 kV (MAHATRANSCO). From Khaparkheda the power is transmitted via 220 kV Trans DC lines from Waddhamna ESS and from Waddhamna to Butibori, Wardha, and Malegaon ESS (MAHATRANSCO). At Waddhamna power is further stepped down and transmitted via 132 kV Trans DC lines towards Hingna, Katol, and Khaparkheda. 132 kV Trans DC lines then carry power from Hingna to Mankapur ESS (MAHATRANSCO).
Transmission at the 66 kV level is done by both Trans SC (synchronized wave current) and Trans DC line. At Katol power is stepped down to 66 kV and transmitted by 66 kV Trans SC line to Saoli, Saoner, and Barasingi ESS. From Barasingi 66kV Trans SC lines transmit towards Sawanga ESS. From Sawanga a
8-29
new 66 kV Trans SC line has been proposed towards Nara ESS. From Barasingi 66 kV Trans SC lines also transmit Warud ESS and a future line is proposed towards Mowad (MSEDCL).
From Pardi 66 kV Trans SC lines transmit towards Surgaon ESS and Suradevi village. From Kamptee 66 kV Trans SC lines transmit towards Kanhan and Mansar ESS. From Mansar it is further transmitted to Kandi and Navegaon ESS (MSEDCL).
From Gangapur power is transmitted via 66 kV Trans SC lines to Sonarli ESS and from Gangapur to Sadgaon ESS (MSEDCL).
The 66 kV Trans DC line is used to convey power from Mankapur to Seoldah ESS and Koradi village. Further transmission is done throughout all tehsils on the 33 kV level either by stepping down from 132 kV to 66 kV and then to 33 kV or from 132 kV directly to 66 kV. It is proposed to do away with the 66 kV ESS and step down directly to 33 kV in the future (MSEDCL).
From Khaparkheda there is a 33 kV line Trans SC line to Pardi and Kanhan ESS and a 33 kV line Trans SC from Katol to Sawargaon and Paradsinga. The future extension to Yenwa has already been sanctioned. From Hingna the line goes towards Nagalwadi Village and Wanadongari ESS and a 33 kV Trans SC line goes from Mankapur to Uppalwadi and Chakkikapa ESS. From Uppalwadi the 33 kV line continues to Navegaon near Chikna, Bhilgaon, and Mahadula ESS. From Mahadula it carries forward towards Tamaswadi (MSEDCL).
From Sawargaon a 33 kV line goes towards Umri village and Umri ESS and from Umri ESS towards Saoner. From Saoner it further supplies to Kamleshwar ESS and continues towards Gondkhairi, Fetri, and Kohali ESS. While the line from Gondkhairi proceeds towards Bazargaon from Kohali the line goes to Kondhali ESS via Metpanjara ESS. From Kondhali there is an additional line to Bazargaon ESS and towards Saoli ESS (MSEDCL).
From Saoner a 33 kV Trans SC line goes to Patansaongi and Khapa ESS and from Khapa to Chargaon and Navegaon ESS via Parshioni ESS. From Parshioni the line proceeds towards Mansar ESS. From Pardi a 33 kV Trans SC line goes towards Maaumiya ESS and Kuhi ESS via Panchgaon ESS (MSEDCL).
From Kanhan a 33 kV Trans SC line runs towards Mansar ESS. From Kanhan power is supplied through 33 kV Trans SC line to private feeders like HTC WCL. Lines from Mansar also supply to private feeders like HTC M Agro and HTC M Gupta. From Mansar, Paoni, Bhandewadi, Nagardhan, and Ramtek ESS are also fed. Feeders from Mowad go towards Narkhed and Sawargaon ESS and from Butibori to Sawangi and Sonarli ESS. From Sadgaon the lines proceed towards Dongargaon and Khapri ESS and from Shikarpur towards Kuhi via Panchkhedi ESS. Umred (ST) supplies to Bhivapur, Panchgaon, Umred, and Panchkhedi.
While 33 kV Trans SC line between Umred to Jaoli and Umred to Sonegaon have already been sanctioned, it is also proposed to lay lines from Sawargaon to Mowad, from Barasingi to Wadvihara ESS and from Katol to Murti (MSEDCL).
8-30
8.2.5.3 Proposed conventional power transmission and distribution networks in the NMA
MAHATRANSCO has proposals to augment the transmission system within the NMA. Key projects are mentioned below and details of these projects are given in the Annexure 9.
Elimination of 66 kV Voltage Level
MAHATRANSCO has proposed to eliminate 66 kV voltage level, for example, at Barasinghi substation the utility company proposes a 132 kV Katol-Bharshingi-Warud SCDC line measuring 50 km.
Additional Link Lines for substations where only single circuit and single source is available
For Kalmeshwar Saoner line, 132 kV Saoner substation is fed from 132kV Kalmeshwar S/s with S/c line. Hence to provide uninterrupted supply during planned outages MAHATRANSCO has proposed to add another line.
Additional substations to reduce transformer load
At Koradi substation, existing transformer capacity available in S/s is, 400/220 - 1 x 315 - 220 load 400/220 - 1 x 300 -245 load Considering the maximum load reach on the transformer, in event of interruption/outage on any one of the transformer MAHATRANSCO has proposed another transformer to take care of existing load so as to avoid load shedding.
8-31
This page is intentionally left blank.
8-32
Figure 8-4: Existing conventional power transmission and distribution network in Nagpur District
DIVISION BOUNDARY
TAHSIL BOUNDARY
SUB - DN. BOUNDARY
ROADS
RAILWAYS (B.G.)
RAILWAYS (N.G.)
RIVERS
EXISTING
PROPOSED
SANCTIONED
POWER STATION
SUB - STATION 132 KV
SUB - STATION 33 KV
400 K.V. TRANS. D.C. LINE
× × ×
× × ×
8.2.6Renewable Energy Resources
Maharashtra state has been one of the leaders in the country for the adoption of power generation through renewable power sources. The main sources being wind turbines, bio-mass, solar and small hydro projects. The state wind power policy has helped the state generate 2,004 MW through 2,536 wind turbines and also due to the Maharashtra Electricity Regulatory Committee (MERC) tariff policy under the MNRE scheme around 1,250 MW is being generated by 202 sugar mills in the state.
Within NMA the focus has been primarily on power generation through small hydro projects and solar power stations. While 211 MW is being generated through 302 small hydro plants within the state, an interactive solar grid having a capacity of 30 MW has been proposed to MERC under the MNRE scheme (MIDC). Details on the existing and proposed power generation power plant based on renewable energy are given in Table 8-21 and Table 8-22.
Table 8-21Existing power generation capacity from renewable resources
S No
Type of Resource
Capacity Applied (MW)
Ex-Bus Generation (MW)
1
IPP/CPP/biomass/bagasse/biogas based plants
248.15
224
2
Wind
2,526
260
Total
2,774.15
484
Source: MAHATRANSCO
Table 8-22Proposed augmentation to renewable power generation capacity by 2015
S No
Type of Resource
Capacity Applied (MW)
MW ( EX-Bus Generation )
2010-11
2011-12
2012-13
2014-15
2015-16
1
IPP/CPP/Biomass/ Bagasse/Biogas based Plants
14545.51
3005.04
5717.14
5841
990
-
2
Wind
5273
542
-
-
-
-
Total
19818.51
3547.04
5717.14
5841
990
-
Source: MAHATRANSCO
8-35
8.3Drainage and Sewerage
8.3.1 Natural Drainage Pattern and Topography
As mentioned in Chapter 2, the topography of the area is very gentle with the mean sea level (MSL) ranging from 350 m to 260 m (Survey of India topographical sheets 1975 to 2005). The surface runoff is discharged in the rivers and water bodies through seasonal rivers, surface flows and natural drains. Based on the observation made during site visits, most of the NMA is not prone to floods owing to its topography. It has been noted that the GoM has constructed various medium and minor irrigation projects, check-dams on the various tributaries on these rivers under many schemes. These projects will further reduce the vulnerability of floods in the NMA.
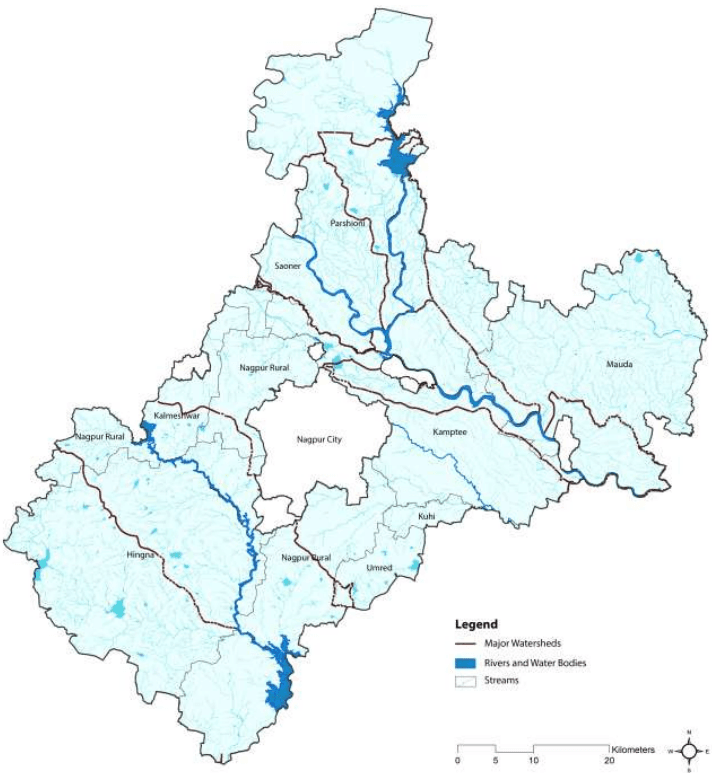
A gentle slope is observed from north to south east and from south west to south east the area’s natural drainage pattern is excellent with suitable topography and a natural gradient (See Chapter 3, 3.1). There are two major natural streams-Nag and Pilli and several connecting nallahs running across the city.
As mentioned in Chapter 3 before, there is a network of many rivers in the area; however, the major rivers are Wainganga, Kanhan, and Pench. Both Kanhan and Pench are tributaries of Wainganga and they merge into Kanhan within the project area near Kamptee as shown in Figure 8-6.
Hydrologically, the total project area can be divided into Wainganga and Wardha Catchments. About 70 percent of the water within the NMA drains into Wainganga through Kanhan River and its tributaries. Tributaries of Kanhan in the project area are Pench, Chandra Bagha, Nag, Pilli and Kanhari. Rivers Bawanthari, Surgay Mukhi drains directly into Wainganga. The water from the south west side of the NMA drains into Wardha River through Vena, Bor and Amghat.
The SOI topographic sheets illustrate that the above rivers upstream flow through steep slopes with almost no inhabitation in the upstream catchment of the river. High runoff is generated upstream and the velocity of the flow is reduced downstream. Because of this the heading up of water happens resulting in increased flooding in the near vicinity of the streams which is the likely primary reason for the submergence of the villages in close proximity to the rivers.
8-36
Figure 8-6: Drainage of the NMA and catchments of Pench, Kanhan and Vena Rivers
8-37
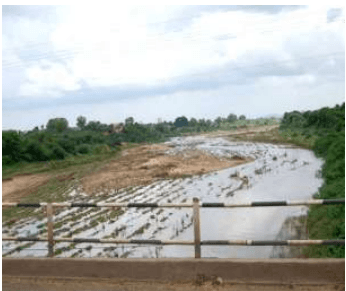
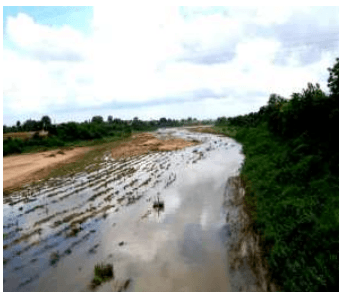
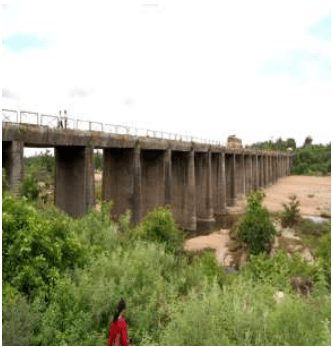
Figure 8-7: Kanhan and Pench Rivers
Existing bridge across Kanhan river
Kanhan river
Existing bridge on NH17 across Pench river
Existing dam over Pench river
Figure 8-7 shows views of Pench and Kanhan rivers and the existing structures across these rivers. As per local enquiry during site visits, the NMA has not witnessed a floods since 1994 but it is reported that heavy downpour in 2010 had inundated many low-lying areas and other localities. A similar situation is reported almost every year after heavy rains. A local enquiry also revealed that many bridges on Nag and Pili rivers get submerged, sometimes isolating localities during monsoon season.
8.3.2 Existing Storm Water Drainage System
The existing drains data in the city has been tabulated in the Table 8-23 shown below shows that the coverage of storm network is 24 percent only. This implies that only 3 percent of roads have storm water
8-38
drains. As stated later in the chapter these drains also carry sewage and hence are often chocked and flooded.
Table 8-23Length of existing drains and proposed drains
Zones of Nagpur City
Existing Drains (km)
Proposed Drains (km)
North zone
323.48
1690
Central Zone
461
961
South Zone
153
1390
Total
937 km
4,041 km
(Source: Draft City sanitation plan from Nagpur Municipal Corporation 2011)
As per the information from relevant department (NMC and others Municipal Corporation) and also seen during site visits that there is no existing drainage scheme within NMA except in the municipal council areas. The details of drainage conditions in Nagpur city and two municipal councils of Kalmeshwar and Kamptee is described below.
Drainage system in the NMC
The existing storm water drainage system in Nagpur city covers major storm water carrying streams i.e. the Pili River, the Nag River and the Pora River which falls outside NMC boundary. The Pili River starts from Gorewada tank at the northwest end of the city, runs through the north to the east end of the city. Final disposal of storm-water from part of west Nagpur and north Nagpur is discharged into this river through minor and major drains.
Currently, it has been observed that, only 30-35 percent of the road network in the Nagpur city is covered by the storm water drainage system of open drains and closed drains. The system also carries sewage and due to which it often chocked and flooded. Drains, rivers and chambers are heavily silted and require cleaning. In some places sewers directly discharge into Nag River and major nallahs.
In the monsoon (peak period), there are problems of backflow in the sewers in the urban areas in the area under study that lead to unhygienic conditions and a possibility of outbreak of epidemic. There is a need to revive the natural drainage pattern by de-silting the natural drains, rivers and nallahs and removing the blockages in the natural drainage paths. To support the natural system, the storm water drainage network along the roads also needs to be strengthened in terms of coverage and capacity. Both coverage and design need to be improved. With the concretisation through houses, roads, and footpaths, the permeable area is gradually decreasing leading to poor rain water percolation. Thus a proper storm water drainage becomes imperative to avoid water logging and limit the amount of water flowing in the travel way or ponding at sag points in the roadway.
8.3.3 Storm Water Drainage Proposals and Flood Management
As per the data available, it is clear that there are a number of irrigation projects built over the existing rivers as detailed under 8.1. The amount of runoff estimated from rivers basin is 4,039 MCM out of which 984 MCM is used for irrigation which implies that there are storages created over the rivers to account for the water supply for irrigation purpose. A hydrology model has been developed and flood lines of 25 and 50 years have been mapped based on the modelling. This information has been submitted to the irrigation department for authentication. The flood lines will be incorporated after the authentication. It is proposed to rejuvenate the rivers and study the existing detailed condition of culverts and bridges to improve their hydraulic capacity. There is a need to improve the natural drainage pattern by de-silting the natural drains and removing the blockages created by sewage. The storm network along the roads as mentioned under 8.1.1 needs to be strengthened in terms of coverage and capacity.
During the detailed study, there would be a requirement of estimation of flood generated from each stream and to provide adequate numbers of structures at each crossing of rivers/streams with the proposed roads within the NMA. While planning any development, the objective is kept in mind that there is no flooding, no interruption in communication because of the flooding. To achieve this, the extent of flood and its duration shall be noted down at critical locations so that the formation levels/plinth levels of the infrastructure can be finalised keeping in mind the flood levels at flood prone areas.
River training works for the rivers crossing the NMA may need to be done to avoid the tendency of rivers to enter into the proposed infrastructure within NMA. River training work can be done in terms of bunds, levees, and spurs. The requirement of the river training work will vary from location to location and the type of river course in the area.
8.3.4 Rain Water Harvesting
For the economic design of drains it is necessary to trap the rain water by rain water harvesting structures. NMC has put down the following rules for the rain water harvesting structures
All the layout open spaces, amenity spaces of housing, societies and new construction\ reconstructions\ additions on plots having area not less than 150 m2 of all towns shall have one or more rain water harvesting structures
The owner of building mentioned above shall ensure that the rain water structure is maintained properly by conducting regular repairs whenever it is required.
8-40
The depth of the rainwater harvesting structures would be decided based on the geotechnical strata below the ground and on the infiltration rate of the soil below.
8.3.5 Areas with Water Logging Issues
During site visits, it has been observed that due to the existing topography, natural slopes and presence of many nallahs and rivers, the project area has excellent natural drainage pattern. Despite the natural drainage pattern certain villages are prone to floods due to reduction in the flow velocity of the rivers (Explained in detail under 8.4.1).
8.4Disposal of Solid Waste
As per the information obtained from the relevant government agencies (NMC and municipal councils) and observations from the site visits, there is a centralised sewerage system for the NMC area. The growing urban and rural areas in the fringes and within the NMA are not serviced by a proper sewerage network. The details of sewerage conditions in Nagpur city and two municipal councils that is Kalmeshwar and Kamptee have been described below.
8.4.1 Existing Sewerage System in the NMC and Municipal Councils
Nagpur Municipal Corporation
About 70 percent of Nagpur city is covered with sewerage system and total waste water generation from the city is about 345 mld (as per estimate by NMC) which increases to 600 mld in the peak season (Source: Draft City Sanitation Plan report from Nagpur Municipal Corporation, March 2011).
NMC has constructed only one plant for the city which has a capacity of 100 mld. Based on its topography the city has been divided into three sewerage zones:
o North Sewerage Zone (NSZ);
o Central Sewerage Zone (CSZ) and
o South Sewerage Zone (SSZ)
The pumping and treatment conditions of the sewerage system are poor and inadequate and as noted, out of 345 mld of sewage generated about 40 percent that is 80 mld is collected and treated at the Bhandewadi sewage treatment plant.
As observed, the sewage generated from the central sewerage zone is tapped and treated. The sewage from the northern and southern zones and the remaining sewage from the central zone flow into the nallahs and ultimately to the river Nag, river Pili, constructed drains and local water bodies without any treatment. This leads to extremely high levels of pollution in the water bodies of Nagpur.
8-41
Of the three zones, the situation is most critical in the north zone. The situation becomes further worse in the monsoon season. The literature published by NEERI suggests that the quality of water flowing in Nag and Pilli rivers is deteriorating day by day and is even not suitable even for irrigation purpose.
Kamptee and Kalmeshwar Municipal Councils
As discussed with the Municipal Council, presently there is no existing centralised sewerage scheme in city area. People have individual septic tanks in some areas and rest is directly discharged into nallahs or open drains. Due to non-availability of sewerage system unhygienic conditions prevails in the area and causes pollution of ground and surface sources.
8.4.2 Re-use of Treated Sewage Effluent
Presently there is no existing/planned scheme for treatment of effluent from the NMC limits and its reuse for other purposes.
8.4.3 Ongoing and Proposed Projects for Augmenting the Existing Sewerage Systems
Nagpur Municipal Corporation
The situation of Nagpur city with respect to sewage management is very poor and is likely to worsen in the future if appropriate measures are not taken. In next 30 years, waste water generation from the city is likely to increase with the increasing population of the city. The pollution from the untreated waste water flowing in open city drains which also seeps into the ground would impact the environment and ecology of the city and would also affect the overall ground water quality. To maintain a clean and healthy city environment and provide hygienic living condition in the city, the NMC has planned several phase wise sewage management schemes.
Looking at the gently sloping topography, with the slope from north-west to south-east, the city has been divided in to three main sewerage zones. (Source: Draft City Sanitation Plan report from Nagpur Municipal Corporation, March 2011).
North Sewerage Zone
Sewage from the north zone will be sent to the treatment plant by a combination of gravity and pumping system. Total area of north sewerage zone is about 84.18 km2 and has been divided into six sub zones. The total length of proposed sewer lines in this zone is about 764 km and three STPs have been proposed at different locations to treat the entire sewage generated in the zone.
Central Sewerage Zone
Sewage from the central zone will be sent to the treatment plant by a combination of gravity and pumping system. Total area of central sewerage zone is about 73.73 km2and is divided in to five sub zones. Total proposed sewer length in this zone is about 240 km. Two STPs have also been proposed at different locations in this zone.
8-42
South Sewerage Zone
Sewage from the south zone will be sent to the treatment plant by a combination of gravity and pumping system. Total area of south sewerage zone is about 37.59 km2 and this whole area has been divided in to four sub zones. Total proposed sewer length in this zone is about 193 km. Two STPs in this zone have also been proposed at different locations.
Sewage treatment plants with its year wise design capacity have been presented in Table 8-24.
Table 8-24Capacity of treatment Plants in the three sewage zones
Sr No
Zone
Location
Total Capacity (mld)
Year wise break-up
8.6Gas
8.6.1 General
Natural Gas in India gained attention as a fuel of importance after the setting up of the Gas Authority of India Limited (GAIL) to handle the gas distribution business. It is being used in the residential (as PNG Piped Natural Gas) as well as commercial sector (as CNG- Compressed Natural Gas). For industrial applications, natural gas is used as a feedstock for making chemicals and as a fuel for boilers and furnaces.
According to the India Hydrocarbon Vision 2025 Report, the demand for natural gas in India is expected to show a sharp rise in future because of its environmental friendliness and cost competitiveness. During 2003-2004, the gas supply was about 80 million standard cubic meters per day (mmscmd) as against the demand of 120 mmscmd. The total availability of gas (domestic and LNG) in India is set to be augmented to 210 mmscmd by 2018-2019.
The demand for natural gas is from industries like power, fertilizer, sponge iron and glass/ceramics. However due to shortage in supply, currently it is mainly supplied to the fertilizer and power sectors.
The growing demand and supply gap shall be met from imports, increase in domestic production and by switching to liquid fuels. Many big cities and industrial towns are still not linked to the pipeline network in India, as shortages of gas have discouraged the expansion of pipelines.
India’s current gas transmission network stands at 11,148 km with the capacity of 273.8 mmscmd including following distributors:
Gas Authority of India Ltd. (GAIL) – 6,986 km
Gujarat State Petronet Ltd. (GSPL) – 1,420 km
Reliance Gas Transportation Infrastructure Limited (RGTIL) – 1,385 km
Others – 1,357 km
GAIL has been authorized by the Petroleum and Natural Gas Regulatory Board (PNGRB) and Ministry of Petroleum and Natural Gas (MoPNG) for implementing City Gas Distribution (CGD) Projects in various cities across many states. As per the estimate more than 200 cities have been identified for the development of CGD projects in a phased manner in synchronization with the commissioning of the pipeline.
8.6.2 Gas network in Maharashtra and the NMA
8.6.2.1 Gas transmission network
In India, about 21,891 km of gas pipeline capacity is proposed as indicated in Table 8-26 which shows proposal that pass through or close to the NMA. The following proposals shall be discussed with the GAIL and GSPL to know their status in near future.
GAIL - Vijaywada-Nagpur-Bijapur;
8-45
GSPL - Surat –Paradip and Mallavaram-Bhiwara
Table 8-26Summary of proposed gas pipeline networks
Various cities within the state of Maharashtra including Mumbai, Thane, Navi Mumbai, Mira-Bhayandar and Pune are covered in the GAIL CGD network. Currently, there is no network to supply natural gas to Nagpur and it is also not included in the GAIL list of implementing CGD network for piped natural gas supply to households. As per one of the press releases on Indian gas transmission business by Credit
8-46
Analysis and Research (CARE) Ltd, GAIL is planning a 1,665 km gas pipeline of 30mmscmd capacity likely to pass through Vijaywada-Nagpur-Bijapur.
The Maharashtra Natural Gas Limited (MNGL) is a company incorporated in January 2006 to meet the City Gas distribution needs of various districts in Maharashtra. MNGL has procured the PNGRB authorization fo city gas distribution in Pune and Pimpri-Chinchwad city including adjoining areas of Hinjewadi, Chakan and Talegaon and subsequently will move on to other districts of Maharashtra depending on economic feasibility.
As per another proposal, the Gujarat State Petronet Ltd (GSPL), a subsidiary of Gujarat State Petroleum Corporation Ltd (GSPC), is planning to construct a 1,600 km long natural gas pipeline from Surat (Gujarat) to Paradip (Orissa). The source of gas is expected to be the liquefied natural gas (LNG) terminal of GSPC at Mundra, Shell at Hazira, Petronet at Dahej and the domestic gas fields offshore of Gujarat.
The planned pipeline is likely to pass through the Mora-Jalgaon-Nagpur- Raipur-Bhubaneswar route with spur lines to consumers. The pipeline is likely to travel through Nagpur as it is identified as one of the major demand centres for the supply of natural gas.
8.5Telecommunications
8.5.1 Telecommunications in Maharashtra
In the present scenario, the telecommunication sector enjoys substantial encouragement and support from government policies. The telephone-density (telephone per 100 population-urban/rural) in Maharashtra is 46.65 percent against overall national average of 47.88 percent (source: Ministry of Telecom Annual report year 2009 -2010).
8.5.2 Telecommunications in NMA
Companies such as Bharat Sanchar Nigam Limited (BSNL), Tata Teleservices Limited, Reliance Communications and Bharti Airtel Limited Broadband are the major broadband internet service providers in the Nagpur area.
Companies BSNL, Airtel, Reliance, Tata Indicom, Vodafone and Idea are the main telephone service providers in the local market of Nagpur city and NMA. It is anticipated that multiple carrier services can be made available to the consumers in project area by government agencies or private operators.
8-44
3619.46
41.52
Mauda
Command
13711.98
1412.33
365.84
1778.17
731.67
11567.98
12.97
Safe
Non-command
373.80
88.68
43.93
132.61
87.86
197.26
35.48
Total
14085.78
1501.01
409.76
1910.78
819.53
11765.24
13.57
Kamptee
Command
5718.60
1605.01
339.00
1944.01
677.99
3435.60
33.99
Safe
Non-command
705.99
380.12
57.47
437.59
114.94
210.93
61.98
Total
6424.59
1985.13
396.47
2381.60
792.93
3646.53
37.07
Saoner
Command
3160.42
994.03
67.98
1062.01
92.16
2096.63
33.60
Safe
Non-command
3681.17
3467.50
275.84
3743.33
180.25
725.84
101.69
Total
6841.59
4461.52
343.82
4805.34
272.41
2822.47
70.24
Kalmeshwar
Command
334.78
349.73
14.64
364.37
5.48
2.05
108.84
Safe
8-6
Tehsil
Area Type
Net annual ground water availability (ha.m/yr.)
Annual Ground Water Draft (ha.m/yr.)*
Allocation for domestic and industrial requirement for next 25 years (ha.m/yr.)
Groundwater availability for future irrigation (ha.m/yr.)
Stage of Ground water development (%)
Category
Irrigation
Domestic and Industrial Uses
Total
Non-command
6839.21
5014.18
302.17
5316.34
572.95
1276.74
77.73
Total
7173.99
5363.91
316.81
5680.72
578.43
1278.79
79.18
Umred
Command
1252.81
163.79
107.69
271.47
208.58
880.45
21.67
Safe
Non-command
8876.41
1643.17
324.42
1967.59
648.84
6584.40
22.17
Total
10129.23
1806.96
432.10
2239.07
857.42
7464.85
22.10
Kuhi
Command
438.53
123.68
30.13
153.81
60.25
254.60
35.07
Safe
Non-command
7189.16
2189.78
472.05
2661.83
944.10
4055.28
37.03
Total
7627.69
2313.46
502.18
2815.64
1004.35
4309.88
36.91
Total
Command
32334.5
5530.2
1188.01
6718.2
2301.58
24547.59
22.19
Safe
Non-command
43192.22
17409.28
2320.48
19729.7
4197.75
22302.26
54.74
Total
75526.74
22939.47
3508.46
26447.9
6499.33
46849.85
43.47
Source: Ground Water Information Nagpur District Maharashtra, Central Region Nagpur 2009; *hectare metre/year
8-7
-
2.853
There is no surplus water at this source for future allocation
5
Salai (Mokasa)Minor Irrigation project, constructed on tributaries of Kanhan river
2.143
-
-
2.143
There is no surplus water at this source for future allocation
6
Makardhokara project:FWL: 298.10mMWL: 291.50m
18.921
5.685
-
8.506
There is no surplus water at this source for future allocation
7
Akoli Barrage planned at Nag River
50 (assumed)
50 (assumed)
-
-
Nag river is contaminated due to the disposal of untreated sewage from the Nagpur town. This water can be tapped by constructing barrage at Akoli and treated up to the irrigation standards. The treated water can be used for the irrigation purposes in the command area of pench project and fresh water can be allocated for the drinking purpose from the pench project at higher elevations. Nag water can itself be treated up to the drinking standards by providing a proper treatment plant and supplied for domestic purposes.
8-19
the existing system to supply adequate water to the consumers and several new schemes have been propose for the implementation in the near future.
Based on the statistical analysis conducted by NEERI and the standards recommended by the Central Public Health and Environmental Engineering Organisation (CPHEEO) manual on water supply, the domestic water supply (lpcd) rates adopted for different housing categories in Nagpur for the present conditions are indicated in Table 8-8. In Nagpur, the domestic water supply on an average is not more than 130 lpcd, whereas in outer skirts of Nagpur city it is even less than 40 lpcd.
Table 8-8Adopted water supply rates by housing category
Water Supply Category
Water Demand (lpcd)
2001
2011
2021
2031
Residential area other than slums (HIG)
170
180
190
200
Residential area other than slums (MIG)
150
160
170
180
Residential area other than slums (LIG)
100
110
120
130
Slum area through distribution system
100
100
100
100
Public stand post
40
40
40
40
Source: Master Plan for Water Supply, Nagpur Municipal Corporation, September 2000
220 K.V. TRANS. D.C. LINE
132 K.V. TRANS. D.C. LINE
***
—
66 K.V. TRANS. D.C. LINE
***
***
220 K.V. TRANS. S.C. LINE
132 K.V. TRANS. S.C. LINE
—
—
66 K.V. TRANS. S.C. LINE
***
***
33 K.V. TRANS. S.C. LINE
***
***
***
11 K.V. TRANS. S.C. LINE
—
—
L. T. TRANS. LINE
TOWNS / VILLAGES ELECTRIFIED
TOWNS / VILLAGES NOT ELECTRIFIED
TOWNS / VILLAGES ELECTRIFIED ON SOLAR PANEL
8-33
Figure 8-5: Line diagram for the existing power transmission and distribution network in the NMA
EXISTING
PROPOSED
SANCTIONED
400 K.V. TRANS. D.C. LINE
——
——
220 K.V. TRANS. D.C. LINE
——
——
132 K.V. TRANS. D.C. LINE
——
----
85 K.V. TRANS. D.C. LINE
——
——
220 K.V. TRANS. S.C. LINE
——
——
132 K.V. TRANS. S.C. LINE
——
——
85 K.V. TRANS. S.C. LINE
——
——
33 K.V. TRANS. S.C. LINE
——
——
——
11 K.V. TRANS. S.C. LINE
——
——
8-34
8-39
Kalmeshwar Municipal Council
Approximately 90 percent of road network in Kalmeshwar municipal area is covered by the storm water drainage system and the system has been planned for 100 percent coverage.
Kamptee Municipal Council
At present there are no provisions for a storm water drainage system in the Kamptee Municipal Council.
Remark
2011
2021
2031
1
North Sewerage Zone
Wanjari near Pili River
282
94
188
282
-
2
Central Sewerage Zone
Bhandewadi
260
153
206
260
100 mld (existing)
3
South Sewerage Zone
Chikhli
213
71
142
213
-
Total
755
318
536
755
Source: Sewerage master plan of Nagpur city for the year 2041.
Sewage Generation and Treatment in NMC
The NMC has assessed the quantity of sewage generation at different horizons of development that is 2011, 2026 and 2041 based on the population growth and rate of water supply and has been presented in Table 8-25. It is assumed that the water supply to the city would be considering the rate of 150 lpcd and return factor for sewage generation would be 80 percent of water supply. 5 percent of sewage generated is considered due to ground water percolation which makes total per capita sewage generation of 126 litres.
Two additional STPs are proposed at Chikli and Wanjari.
Table 8-25Projected sewage generation from three sewage zones in Nagpur
Year
North Sewerage Zone
Central Sewerage Zone
South Sewerage Zone
Projected Population in Nagpur City
Total Sewerage Generation in Nagpur City (mld)
Population
Sewerage (mld)
Population
Sewerage (mld)
Population
Sewerage (mld)
2011
932,042
117.44
1,131,364
142.55
677,828
85.4
2,741,234
345.39
2026
1,471,378
185.39
1,503,991
189.5
1,076,338
135.63
4,051,707
510.52
2041
2,235,152
281.63
2,067,129
260.45
1,666,178
209.95
5,968,459
752.03
8-43
Year
North Sewerage Zone
Central Sewerage Zone
South Sewerage Zone
Projected Population in Nagpur City
Total Sewerage Generation in Nagpur City (mld)
Population
Sewerage (mld)
Population
Sewerage (mld)
Population
Sewerage (mld)
Total
584.46
592.5
430.98
1607.94
Source: Draft City Sanitation Plan report from Nagpur Municipal Corporation, March 2011
Kamptee Municipal Council
Sewerage system of Kamptee Municipal council is under construction stage and following are the salient features of proposed sewerage scheme (Source: Kamptee Municipal Council ):
o sewer network with RCC pipes of minimum diameter 150 mm for laterals and maximum diameter 1,000 mm for main sewers;
o total length of about 80 km;
o proposed STP of capacity 12.33 mld;
o Treated effluent to be discharged in to Bagdora nallah discharging into the Kanhan River.
8.7Solid Waste Management
8.7.1 Waste Generation in the NMA
Solid waste collection is limited to the municipal areas only in the current scenario with no specific waste management program in the NMA. Within the NMC limits, about 750 tons of solid waste is generated annually which is collected and transferred to the existing landfill site at Bhandewadi by a private agency. The landfill work is carried out by another private agency which has 1,000 tons of annual capacity.
Solid Waste Management in Kalmeshwar Municipal Council
The Kalmeshwar municipal council has privatised door to door collection and transportation of solid waste with no segregation at source or recycling of the collected waste. There is a dumping site of 1 acre area allocated for the collected solid waste on Gowari road outside the municipal boundary, 1 km away from the municipal area. As per the Municipal Council, 1 – 1.5 tons per day of waste is collected at the existing landfill site. A dumping yard is proposed to be developed as per the Municipal Solid Waste (Management and Handling) Rules 2,000 introducing waste recycling techniques for disposal/ reuse of solid waste.
8.7.2 Existing Mechanism Solid Waste Disposal in the NMC Limits
The existing municipal solid waste (MSW) management system introduced with the NMC area includes collection, segregation, storage, transportation, processing and disposal MSW at allocated landfill site at Bhandewadi. As per the Municipal Solid Waste (Management and Handling) Rules 2000, MSW includes commercial and residential wastes generated in the municipal/notified area.
8-47
Following are the components of the MSW management system existing within Nagpur city:
Collection and Transportation of MSW
o Street sweeping
The sweeping length of roads in the city is about 3400km as regards to cleaning. Beat concept has been introduced for the sweeping of roads. One beat consist of a road length of 500,700 or 900 meters. The solid waste collected in road sweeping is carried to the nearest collection centre and then to dumping site.
Door to door collection
NMC has privatized the work of house to house collection and transportation. M/s. Kanak Resources Management has been engaged for house to house collection of waste within the municipal area since June-2008. The scheme entitled a “Bin Free City” ensures 100 percent house to house collection of garbage. The door to door collection of waste in the urban residential areas is done using automated hydraulic vehicles. Rickshaws and hand carts are utilized in areas which are not accessible by automobile vehicles such as slums and congested urban localities within the NMC. Waste from vegetable markets, commercial areas, malls, shops, slaughter houses etc. is collected separately. The garbage collected is mostly transported to dumping station directly or through collection points such as transfer stations where the collected garbage is segregated and stored till it is transported to the landfill site at Bhandewadi.
Nagpur city initiated door to door collection of municipal solid waste in the year 2000 in two zones. The scheme was eventually implemented in all the ten zones of Nagpur after receiving an encouraging response.
Waste Segregation and Storage of MSW
At present there is no segregation of waste at source. Segregation of waste is mostly done by the labours engaged in house to house collection of garbage. NMC has contracted this job to an outside agency. The garbage collected from household, street sweeping etc. is directly shifted to the dumping ground. In areas where the commercial activity continue through the day have been provided with containers. Transfer stations for intermediate storage and segregation of the collected waste are also planned at various locations within the NMC. The NMC has also established a mechanical segregation plant at Bhandewadi where the remaining segregation is done.
Transfer Stations
There are 4 transfer station locations identified and approved by the NMC. Waste generated from the municipal planning area will be collected, segregated and stored in these collection points before sending for landfill disposal. This station also provides facilities in sorting out and storing recyclable waste.
8-48
The location of the 4 proposed transfer stations are as follows:
o Jail Road
o Resham Bagh
o Sugat Nagar
o Mankapur Ghat
The allotment of land for transfer station is under process.
Processing and Disposal of MSW
The Bhandewadi compost depot is reserved in the City Development Plan, NMC 2006 for the purpose of disposal of municipal solid waste. The 54 acres land fill site is about 10km from the centre of the city. Presently about 750tons per day of municipal solid waste is transported to the dumping ground from within the NMC limits.
Following the guidelines prescribed by the SWM rules 2000, the NMC has recommended scientific method of disposal i.e. sanitary land filling at the existing landfill site in the Nagpur city sanitation plan to tackle issues of water and air pollution due to dumping of solid waste. M/s Haizer biotech energies Pvt Ltd has been appointed by NMC for the scientific disposal of the collected solid waste including treatment, processing and disposal of municipal solid waste as per the Municipal Solid Waste (handling and disposal) Rules 2000. At present about 600 tons of garbage is processed and disposed daily. Manure, green coal, bricks, and sand are produced out of the municipal solid waste. The capacity of plant is about 1,000 TPD. The land fill site for the rejected material is also under construction.
o Vermi-composting
Vermi-composting of food waste that is collected separately from commercial establishments such as hotels, restaurants, marriage halls and so on is carried out. About 8-10 tons of food waste is collected daily out of which about one-third is converted into vermi-compost. Vermi-compost is used in the NMC garden and also is open for sale. A vermin-composting plant has been setup near to the dumping site at Bhandewadi.
o Management of Bio Medical Waste
8-49
The treatment and disposal work of bio-medical waste of Nagpur city has been assigned to a private agency. In addition to indoor hospitals, dental clinics, dispensaries, blood banks, pathology laboratories, private Ayurvedic, and homeopathic colleges have also been covered under this scheme. A land admeasuring about 0.25 acre belonging to NMC has been allotted for the disposal of bio-medical waste adjoining the existing landfill site at Bhandewadi.
8.7.3 Existing landfill site
Other than the existing landfill site at Bhandewadi primarily planned for the management of MSW for the NMC area, there are no other organised land fill sites within the project area.
Management of solid waste would need attention in terms of identifying more landfill sites to handle the waste generated from the growing urban areas within the NMA including municipal areas of Kamptee and Kalmeshwar. The current efforts to manage municipal solid waste through the City Sanitation Plan within the NMC may be extended to include the NMA supported with a comprehensive solid waste management plan to include collection, segregation and transportation of waste at various stages.
8.8Key Observations
8.8.1 Water Supply
The demand for water supply is growing fast owing to the interactive effects of demographic growth, economic development, and improvements in the standard of living. Due to an increase in the population there is a constant budgetary pressure for additional resource allocation for meeting the increasing demand of water in both rural and urban areas.
In the case of NMA, the areas to the north of Nagpur city have augmented water from the River Pench and River Kanhan along with the ground water as a source for irrigation as well as domestic consumption.
Ground Water
The ground water quality in most of the areas in the NMA is good and suitable for drinking and irrigation purpose but the available data also reveals that the water quality in many of the villages in NMA is affected by the presence in excessive quantity of nitrate (NO3), chloride (Cl), fluoride (F), iron (Fe) and total dissolved solids (TDS).
Ground water quality in parts of Nagpur city is adversely affected by nitrate contamination, whereas in Kalmeshwar and Hingna MIDC areas the contamination of ground water of phreatic zone has taken place due to discharge of industrial effluents( Source: Water Quality Status of Water Bodies in Maharashtra with Recourse to Analytical/Statistical tools (2007 – 2009), MPCB).
The thermal power plants of Koradi and Kaparkheda located in the tehsil of Kamptee along with their ash ponds also result in the leaching of toxic metals from ash and contaminate the underlying soil and ultimately the ground water system.
There has been rampant extraction of Ground Water in the NMA for irrigation as well as domestic consumption. Although, as per the data available it can be said that there are currently no tehsils in the NMA which have been over exploited in terms of their ground water reserves, the pressure on the available resources will be immense with an increase in population. The ground water reserves cannot be considered a permanent source of water for meeting the requirement of an urbanizing area.
8-50
Surface Water
The surface water is supplied through Pench dam, Kanhan water works, and other small projects on River Pench, River Kanhan and River Vena to cater to the needs of the growing Nagpur Metropolis.
The current demand of the city alone is 532 million cubic meters (mcm) and is projected to be 935 mcm by 2031.
Based on the observations on the dynamics of surface water in the region and its utilization, certain sources can be considered as medium term sources that can fulfill the water requirement in the region during the development stages in addition to the existing uses and allocation from other sources. The following sources are considered as the short and medium term sources of fresh water supply for the NMA:
o Upper Vena project
o Lower Vena project
o Nirgandi project
o Akoli Barrage on Nag River
The following sources are considered as long term sources of water supply for the Metropolitan area:
o Pench Project
o Vishvasariya Barrage
Rahari Barrage
o Jamghat Project
Emerging issues
In order to sustain the water supply in the region, there is a need to adopt strong augmentation measures such as water recharge and recycling
o Inadequate storage and distribution network in most of the NMA
o Lack of public awareness regarding a depleting source of water and need for measures such as rain water harvesting and ground water recharge
8-51
o Due to the presence of the open cast coal mines the major hydrological impact is on the ground water regime of the region. The water seeping into the mine and collected in the mine sump is partly used up in the mine and the excess amount is discharged into the surface drainage system
Due to mining if groundwater systems are disturbed the possibility of serious pollution from highly saline or highly acidic water exists. Impacts may continue long after mining ceases
8.8.2 Power Supply
Due to large deposits of coal in the region, it offers an attractive location for coal-based power generation. It is estimated that coal deposits are sufficient to generate 4500 MW of power annually. The planned power generation capacity of Koradi and Khaparkheda add 1920 MW of power. The SEZ area in the MIHAN region will also have its captive power generating plant of 200 MW for assured power supply.
Nagpur will also witness an investment of Rs. 180 crore for revamping and modernising the distribution system under the Accelerated Power Development and Reform Programme. This will improve the quality and reliability of power distributed (Source: Nagpur City Development Plan prepared by the Nagpur Municipal Corporation and technically assisted by USAID and CRISIL Infrastructure Advisory under the JnNURM programme).
Emerging Issues
Electricity supply to rural areas and for agriculture related activities such as operation of the irrigation pump (IP) sets is facing issues of restricted supply and poor quality supply and large number of unmetered connections.1
The electricity supply to IP sets is highly subsidized which imposes a huge subsidy burden on the authorities and cross subsidy burden on the other consumers.
The power sector policies have been taking into account the need for power generation through renewable resources for increasing the power supply considering the limited sustainability of the source (Coal for Thermal Power plants) and to augment the demand supply gap. Nagpur has a huge potential for generating power through solar power plants. The first phase of one such unit is operational at Katol.
8.8.3 Sewerage System
The current sewerage system covers 70% of the city. Pumping and treatment facilities are inadequate; out of 345 mld, only 80 mld is collected and treated. The system is divided into three zones – North, South and Central. The situation is worse in the north zone. Less than 50% of the sewage is collected, which is disposed into the rivers without any treatment.
1Source: MERC annual report 2011-2012, pg 24, petition filed by Maharashtra Veej Grahak sangathan (Case no.81 of 2010 1)
8-52
Sewerage system of Nagpur City
The drainage function of an urban local body is related to the disposal of wastewater and storm water. This is carried out either through underground piped drains (sewers) or surface drains, which may be covered or open. Ideally, storm water drainage should be separate from the wastewater drainage system. Often the sewage flows through surface drains, which are supposed to carry storm water.
In the case of Nagpur, only 66% of the city has underground sewers. In the rest of the city, the sewage flows in open drains, which often get choked causing unhygienic conditions.
Currently, about 345 mld of sewage is generated in the city on average (as per NMC‟s estimate). It increases to 600 mld in the peak season. Of the total sewage generated, only 40 percent flows through the sewers. The rest flows through the city‟s open drains. The situation is worse in the monsoon season. Out of the 345 mld of sewage generated across the city, only a part of the flow, about 100 mld is collected and treated. This is mainly from the CSZ. Sewage from the northern and southern zones and the remaining sewage from the central zone flow into the nallahs without any treatment. This leads to extremely high levels of pollution in the water bodies of Nagpur.2
Sewerage system of NMA
The growing urban and rural areas in the fringes and within the NMA are not serviced by a proper sewerage network.
Emerging Issues
o Untreated sewage produced in the Nagpur city is directly released in the Natural drains due to an absence of a sewer network. This pollutes the rivers and streams flowing through the NMC area and other connected water bodies which are meant to carry storm water.
o Phase wise augmentation and new proposals for development of STP’s in all Sewerage zones has been proposed as per the CSP 2011. Timely realization of the proposals will help reduce pollution of surface water bodies.
o Most of the emerging urban centres and areas governed by Municipal councils in the NMA do not have an underground sewer network. The waste generated is therefore released untreated into the rivers and streams flowing through the NMA and hence polluting the water bodies.
8.8.4 Storm Water Drainage
In terms of hydrology, the total project area can be divided into Wainganga catchment and Wardha Catchment. About 70 percent of the water within the NMA drains into Wainganga through Kanhan River and its tributaries.
2Source: Draft CSP report from Nagpur Municipal Corporation (March 2011)
8-53
The city’s natural drainage pattern is excellent, with suitable topography and a natural gradient. There are two rivers – Nag and Pili and several connecting nallas running across Nagpur city. But with construction and man-made alterations, the natural system has been inadequate and needs to be supplemented by a scientific drainage system. Currently, only 30-35 percent of the roads have storm water drains. These also carry sewage and hence often get choked and flooded. Both coverage and design need to be improved.3
Emerging Issues
Within the NMA there is an absence of storm water drainage other than Nagpur city and Kamptee and Kalmeshwar Municipal councils
Despite an existing network of natural drains certain villages along Pench and Kanhan rivers experience flooding
Within the Nagpur city only 30-35 percent roads have storm water drains which carry storm as well as sewage and hence get choked and result in flooding in some areas of the city
8.8.5 Solid Waste Management
Within the Nagpur Metropolitan Area there is currently no system in place for solid waste management. The solid waste generated in the Nagpur city limits is managed at the solid waste dumping yard at Bhandewadi. The Bhandewadi site has a limited capacity and with the increase in the population of the city NMC has to take the initiative of identifying other such sites outside of city limits.
3Source: Draft CSP report from Nagpur Municipal Corporation (March 2011).