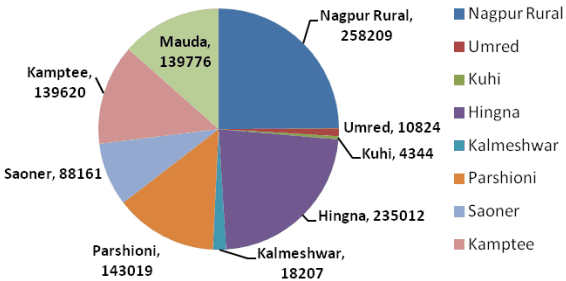
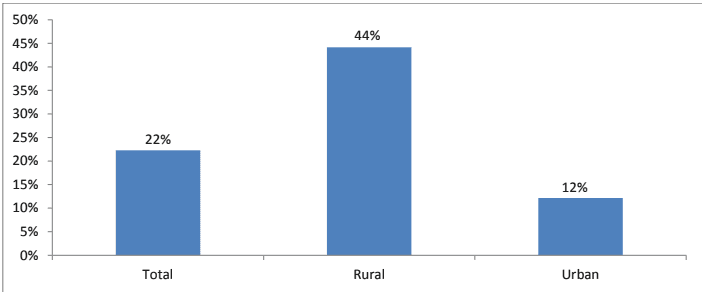
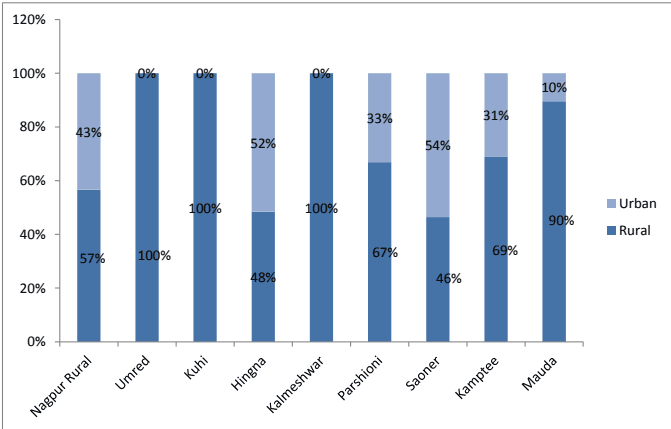
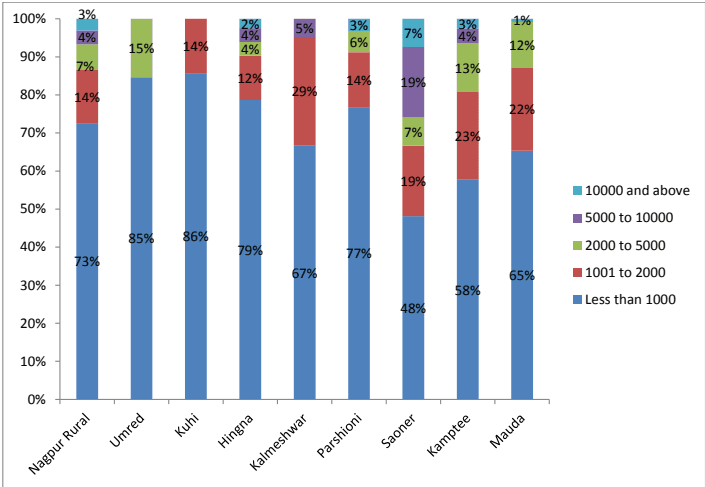
According to 2011 Census, the total population of Nagpur District is 46,53,171. This population was 40,67,637 as per 2001 Census. As per 2011 census, the population of Nagpur Metropolitan Area was 10,37,172 which is approximately 22 percent of the district’s population (Refer Annexure 6 for village wise population). Nagpur city with a population of 24,05,665 alone contributes to around 50 percent of the district’s population.
4-3
4.5.1 Decadal Growth
District growth
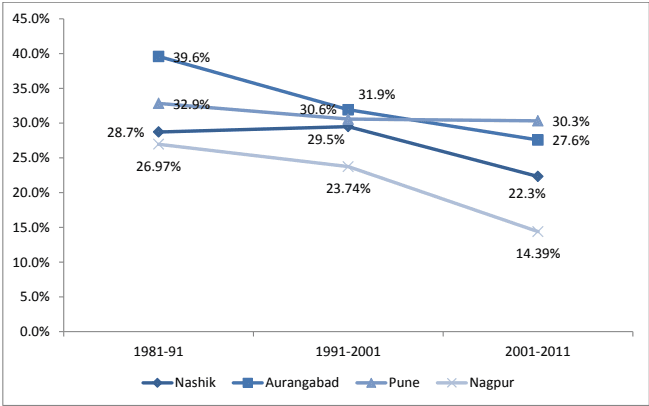
The decadal population growth rate for district was observed to be 26.95 percent between 1981 and 1991 which dropped to 23.74 percent between 1991 and 2001 and significantly dropped further to 14.39 percent between 2001 and 2011.
In order to put the growth of the district in context, we compared the growth rates of the districts of Nagpur, Nashik, Pune and Aurangabad.
Figure 4-3 : Comparative growth rates of districts
Source: Respective Census Figures, CRIS Analysis
It is evident that all 3 districts have consistently witnessed higher growth rates as compared to Nagpur. While the growth rates for all districts have declined, the decline in growth has not been as sharp as that in case of Nagpur, barring the exception of Nashik.
NMA growth
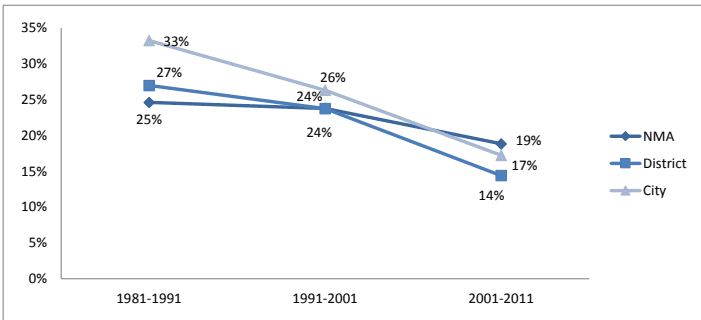
The overall population of Nagpur Metropolitan Area witnessed a growth of approximately 24.6 percent between 1981 and 1991 and 24.5 percent during 1991 to 2001 and 19 percent during 2001 to 2011. The district level figures for Nagpur are available for Nagpur district and the city
4-4
Figure 4-4: Decadal population growth-NMA
Source: 2011 Census, CRIS Analysis
Since the Nagpur City contributes 50 percent of the district’s population, the drop in its growth rates would have had implications on the growth rate of the district as well.
| Tehsil | Population | Decadal Growth Rate | |||||
| 1981 | 1991 | 2001 | 2011 | 1981-91 | 1991-01 | 2001-11 | |
| Nagpur Rural | 70,709 | 1,16,857 | 1,80,737 | 2,58,209 | 65.3% | 48.4% | 42.9% |
| Umred | 8,331 | 9,591 | 11,359 | 10,824 | 15.1% | 12.2% | -4.7% |
| Kuhi | 3,560 | 3,855 | 4,510 | 4,344 | 8.3% | 17.0% | -3.7% |
| Hingna | 76,593 | 1,04,529 | 1,85,115 | 2,35,012 | 36.5% | 61.7% | 27.0% |
| Kalmeshwar | 11,962 | 14,330 | 16,745 | 18,207 | 19.8% | 16.8% | 8.7% |
| Parshioni | 96,865 | 1,22,372 | 1,41,726 | 1,43,019 | 26.3% | 12.0% | 0.9% |
| Saoner | 54,421 | 7,1718 | 85,433 | 88,161 | 31.8% | 19.1% | 3.2% |
| Kamptee | 89,512 | 97,592 | 1,11,534 | 1,39,620 | 9.0% | 14.3% | 25.2% |
| Mauda | 83,222 | 1,05,797 | 1,35,627 | 1,39,776 | 27.1% | 25.9% | 3.1% |
| NMA | 5,42,632 | 6,76,127 | 8,72,786 | 10,37,172 | 24.6% | 24.5% | 18.8% |
| District | 25,88,811 | 32,87,139 | 40,67,637 | 46,53,570 | 26.97% | 23.74% | 14.4% |
| City | 12,19,461 | 16,24,752 | 20,52,066 | 24,05,665 | 33.24% | 26.30% | 17.2% |
Source: Respective Census, CRIS Analysis
NMA’s share across the decades has been more or less constant between 22 percent and 24.5 percent whereas Nagpur City’s share has marginally increased from 47 percent in 1981-91 to 50 percent in 1991-2001 and increased to over 50 percent between 2001 and 2011.
4-5
It is noteworthy that Nagpur city’s share in the urban population of the district was 83 percent in 1981-91 which dropped to 79 percent in 1991-2001.
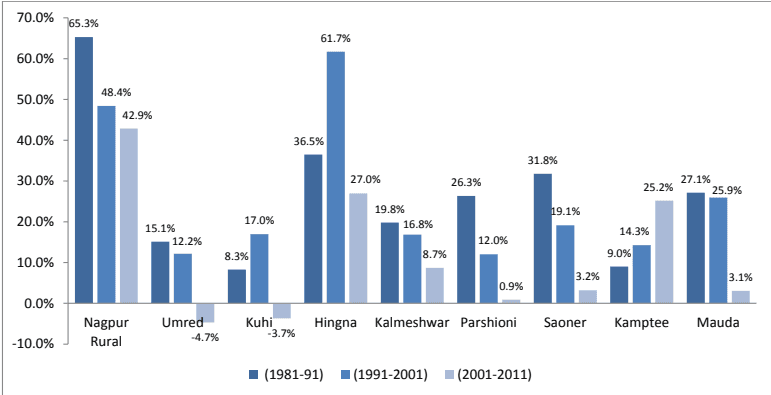
The decadal growth trends across tehsils clearly show that Nagpur Rural and Hingna tehsil which contribute highest share of the NMA population have shown higher growths as compared to the rest of the tehsils. Both these tehsils show positive growth rate. The sharp increase in Hingna’s growth could be attributed to the fact that industrial activities picked up pace the created employment opportunities which could have resulted in population influx. Between 2001 and 2011, the population in Umred and Kuhi declined by 4.7 percent and 3.7 percent respectively on account of out-migration from some of the villages.
Figure 4-5 : Tehsil-wise growth trends
Source: Respective Census, CRIS Analysis