The climate of Nagpur is dry and tropical, typical to the central part of Deccan plateau. As per the India Meteorological Department (IMD) four seasons, summer, southwest monsoon, post monsoon, and winter are observed in the region. Summer starts from March and continues up to middle June. This is followed by the southwest monsoon lasting up to September. October and November constitute the post monsoon season. Weather is generally cold during December to February. The IMD operates a meteorological station at Nagpur airport. As meteorological data is applicable for over 40 km from the location of the
3-8
station this information is considered to be representative of the climate within the NMA. The IMD data of this station for the duration 2001-2011 has been studied and presented in this chapter.
3.3.1 Temperature
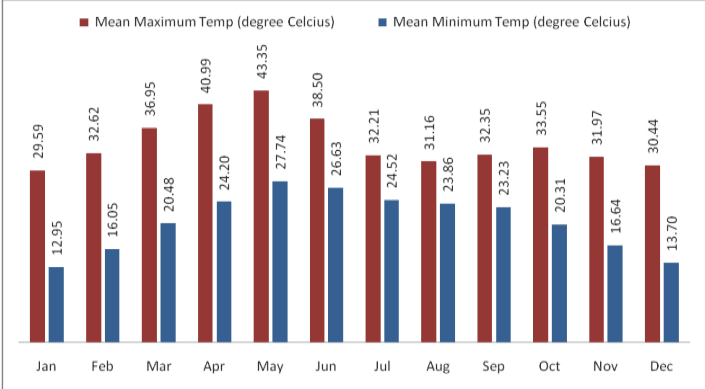
Monthly variation in temperature at Nagpur from 2001-2011 has been shown in Figure 3-6. It is clear from this table that May is the hottest month of the year with mean daily maximum temperature of about 43 Centigrade. With the onset of monsoon, temperature decreases appreciably in June but remains steady thereafter till September. During the period, the weather is generally pleasant. After monsoon, day temperature increases slightly and there is secondary maximum temperature in October. The climate becomes cool in December and continues up to February. December and January are the coldest months of the year.
3.3.2 Rainfall
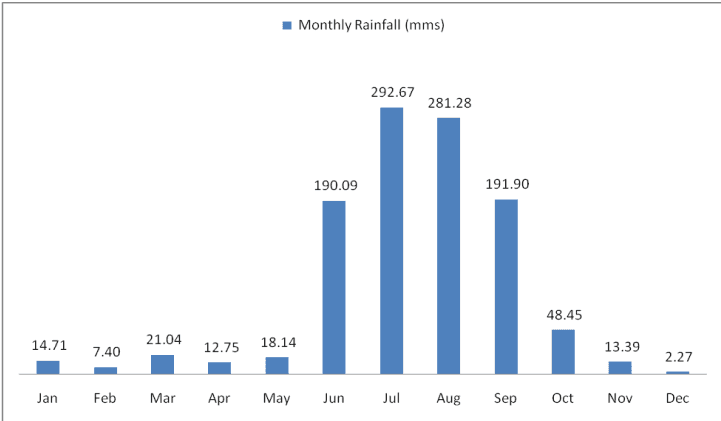
On an average the Nagpur district receives an annual rainfall of about 1,200 mm which classifies it in the moderate rainfall zone. Nagpur receives precipitation on account of both monsoons, namely southwest and northeast. The southwest monsoon occurs during June to September and northeast monsoon during October to December. Average monthly rainfall at Nagpur is shown in Figure 3-7.
As observed, July and August are the wettest months with continuous rainfall. Table 3-3 gives rainfall and number of rainy days by tehsils during monsoon. On an average there are 81.1 rainy days in a year in the NMA, of which 55.9 rainy days are in the period from June to September.
3-9
Figure 3-6 : Monthly average variation in dry bulb temperature at Nagpur
Data source: IMD data, 2001-2011
Figure 3-7: Average total monthly rainfall in the NMA (mm)
Data source: IMD data, 2001-2011
3-10
| Tehsil | June | July | August | September | ||||
| Rainfall (mm) | Rainy Days | Rainfall (mm) | Rainy Days | Rainfall (mm) | Rainy Days | Rainfall (mm) | Rainy Days | |
| Kalmeshwar | 146.9 | 11.5 | 462.3 | 16.5 | 248.0 | 14.8 | 181.7 | 10.3 |
| Kamptee | 136.7 | 17.6 | 311.4 | 17.6 | 274.6 | 17.6 | 181.9 | 11.3 |
| Kuhi | 149.1 | 10.4 | 347.8 | 17.7 | 334.5 | 17.3 | 180.9 | 11.5 |
| Umred | 139.8 | 11.1 | 340.4 | 17.2 | 335.1 | 17.4 | 161.7 | 10.3 |
| Nagpur Rural | 136.4 | 11.0 | 307.9 | 11.0 | 253.7 | 15.9 | 196.2 | 10.9 |
| Saoner | 168.5 | 11.7 | 282.0 | 17.2 | 196.0 | 14.5 | 177.2 | 9.5 |
| Parshioni | 141.7 | 11.0 | 353.4 | 19.6 | 249.2 | 16.7 | 172.9 | 12.3 |
| Hingna | 160.6 | 10.7 | 364.0 | 19.2 | 302.4 | 18.5 | 210.2 | 11.5 |
| Mauda | 169.2 | 10.3 | 277.8 | 16.5 | 229.8 | 15.7 | 155.3 | 9.1 |
Data source: IMD data, 2001-2011
3.3.3 Humidity
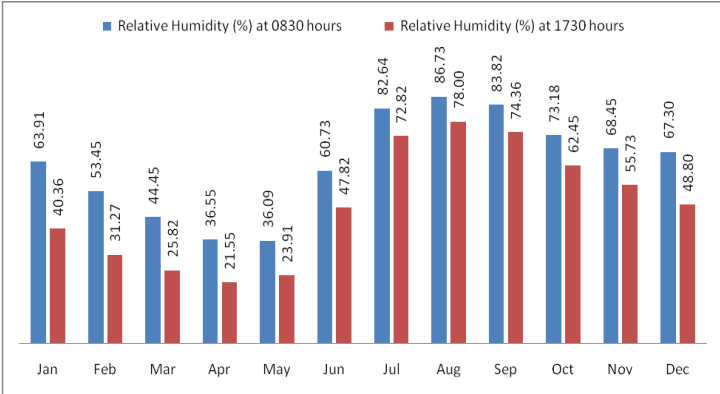
Monthly variation of humidity at Nagpur has been given in the Figure 3-8. An increase in temperature results in corresponding decrease in relative humidity and vice versa. Therefore, as observed from the figure, summer months form the driest part of the year when relative humidity is low, particularly in April and May. The climate is highly humid in monsoon, particularly in August. The average relative humidity in monsoon months goes as high as 85 percent.
Figure 3-8: Monthly average variation in relative (percent) humidity at Nagpur
Data source: Nagpur IMD observatory data
3-11
3.3.4 Cloud Cover
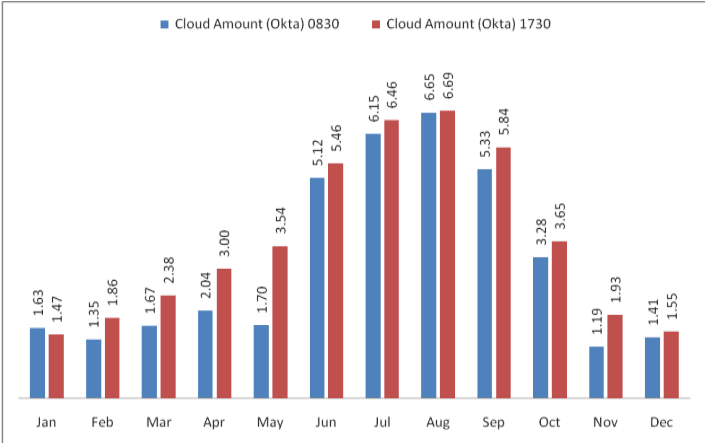
The cloud cover data for Nagpur IMD observatory is presented in Figure 3-9. As observed, the sky is heavily clouded to overcast during southwest and southeast monsoon and moderately clouded in post monsoon. During rest of the year the sky is clear or lightly clouded. Cloud cover is measured in Oktas5.
Figure 3-9: Monthly variation in cloud cover at Nagpur
Data source: IMD Metrological Station, Nagpur
3.3.5 Solar Radiation and Potential for Solar Energy Generation
India is located in the equatorial sun belt of the earth, thereby receiving abundant radiant energy from the sun. The annual global radiation in the country varies from 1,600 kWh/m2to 2,200 kWh/m2, which is comparable with radiation received in the tropical and sub-tropical regions. The equivalent energy potential is about 6,000 million GWh per year.
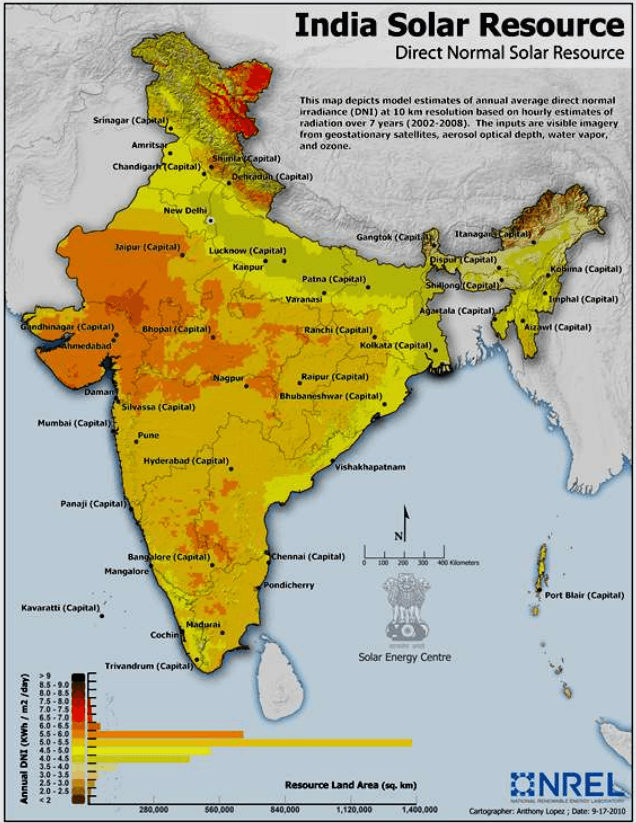
The Ministry of New and Renewable Energy (MNRE) in collaboration with the IMD has published the typical climatic data for selected radiation stations in India, including Nagpur (data from period 1986 to 2000). This is presented in Table 3-4. Also, the US National Renewable Energy Laboratory (NREL) in collaboration with MNRE has developed a map representing ‘Direct Normal Solar Irradiance in India. This is shown in Figure 3-10.
5In meteorology, an okta is a unit of measurement used to describe cloud cover. Sky conditions are estimated in terms of how many eighths of the sky are obscured by cloud, ranging from completely clear, 0 oktas, through to completely overcast, 8 oktas.
3-12
The average annual solar radiation in Nagpur is about 5.09 kWh/m2/day with more than 300 sunny days per year. Unobstructed exposure to sunlight for most or for the whole day, throughout the year is very essential in order to harness solar energy, making the NMA geographically suitable for development of solar energy resources and infrastructure. However it should be noted that parts of Gujarat, Rajasthan are more suitable than most others and the solar irradiance at Nagpur is generally within the average range observed in majority parts of India.
| S No | Station | Solar Radiant Exposure (KWh/m<sup>2</sup>/day) |
|---|---|---|
| 1. | Srinagar | 4.27 |
| 2. | Kolkata | 4.49 |
| 3. | Shillong | 4.51 |
| 4. | Ranchi | 4.55 |
| 5. | New Delhi | 5.06 |
| 6. | Mumbai | 5.06 |
| 7. | Nagpur | 5.09 |
| 8. | Vishakhapatnam | 5.13 |
| 9. | Bhopal | 5.18 |
| 10. | Ahmedabad | 5.36 |
| 11. | Chennai | 5.37 |
| 12. |
3.3.6 Wind
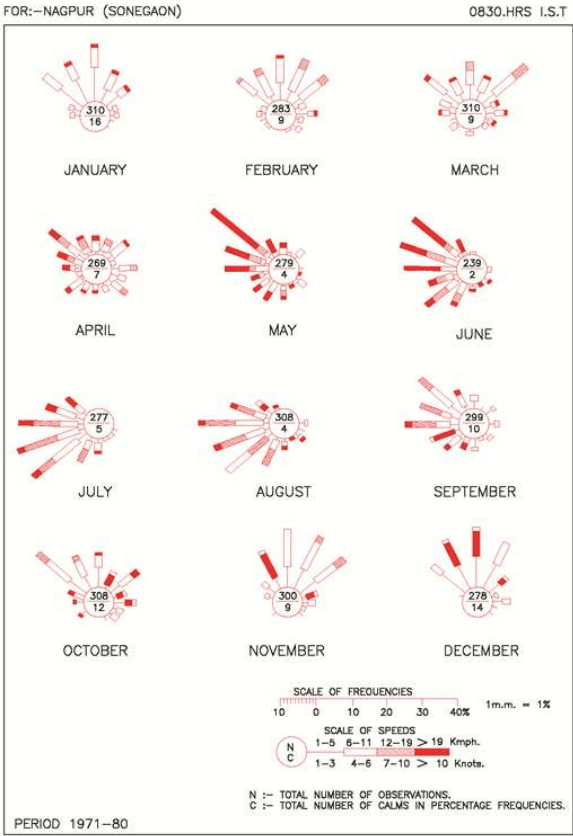
Wind velocity observed in the NMA ranges from light to moderate with some increase during the latter part of the summer and monsoon seasons. Monthly average wind speed recorded by IMD at Nagpur is presented below in the Table 3-5. The monthly wind rose diagrams showing wind persistence in various directions are shown in Figure 3-11. During this period the wind directions are mostly from southwest and northwest directions. In April, May and June winds generally blow from the northwest. During October to December, winds mainly blow from northerly and north-easterly in the forenoons and north-easterly to easterly in the afternoons. The prevailing wind direction is from north-west and north-east in the period from May to September and from west and south-west during June-July and August months. It is clear from the wind rose diagram that the dominant wind direction is North West-West to South East-East.
In the month of May and June, the climate undergoes a low pressure period resulting in the wind blowing at a speed of 20 km/h or more. But for the rest part of the year, wind speed is between 5 km/h to 6 km/h.
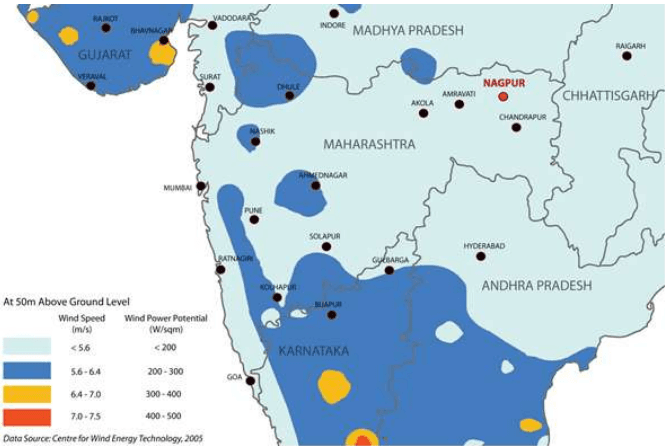
Figure 3-12 illustrates the average wind speed and wind power potential at 50 m above ground level in parts of Maharashtra. It is seen that wind power potential observed within the Nagpur region is below 200 W/m2, which does not make it a viable location for wind power generation.
| S No | Month | Average Wind Speed (km/h) |
|---|---|---|
| 1. | January | 6.6 |
| 2. | February | 7.9 |
| 3. | March | 8.5 |
| 4. | April | 9.6 |
| 5. | May | 13.4 |
| 6. | June | 14.1 |
| 7. | July | 12.0 |
| 8. | August | 11.1 |
| 9. | September | 9.5 |
| 10. | October | 7.6 |
| 11. | November | 7.2 |
| 12. | December | 6.4 |
Source: IMD metrological station, Nagpur
3-15
Figure 3-11 : Monthly wind-rose diagram
3-16
3.3.7 Air Quality
The Maharashtra Pollution Control Board (MPCB) is responsible for monitoring air quality in the region. This is being done as part of National Air Monitoring program (NAMP), through independent institutes who directly report to the Central Pollution Control Board (CPCB). The CPCB has six sanctioned NAMP stations in Nagpur. National Environmental Engineering Research Institute (NEERI) and Vishveshwarya National Institute of Technology (VNIT) are the responsible implementation agencies for air quality monitoring at 3 stations each. Table 3-6 presents the air quality of these six stations for 2006-2008.
As observed from the above air quality monitoring data, the levels of S O 2 and N O X are well below the National Ambient Air Quality Standards (NAAQS) at all the monitoring locations for 2011, 2012 and 2013. Not much difference is observed in the trends of concentration of these parameters. However, the levels of Respirable Suspended Particulate Matter (RSPM) are exceeding the prescribed limits at most of the locations with some exceptions. It may be mentioned that out of these monitoring stations only one monitoring station (MIDC office, Hingna Road) falls in NMA. Other locations are within the Nagpur city.
3-17
| Location | MIDC Office, Hingna Road, Nagpur | Govt. poly technique College, Nagpur | Institution of Engineers, North Ambazari Road, Nagpur | RO Office Premises, Civil Lines, Nagpur | |
| Type of Land Use/Year/Parameters | Industrial | Rural & other areas | Residential | Residential | |
| 2011 | |||||
| SO2 | 10 | 9 | 9 | 9 | |
| NOX | 36 | 30 | 34 | 27 | |
| RSPM | 106 | 80 | 86 | 57 | |
| 2012 | |||||
| SO2 | 11 | 10 | 11 | 9 | |
| NOX | 40 | 36 | 38 | 30 | |
| RSPM | 132 | 86 | 96 | 54 | |
| 2013 | |||||
| SO2 | 11 | 7 | 10 | 9 | |
| NOX | 34 | 34 | 31 | 24 | |