This chapter presents population and employment projections for the NMA and the distribution of this future population in the targeted growth areas. Together, population and employment distribution provide the basis for spatial allocations for land and infrastructure, which are addressed in the next chapter 13, Planning Proposals.
The approach adopted for population projections seeks to derive key takeaways from the macro demographic trends at national, state, district and NMA levels. Analysis of the population growth drivers has been undertaken to understand the key contributors to population growth. Further, to analyse migratory trends, assessment of directional migration is undertaken which will provide insights into whether there is net rural to urban migration.
Six different methods of population projections, a comparative analysis of these methods and choice of method for NMA’s population projection exercise is presented. Furthermore, three different growth scenarios are considered for the chosen method.
12.5Comparison of Population Projection Methods and Choice of Method
12.5.1 Comparison of Various Methods
A comparative table of the population projections for 15 years and 25 years period, by the different methodologies explained below is given in Table 12-10. The population projections for 2027 ranges from 13.20 lakhs to 15.67 lakhs while that for 2037 ranges from 14.40 lakhs to 19.69 lakhs.
Table 12-10Comparison of results of different population projections methods
Year
Cohort Component Method
Geometric Rate Of Increase Method
Arithmetical Projections Method
Incremental Increase Method
6 Percent Migration Rate (Business as usual scenario)
Each of the above-explained methodologies has its own limitations and advantages. The population projection methodologies have been summarised along with their pros and cons in Table 12-11.
Table 12-11Population projections methods - pros and cons
Model Examples Pros Cons TrendArithmetic Increase Minimum Data Points Its simplicity is its ExtrapolationIncremental Increase Required drawback MethodsGeometrical Method Simplistic in its application Assume a continuation of Exponential Applicable to shorter time base period trends Power Logistic period 2- 5 years Polynomial functions prone to rapid increases or rapid decreases
Cohort Component Model
Net Migration Rates
Comprehensive Model Suitable for longer projection periods
Data intensive Assumptions driven
The appropriate model for population projection for NMA region is the Cohort Component Model for the following reasons:
The time period for population projections is 15-25 years. For such a long projection-period, the trend extrapolation methodology is not appropriate as these methods are more applicable for periods below five years.
The limitation imposed by the Cohort Component model is that it is assumptions driven. The three parameters that influence cohort component model are birth rates, mortality rates and net migration rates. Two of the three factors will vary gradually over the next two-three decades. This is because the
12-10
Replacement Rate in the region is around 2.4 and closer to the population stabilisation rate of 2.1. With literacy rates about 85 percent, the fertility rates will also tend to decline with time as there is a well-established correlation between the two. With life expectancy nearing 70 years, its increase in the forthcoming years will be very gradual thereby its contribution to the population growth will be of lesser magnitude in the past. These demographic changes also make the trend extrapolation methodologies for population projections inappropriate for the NMA region.
The Cohort Component Method is thus adopted for reasons mentioned above as the preferred population projection scenario for the NMA.
12.5.3 Growth Rate for the NMA and Conclusion on Population Projections
Given the increasing economic activities in NMA, NIT has adopted accelerated growth that is 30 percent growth rate scenario for the population projections of NMA. This means that population projections for 2032, 2027 and 2037 by Cohort Component Methodology and 30 percent growth rate is about 15 lakhs, 17 lakhs and 19 lakhs respectively.
The population projections fixed for the NMA for the Development Plan are given in Table 12-12 (all numbers are rounded).
Table 12-12Population projections fixed for the NMA for the Development Plan
S No
Year
NMA population
1
2011 Census
10,33,577
2
2012 (Base year)
10,60,000
2
2027
15,00,000
3
2032
17,00,000
4
2037
19,00,000
It is important that the economic environment is conducive for growth and can provide the necessary impetus to allow for higher population growth. The analyses for the economic environment and employment projections for the NMA is presented below in 12.6.
12.6Employment Projections
Based on the demographic and economic analysis of the NMA, employment projections have been worked out for primary, secondary and tertiary sector. The projections have been carried out based on all the migration scenarios. However, based upon the selected 30 percent scenario for population growth, it is projected that employment generation will also be for the corresponding rate of 30 percent. Employment projections for 6 percent, 8 percent, 15 percent, 20 percent and staggered rate are presented in Annexure 10.
12.6.1 Employment Projections for Migration Rate of 30 Percent
It is estimated that with 30 percent migration rate, the total employment within the three sectors will be 6,20,964 by 2032; by 2062 this number is expected to reach 11,92,165. The population growth will be buoyant over the next 50 years since the economy will latch on to an extremely high growth trajectory and will result in higher number of people migrating to the region which will result in the replacement rate of population going rapidly and hence will provide for more number of people in the employable age.
12-11
The employment in the primary sector will be approximately 32 per cent of the total employment; employment in the secondary sector will be 27 per cent while the tertiary sector will have 42 per cent of the total employment in 2032.
The employment in the primary sector will be approximately 7 per cent of the total employment; employment in the secondary sector will be 41 per cent while the tertiary sector will have 53 percent of the total employment in 2062.
Table 12-13Employment projections for 30 percent migration rate
Year
2001
2012
2022
2032
2042
2052
2062
Total Working
Population
5,00,457
6,83,62136.6
8,87,52029.8
10,77,12421.4
13,02,88621.0
15,56,86619.5
18,69,72220.1
Decadal Growth percent
percent
percent
percent
percent
percent
percent
Jobs as per cent of
58
54
55
58
59
63
64
working population
percent
percent
percent
percent
percent
percent
percent
Total Jobs across sectors
(A+B+C)
2,90,550
3,17,063
3,48,580
3,77,433
3,94,097
3,92,933
3,81,166
Primary Sector (A)
1,61,984
1,97,458
2,18,116
1,97,260
1,45,464
1,07,269
79,103
Secondary Sector (B)
55,929
75,163
1,11,260
1,64,692
2,43,784
3,60,860
4,84,966
Manufacturing
43,160
58,003
81,820
1,11,031
1,48,494
2,00,534
2,44,210
Utilities
6,208
6,474
6,793
7,417
8,076
8,215
9,458
Construction
6,560
10,686
22,647
46,244
87,215
1,52,111
2,31,297
Tertiary Sector (C)
72,638
97,619
1,59,011
2,59,012
3,83,400
5,15,258
6,28,097
Wholesale and retail
trade and restaurant and
hotels
2,760
3,710
6,042
9,842
14,569
19,580
23,868
Transport, Storage and
Communication
11,549
15,521
25,283
41,183
60,961
81,926
99,867
Financing, Insurance,
Real Estate, and Business
Services
11,477
15,424
25,124
40,924
60,577
81,411
99,239
Community, Social and
Personal Services
46,851
62,964
1,02,562
1,67,062
2,47,293
3,32,341
4,05,122
Source: CRIS analysis
The employment in the primary sector will be approximately 32 percent of the total employment; employment in the secondary sector will be 27 percent while the tertiary sector will have 42 percent of the total employment in 2032. Under this scenario, the diversification of the economy will happen at very high rate and the proportion of people employed in the secondary and tertiary sector individually would be higher than the primary sector.
12-12
12.3Analysis of Demographic Trends
12.3.1 Understanding Macro Trends in Population Growth
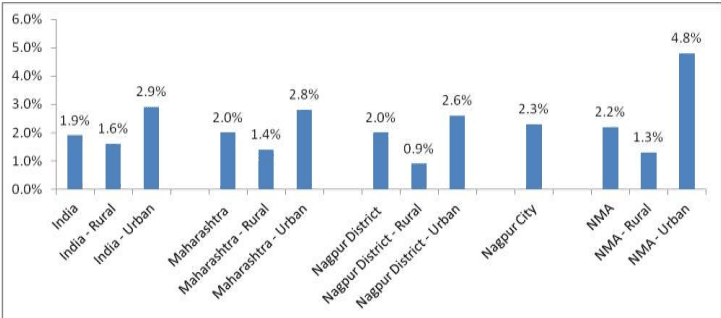
To understand overall macro demographic trends, an analysis was carried out of the overall growth trends in total, rural and urban population at the national, state, district and NMA levels. This assessment provides an insight into where the growth is coming from and how does NMA fare.
12-1
Figure 12-1 : Growth trends for national, state, district, and NMA between 1981 and 2001
Source: Respective Census’ and CRIS Analysis
As is evident, the growth in the country’s population has demonstrated a stabilizing trend between 1981 and 2001 and has grown at a rate of 1.9 percent. The rural growth in the country has been recorded at 1.6 percent, while the urban growth has been recorded at 2.9 percent. This is the first time in the history of the country’s Census that urban growth has been higher than rural growth. This indicates that there is net rural to urban migration.
Maharashtra state has grown, between 1981 and 2001, at a rate similar to the country’s growth rates. In line with the national trends, the rural growth has been recorded at 1.4 percent which is almost half of the urban growth rate of 2.8 percent.
For the same period, Nagpur district has grown at a rate similar to the national and state level of roughly 2 percent. The most striking feature of Nagpur district’s growth is that the rural areas have grown at a rate of merely 0.9 percent which is far lower when compared with the national as well as state level rural growth numbers. This clearly indicates that rural areas are not offering enough incentives for people to continue subsisting there. The urban areas in Nagpur district have grown at a rate slightly lower than the national and state level at 2.6 percent. This is, however, largely in line with trends observed at the national and state level.
For the period between 1981 and 2001, the NMA has grown at a rate similar to the national, state as well as district level. The rural growth in the NMA has been largely in line with the national as well as state trends where it has grown at 1.3 percent. The urban growth in NMA is recorded to be 4.8 percent which is far higher than the national, state as well as district trends. It might lead one to believe that the NMA is rapidly urbanizing. However, the strong growth figures for NMA urban areas are on account of reclassification of rural areas as urban areas which has significantly impacted the overall urban population figures within NMA.
12.2Base Year and Plan Period
The Declaration of Intent for preparation of the Development Plan as per the provisions of the MRTP Act, 1966 was made in June 2012, which is considered as the base year for the Plan. The population of the NMA as per Census 2011 is about 10.3 lakhs (10,37,172). Population for 2012, calculated based upon the Census 2011 numbers projected at the current growth rate, is about 10.9 lakhs.
The Development Plan for the NMA is prepared for 20 years; that is year 2032, which is referred to as the ‘plan period’. Based on the guidelines set by the Directorate of Town Planning, Maharashtra State, land zoning allocations are made for 25 years, which is year 2037; whereas provision of social and physical infrastructure (allocation of land for public purposes) is made for 15 years, which is year 2027.
Population projections are hence presented for all three years: 2027, 2032 and 2037
12.4Population Projections Using Various Methods
Projections are conditional statements about the future. They refer mostly to the exercises of extrapolation of the past trends into the future. There are different methodologies for undertaking a population projection exercise. These methods are based on certain assumptions about future fertility, mortality, net migration, inter-state mobility, living arrangement type and labour force participation patterns of the population. Four different methods of population projections, a comparative analysis of these methods and choice of method for NMA’s population projection exercise is presented under this part. The methods considered are:
Geometric rate of increase
Arithmetic
Incremental increase
Cohort component
12.4.1 Geometric Rate of Increase
Geometric extrapolation corresponds to the assumption that a population increases constantly by numbers proportionate to its changing size. In this case, the computation is carried out in the same manner as a computation of compound interest. A population increasing by a geometric rate is computed by the formula:
P n = P ₀ (1 + r) t
Where,
P 0 is the population at the beginning of a period,
t is the period of time in years
r is the annual rate of increase, and
P n is the population at the end of the period
If the rate of increase is to be determined from a comparison of census results, it can be found by the formula:
(1 + r) = t ₁ √ P ₂ / P ₁
Where
P1 and P2 are the populations according to first and second census respectively
t1 is the time interval between the two census years
This method is mostly applicable for growing towns and cities having vast scope for expansion. The population projections for NMA using this method are given in Table 12-3.
12-4
Table 12-3Population projections by geometric rate of increase method
12.3.2 Determinants of Population Growth
In order to understand the growth drivers contributing to the population growth, the key components of population growth were analysed. The same have been outlined below:
12-2
Table 12-1General trends in population growth across the past five decades
S No
Census Year
Natural (percent)
New Towns (percent)
Expansion in urban areas (percent)
Net Migration (percent)
1
1971
64.6
13.8
2.9
18.7
2
1981
51.3
14.8
14.2
19.6
3
1991
61.3
9.4
7.6
21.7
4
2001
59.4
6.2
13.0
21.0
5
2011
48.3
13.7
14.0
24.0
Source: Census of respective years, Indian Institute of Housing Studies (IIHS) and CRIS Analysis
The growth of population over the years was largely driven by natural growth which was as high as 65 percent in 1971, reclassification of towns contributed 14 percent to the growth in population, only 3 percent contribution was from expansion in existing urban areas; migration contributed 19 percent of the growth in 1971.
However, by 2011, the dynamics of growth were altered greatly. Natural growth contributed 48 percent of the total population growth, new urban areas (reclassified from rural to urban) contributed 14 percent which is almost double of what they contributed in 2001, expansion of existing urban areas contributed to growth in similar proportion to the new urban areas in 2011. Net migration contributed 24 percent to the population growth which indicates that migration from rural to urban areas has grown significantly.
12.3.3 NMA Population Growth Drivers
Based on the analysis presented under the previous part, an attempt was made to understand the population growth drivers for NMA. The below table summarizes the growth drivers and their impact on the population growth in NMA.
Table 12-2General trends in population growth across the NMA for the past five decades
S No
Growth Driver
Observed in the NMA
Remarks
1
Natural Growth
Yes
Major growth driver
2
Expansion in area
No
Limits have been same
3
Migration
Yes
Marginal growth
4
New Towns
Yes
Major growth driver
5
Natural Growth
Yes
Major growth driver
Applying the inferences of the analysis from the previous part, it becomes apparent that natural growth of population is a major population growth driver. The expansion of limits in existing urban areas has not been observed within the NMA. This implies that the expansion in urban areas as a population growth driver has not impacted the population growth.
Migration which has become a major growth driver as observed from the overall national trends has not been significant in case of NMA. Only 6 percent of the population growth between 1991 and 2001 could be attributed to migration. Furthermore, reclassification of rural areas into urban areas appears to be a major growth driver for the NMA since the other growth drivers, with the exception of natural growth, have clearly not been contributing to NMA growth.
12-3
Given the above inferences, it can be safely deduced that the higher urban growth is not migration induced and is rather a result of reclassification of rural areas into urban areas.
S No
Year
Population projected
1
2012
11,04,776
2
2017
12,38,898
3
2022
13,89,302
4
2027
15,57,966
5
2032
17,47,106
6
2037
19,59,208
12.4.2 Arithmetic Method
This is a simple method of extrapolation that computes the average annual number by which the population has increased from once census to the next, and to add an equal number for every year which has elapsed since the last census. It should be noted that a constant numerical increase in a growing population really implies a diminishing rate of growth relative to population size. It can be calculated by the formula:
Pn = P0 + (Average yearly increase in population) × number of years
Where
P n = projected population
P 0 = Base year population
Average increase in population = (w+x+y+z)/40
Increase in population in last 10 years = w
Increase in population in last 10 to 20 years = x
Increase in population in last 20 to 30 years = y
Increase in population in last 30 to 40 years = z
This method is generally applicable to large and old cities. The population projections for NMA using this method are given in Table 12-4.
Table 12-4Population projections by arithmetic method
S No
Year
Population projected
1
2012
10,96,448
2
2017
11,83,909
3
2022
12,75,735
4
2027
13,63,481
5
2032
14,54,985
6
2037
15,42,948
12.4.3 Incremental Increase Method
In this method the increment in arithmetical increase is determined from the past decades and the average of that increment is added to the average increase. This method increases the figures obtained by the arithmetical increase method. This method is computed by the formula:
P n = P ₀ + n ∗ x + (n (n + 1) / 2) ∗ Y
12-5
Where,
Pn is projected year population
n= number of periods
x=Average increase of population of known decades
Y=Average of incremental increases of the known decades
With this method, the population projections for NMA are as given in the Table 12-5.
Table 12-5Population projections by incremental increase method
S No
Year
Population projected
1
2012
11,03,168
2
2017
12,28,119
3
2022
13,68,655
4
2027
15,31,675
5
2032
17,13,627
6
2037
19,15,024
12.4.4 Cohort Component Method
The cohort component population projection method follows each cohort of people of the same age throughout its lifetime according to its exposure to mortality, fertility, and migration. Starting with a base population by sex and age, the population at each specific age is exposed to the chances of dying as determined by projected mortality levels and patterns by sex and age. Once deaths are estimated, they are subtracted from the population, and those surviving become older. Fertility rates are projected and applied to the female population in childbearing ages to estimate the number of births every year. Each cohort of children born is also followed through time by exposing it to mortality.
Most importantly, the component method takes into account any in-migrants who are incorporated into the population and out-migrants who leave the population. Migrants are added to or subtracted from the population at each specific age. The whole procedure is repeated for each year of the projection period, resulting in the projected population by age and sex, as well as birth and death rates, rates of natural increase, rates of population growth, and other summary measures of fertility, mortality, and migration for each year.
Four scenarios have been developed for population projections of NMA for the period of 2012 to 2032. The purpose of this is to create a lower as well as a higher ceiling of population growth that is likely to be observed in NMA, in order to allow for appropriate planning policies to be developed for the NMA’s growth. The assumptions as well as the results from the scenarios have been discussed under the following parts.
Table 12-6Migration rate scenarios for population projections
S No
Scenario
Migration Rate
Remarks
1
Low Growth/Business as usual
6 percent and 8 percent
This low growth scenario assumes that the population in the NMA would grow as it has grown in the past.
2
High Growth
10 percent, 15
The high growth scenario assumes higher migration
12-6
S No
Scenario
Migration Rate
Remarks
percent and 20 percent
rates as compared to the business as usual case.
3
Accelerated Growth
30 percent
The accelerated growth scenario uses a very high migration rate assuming that the economy will grow at an accelerated pace.
4
Staggered
Gradual increase in the migration rate
The Staggered scenario assumes growing migration rates, growing slowly in the initial years and increasing significantly in the long terms.
Table 12-7Population projections by cohort component method
Year
Business as usual case
Strong Growth
Accelerated Growth
Staggered Growth
6%
8%
10%
15%
20%
30%
Gradual Increase in rates
2012
1,052,223
1,052,223
1,052,223
1,052,223
1,052,223
1,052,223
1,052,223
Migrati on rate
2017
1,130,828
1,133,820
1,136,812
1,137,693
1,149,329
1,172,602
1,139,191
10%
2022
1,205,451
1,211,969
1,218,510
1,234,579
1,263,924
1,323,968
1,241,333
15%
2027
1,265,780
1,274,570
1,283,413
1,334,923
1,385,613
1,491,926
1,356,239
20%
2032
1,323,420
1,336,218
1,349,134
1,433,793
1,511,069
1,676,953
1,483,400
20%
2037
1,376,918
1,393,943
1,411,182
1,520,737
1,632,473
1,876,258
1,592,262
20%
12.4.4.1 Low Growth and Business as Usual Case
The current population growth analysis for Nagpur reveals that the growth of population due to migration is to the extent of 6 percent. It is assumed that the migration rates would continue the same over the period of projections that is till 2062.
With a migration rate of 6 percent, the population for NMA is expected to be around 1.27 million by the year 2027, 1.32 million in 2032 and 1.38 million in 2037. The population is expected to grow by 1.44 times to reach to 1.50 million in 2062 from the current level of 1.03 million.
With a migration rate of 6 percent, it is expected that 8,02,232 people will require employment by the year 2032 and 8,16,819 people will require employment by the year 2042. The population requiring employment would be 7,48,235 in 2062.
The decline in number of jobs required to be created is on account of the fact that over the period of projections, the median age of the population would increase, the population would start ageing since the replacement of population will not happen rapidly.
12.4.4.2 Strong Growth
Migration rates of 10 percent, 15 percent and 20 percent have been assumed with the premise that the NMA region would demonstrate marked improvements in economic and social conditions with incremental investments being made in the region and would thereby boost the attractiveness of the region; the region would continue to grow at the same rates (for each of the growth rates assumed) through the projections
12-7
period. The Table 12-8 outlines the number of persons likely to be seeking employment for each of scenarios assumed.
With a migration rate of 10 percent, the population for NMA is expected to be around 1.28 million by the year 2027, 1.35 million in 2032 and 1.41 million in 2037. The population is expected to grow by 1.52 times to reach to 1.57 million in 2062 from the current level of 1.03 million.
With a migration rate of 15 percent, the population for NMA is expected to be around 1.33 million by the year 2027, 1.43 million in 2032 and 1.52 million in 2037. The population is expected to grow by 1.83 times to reach to 1.9 million in 2062 from the current level of 1.03 million.
With a migration rate of 20 percent, the population for NMA is expected to be around 1.39 million by the year 2027, 1.51 million in 2032 and 1.63 million in 2037. The population is expected to grow by 2.15 times to reach to 2.23 million in 2062 from the current level of 1.03 million.
The significant increase in the job creation requirement is on account of the fact that with strong migration rates, the replacement of population will happen at a faster rate, the median age will not be impacted significantly and that the ageing of the population will be minimized.
12.4.4.3 Accelerated Growth
Migration rate of 30 percent has been assumed with the premise that the efforts of the state as well as local actors would catalyse the economic development of the region and would spur large migration which will have a significant impact on the population growth in the region; the region would continue to grow at the same rate through the projections period.
With a migration rate of 30 percent, the population for NMA is expected to be around 1.49 million by the year 2027, 1.68 million in 2032 and 1.88 million in 2037. The population is expected to grow by 2.93 times to reach to 3.04 million in 2062 from the current level of 1.03 million.
Under this scenario, it is expected that 10,77,124 people will require employment by 2032 and 1,302,886 people will require employment by 2042. The population that will require employment by 2062 would be 18,69,722. It is evident that the job creation will almost double between 2032 and 2062. This is on account of the fact that with accelerated migration rate, the replacement of population will happen at a faster rate, the median age will not be impacted significantly and that the ageing of the population will be minimized.
12.4.4.4 Staggered Growth
Variable migration rates (6 percent to 30 percent) have been assumed with the premise that the region would latch on to a growth path slowly in the initial years as investments are made in the region as well as in developing infrastructure; growth would peak sometime around the middle of the projections period and would consolidate and stabilize from thereon.
The population estimated under this scenario is expected to be around 1.36 million by the year 2027, 1.48 million in 2032 and 1.59 million in 2037. The population is expected to grow by 2.05 times to reach to 2.13 million in 2062 from the current level of 1.03 million.
With the staggered growth scenario, it is expected that 9,25,062 people will require employment by 2032 and 10,49,454 people will require employment by 2042. The population that will require employment by
12-8
2062 would be 14,20,389. This significant increase in the job creation requirement is on account of the fact that with varying migration rates, the replacement of population will happen at a faster rate, the median age will not be impacted significantly and that the ageing of the population will be minimized.
Table 12-8Working population across migration rates and its relevant share in overall population
Migration rate
10 percent
15 percent
20 percent 30 percent
2012
6,83,621
6,83,621
6,83,621
percent share
65 percent
65 percent
65 percent
2022
7,75,304
8,17,875
8,40,731
percent share
64 percent
66 percent
67 percent
2032
8,18,243
9,17,859
9,68,486
percent share
61 percent
64 percent
64 percent
2042
8,40,049
10,15,911
11,04,927
percent share
57 percent
63 percent
63 percent
2052
7,98,397
10,82,201
12,23,951
percent share
52 percent
61 percent
61 percent
2062
7,76,407
11,74,288
13,75,826
percent share
49 percent
62 percent
62 percent
Source: CRIS Analysis
12.4.4.5 Summarizing Results of the Three Key Scenarios
The projections have been calculated under the Cohort Component Method assuming different migration rates or scenarios as shown in the Table 12-9.
Table 12-9Population projections by cohort-component method
S No
Year
8 Percent Migration Rate
Staggered Migration Rate
30 Percent Migration Rate
1
2012
10,96,007
10,97,044
11,03,404
2
2017
11,79,160
11,89,305
12,32,916
3
2022
12,56,388
12,96,683
13,91,569
4
2027
13,20,503
14,17,068
15,67,357
5
2032
13,83,050
15,44,165
17,60,177
6
2037
14,40,647
16,59,452
19,69,318
7
2042
14,89,398
17,86,643
21,98,085
8
2047
15,28,896
19,05,320
24,25,714
9
2052
15,57,731
20,34,640
26,51,510
10
2057
15,72,363
21,29,885
29,24,556
11
2062
15,78,767
22,06,741
31,76,047
The first scenario is the ‘business as usual’ scenario that utilizes the current migration rate of 8 percent.
The second scenario is the staggered growth scenario that utilizes increasing migration rates starting from 10 percent in the decade of 2011-2021, gradually increasing to 30 percent in the decade 2041-2051 and then remaining at 30 percent for the next decades.
The third scenario is the accelerated growth scenario that assumed a constant migration rate of 30 percent.