12.3.1 Understanding Macro Trends in Population Growth
To understand overall macro demographic trends, an analysis was carried out of the overall growth trends in total, rural and urban population at the national, state, district and NMA levels. This assessment provides an insight into where the growth is coming from and how does NMA fare.
12-1
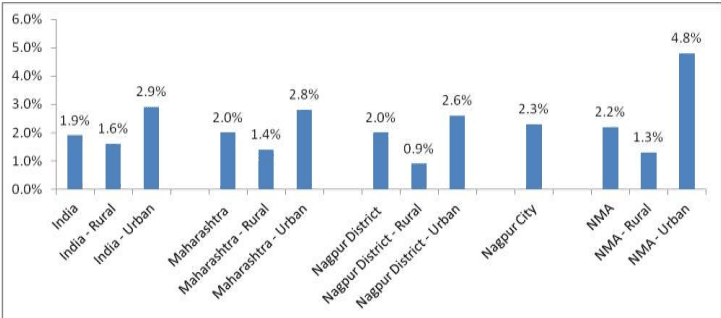
Figure 12-1 : Growth trends for national, state, district, and NMA between 1981 and 2001
Source: Respective Census’ and CRIS Analysis
As is evident, the growth in the country’s population has demonstrated a stabilizing trend between 1981 and 2001 and has grown at a rate of 1.9 percent. The rural growth in the country has been recorded at 1.6 percent, while the urban growth has been recorded at 2.9 percent. This is the first time in the history of the country’s Census that urban growth has been higher than rural growth. This indicates that there is net rural to urban migration.
Maharashtra state has grown, between 1981 and 2001, at a rate similar to the country’s growth rates. In line with the national trends, the rural growth has been recorded at 1.4 percent which is almost half of the urban growth rate of 2.8 percent.
For the same period, Nagpur district has grown at a rate similar to the national and state level of roughly 2 percent. The most striking feature of Nagpur district’s growth is that the rural areas have grown at a rate of merely 0.9 percent which is far lower when compared with the national as well as state level rural growth numbers. This clearly indicates that rural areas are not offering enough incentives for people to continue subsisting there. The urban areas in Nagpur district have grown at a rate slightly lower than the national and state level at 2.6 percent. This is, however, largely in line with trends observed at the national and state level.
For the period between 1981 and 2001, the NMA has grown at a rate similar to the national, state as well as district level. The rural growth in the NMA has been largely in line with the national as well as state trends where it has grown at 1.3 percent. The urban growth in NMA is recorded to be 4.8 percent which is far higher than the national, state as well as district trends. It might lead one to believe that the NMA is rapidly urbanizing. However, the strong growth figures for NMA urban areas are on account of reclassification of rural areas as urban areas which has significantly impacted the overall urban population figures within NMA.
12.3.2 Determinants of Population Growth
In order to understand the growth drivers contributing to the population growth, the key components of population growth were analysed. The same have been outlined below:
12-2
| S No | Census Year | Natural (percent) | New Towns (percent) | Expansion in urban areas (percent) | Net Migration (percent) |
| 1 | 1971 | 64.6 | 13.8 | 2.9 | 18.7 |
| 2 | 1981 | 51.3 | 14.8 | 14.2 | 19.6 |
| 3 | 1991 | 61.3 | 9.4 | 7.6 | 21.7 |
| 4 | 2001 | 59.4 | 6.2 | 13.0 | 21.0 |
| 5 | 2011 | 48.3 | 13.7 | 14.0 | 24.0 |
Source: Census of respective years, Indian Institute of Housing Studies (IIHS) and CRIS Analysis
The growth of population over the years was largely driven by natural growth which was as high as 65 percent in 1971, reclassification of towns contributed 14 percent to the growth in population, only 3 percent contribution was from expansion in existing urban areas; migration contributed 19 percent of the growth in 1971.
However, by 2011, the dynamics of growth were altered greatly. Natural growth contributed 48 percent of the total population growth, new urban areas (reclassified from rural to urban) contributed 14 percent which is almost double of what they contributed in 2001, expansion of existing urban areas contributed to growth in similar proportion to the new urban areas in 2011. Net migration contributed 24 percent to the population growth which indicates that migration from rural to urban areas has grown significantly.
12.3.3 NMA Population Growth Drivers
Based on the analysis presented under the previous part, an attempt was made to understand the population growth drivers for NMA. The below table summarizes the growth drivers and their impact on the population growth in NMA.
| S No | Growth Driver | Observed in the NMA | Remarks |
|---|---|---|---|
| 1 | Natural Growth | Yes | Major growth driver |
| 2 | Expansion in area | No | Limits have been same |
| 3 | Migration | Yes | Marginal growth |
| 4 | New Towns | Yes | Major growth driver |
| 5 | Natural Growth | Yes | Major growth driver |
Applying the inferences of the analysis from the previous part, it becomes apparent that natural growth of population is a major population growth driver. The expansion of limits in existing urban areas has not been observed within the NMA. This implies that the expansion in urban areas as a population growth driver has not impacted the population growth.
Migration which has become a major growth driver as observed from the overall national trends has not been significant in case of NMA. Only 6 percent of the population growth between 1991 and 2001 could be attributed to migration. Furthermore, reclassification of rural areas into urban areas appears to be a major growth driver for the NMA since the other growth drivers, with the exception of natural growth, have clearly not been contributing to NMA growth.
12-3
Given the above inferences, it can be safely deduced that the higher urban growth is not migration induced and is rather a result of reclassification of rural areas into urban areas.