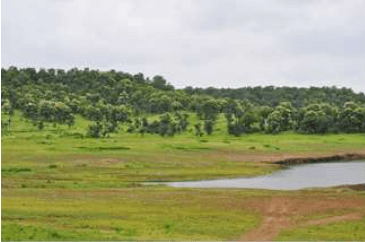
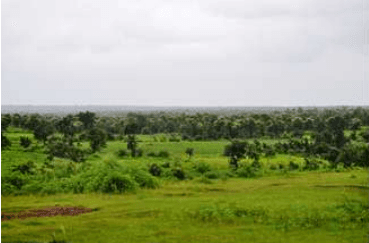
More than 60 percent area of the NMA is under agriculture. Predominantly covered by black cotton soil the region is suitable for agriculture. Around 71 percent of total geographical area of Nagpur is cultivable, crops are grown on 79 percent area of total cultivable area, and balance is fallow land.
3.5.1 Cropping seasons
Depending on rains, there are three cropping seasons, namely (1) Kharif (early monsoon from June to September) (2) Rabi (late monsoon from September to December) and (3) Zaid (from January to May) in a year.
Kharif crops include cotton, jowar, bajra, tur, kulthi, mung, udid, chawali, groundnut, till, sugarcane, chillies. Rabi crops include wheat, jowar, grain and sunflower. Groundnut and mung are generally Zaid crops. Vegetables are grown throughout the year.
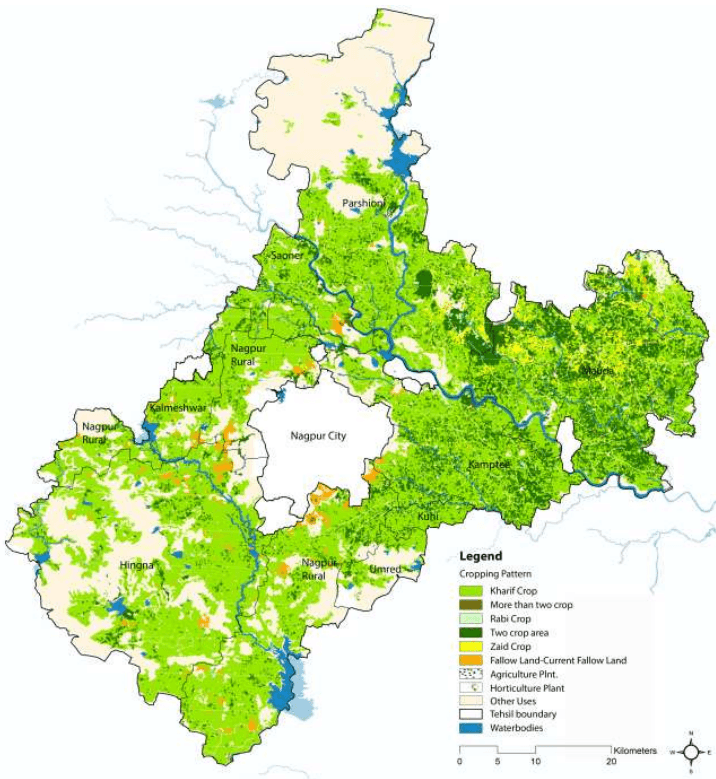
The broad cropping pattern in the NMA has been shown in the Figure 3-15. Most of the cultivated land in NMA is un-irrigated area dependent on monsoon rainfall. As observed, the major crops grown in NMA area are rice, jowar, cotton and wheat. Pulses and oilseeds are also grown in NMA. Mostly orange cultivation dominates among the plantations.
3.2Geology
3.2.1 Geomorphology
Geomorphologically, the NMA can be divided into two parts - the region west of Nagpur city occupied by the Deccan trap formation and the region east of Nagpur city occupied by the metamorphic and crystalline series. The other two formations found in the region are the Lametas and the Gondwanas. These two formations found only along the junction of the trap are crystalline.
Geologically, crystalline rocks of Archean age, sedimentary rocks of Permian age and alluvium of recent age underlie the NMA area. Almost all the major geological formations starting from ancient crystalline rocks in the north and east to volcanic flows of Deccan trap in the west and south are presented in the area. Besides these, there are relatively younger sedimentary rocks, which are coal bearing.
3-2
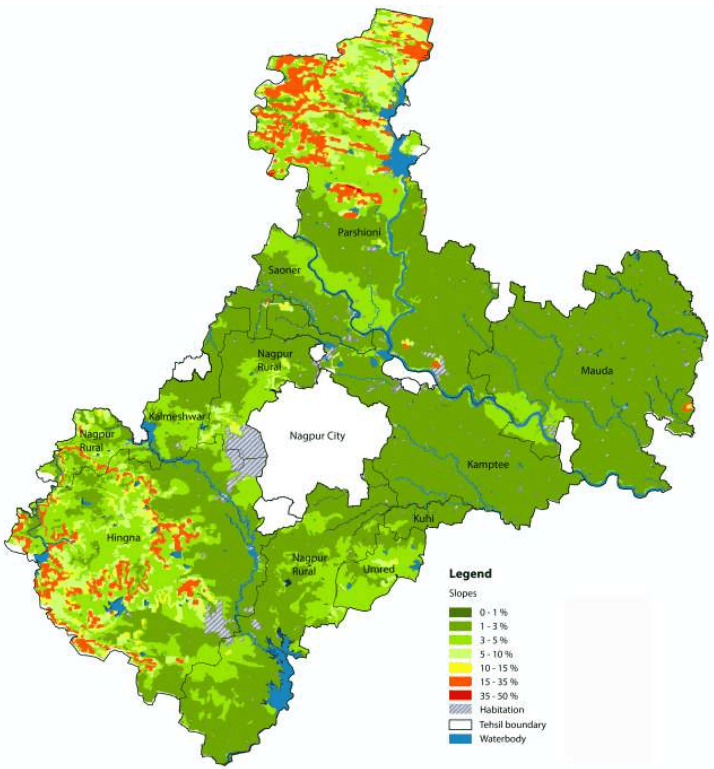
Figure 3-1: Slope in the NMA
Data source: MRSAC; Map prepared by Halcrow
3-3
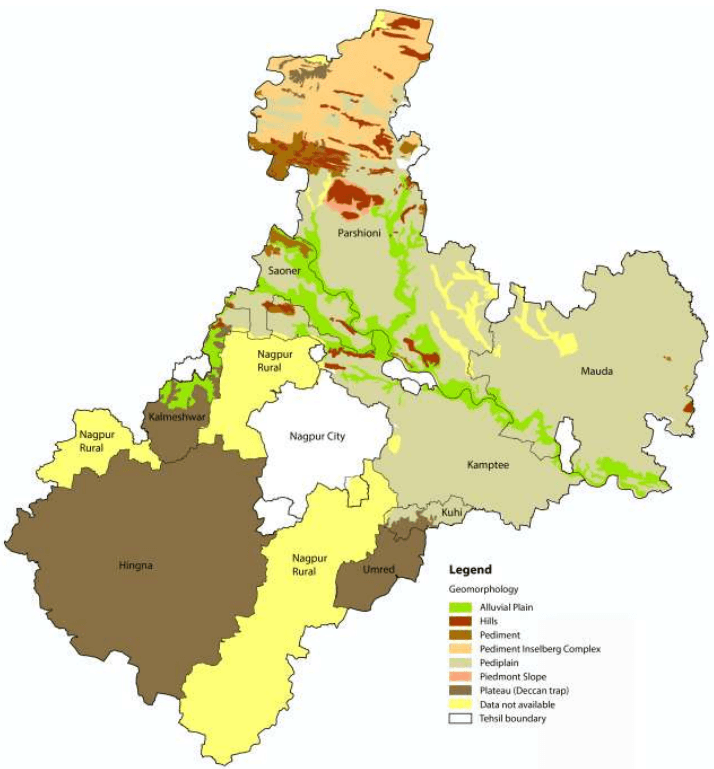
Figure 3-2: Geomorphology in the NMA
Data source: MRSAC; Map prepared by Halcrow
3-4
3.2.2 Soil Type and Textures
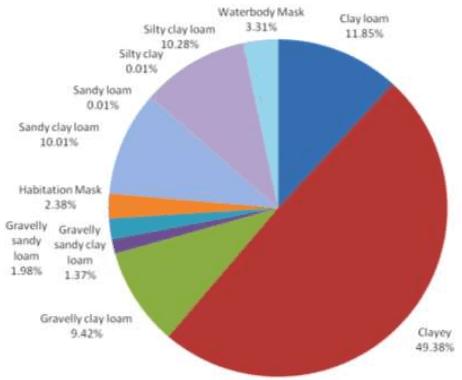
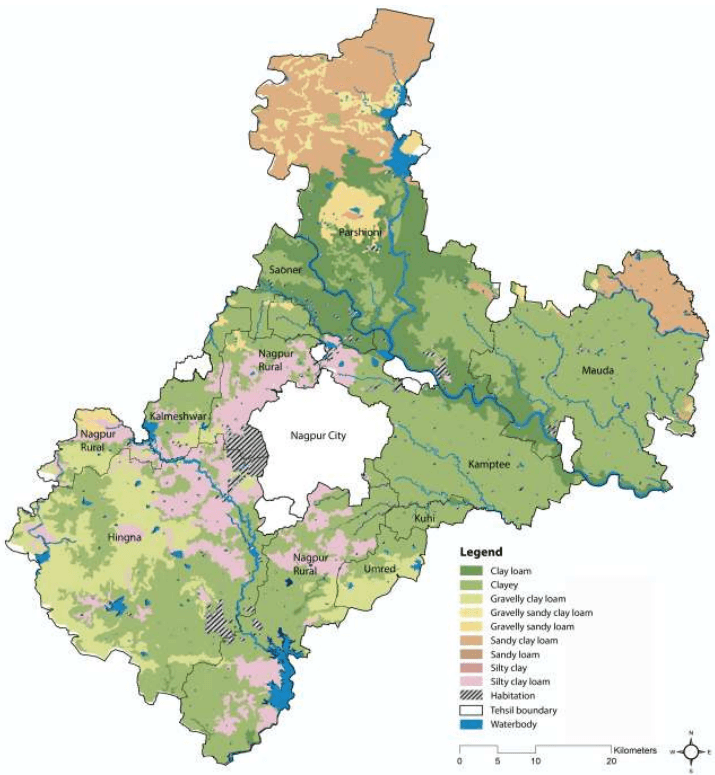
Soils in the NMA represent black cotton soils of the Deccan traps formed from the cotton soil modified by intermixtures with soil derived from the gneissic formation that surrounds it. The black colour in the soil is generally due to the presence of organic matter and iron, alumina, lime, magnesium, potash, phosphorous and nitrogen. This black cotton soil determines to a large extent the nature of the agriculture or cropping pattern in the area. Figure 3-3 shows the land share by soil textures and Figure 3-4 shows the soil textures within the NMA.
The major soil types are moderately alkaline in nature with pH ranging 8.0 to 8.5 covering the central, eastern, south eastern and southern parts of the district. The soils in NMA have medium to very high water holding capacity and moderate to very high erodibility. Majority of land within the NMA is cultivable, however it exhibits limitations in the level of productivity at many locations due to low soil depth and poor irrigation facilities. Towards the east of the district, the underlying rock is crystalline and yields to sandy soil that is more suitable for irrigation.
As observed, there is a high concentration of clayey loam along the periphery of the Kanhan and Pench rivers. The extreme north of NMA, which is the forest region of Parshioni, consists of Sandy Clay Loam for the most part. There is a large concentration of Silty clay loam to the east and south-east of the city limits. The largest share among all soil types is occupied by clayey soil (about 50 percent).
Figure 3-3: Land share by soil texture
3-5
Figure 3-4: Soils in the NMA
Data source: MRSAC; Map prepared by Halcrow
3-6
3.2.3 Rocks and Minerals
Industrial minerals and rocks found in various geological formations of the district are tabulated below in the Table 3-2.
Table 3-2Useful rocks and minerals in different geological formations
Geological formations
Minerals and rocks of economic value
Soil
Brick clays and kankar
Deccan basalts
Building material (dolerite and basalts),ornamental stones and ochres
Lameta
Building material, limestones
Kamthis
Building material, abrasives and clays
Barakar
Coal and clays
Talchirs
Nil
Archaean Rocks
Abrasives; building material; ores of copper, manganese, lead and tungsten; limestone; ornamental stones and clays
Source: District Gazette of Nagpur
Geologically the area comprises rock formations ranging from Archean to recent ages. The central portion of the district comprises of Granulites, granitic gneisses, Migmatic gneisses with calc-silicates, Quartzites, Ultramafics and Amphibolites of Archean to Paleo proterozoic age. The Sausar group of Meso Proterozoic age covers the northern part with Schists, intercalated quartzite, calc-gneiss; quartzite, muscovite; crystalline limestone and dolomite. Coal seems to occur in the Barakar formations underlying the Kamptee formations.
Lameta beds of Cretacous age are exposed between northwest of Nagpur and south of Umred as disconnected patches. Almost half of the district is occupied by Deccan traps with 60 m thick pile of basaltic flows of Cretacous to Paleozoic age. At places, inter trappings (sedimentary) beds separate individual flows. Alluvial deposits of Pleistocene to recent age are found along Vena and Kanhan rivers. Important coal deposits are located in Kamptee and Umred. Clay deposits associated with rocks of Kamptee formation are located near Nagpur. Almost half of the study area is covered by basalt and associated lavas.
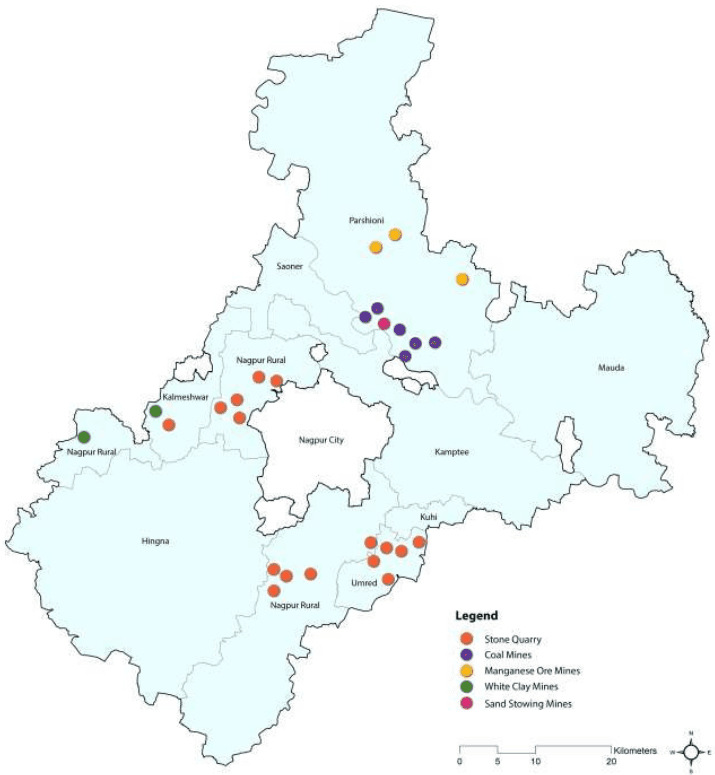
Currently, minerals such as manganese, coal, white clay and sand (stowing) are mined within the boundaries of the NMA, in Parshioni, Saoner, Kalmeshwar and Nagpur rural tehsils. Figure 3-5 illustrates the locations where existing mining operations are being carried out in the NMA.
3-7
Figure 3-5: Minerals of the NMA
Source: District Resources Map, Geological Survey of India
3.7Biological Environment
3.7.1 Forests
Nagpur has received recognition as the second greenest district in India. Table 3-11 presents the forest cover in the state and district. As observed, 20.45 percent (2,023 sqkm) of total geographical area is classified as forests in Nagpur, higher than the State’s percentage. Around 47 percent of total forest area in Nagpur District falls under moderately dense forest, followed by open forest. Very dense forest classification constitutes only 18 percent of the total forest area.
Table 3-11Forest Cover in 2007
State/District
Geographical Area (sqkm)
Forest Cover (sqkm)
Percentage of Geographical Area
Scrub
Very dense Forest
Mod. dense forest
Open forest
Total
Maharashtra
3,07,713
8,739
20,834
21,077
50,650
16.46
4,157
Nagpur
9,892
372
953
698
2,023
20.45
77
Source: India State of Forest Report, 2009, Forest Survey of India
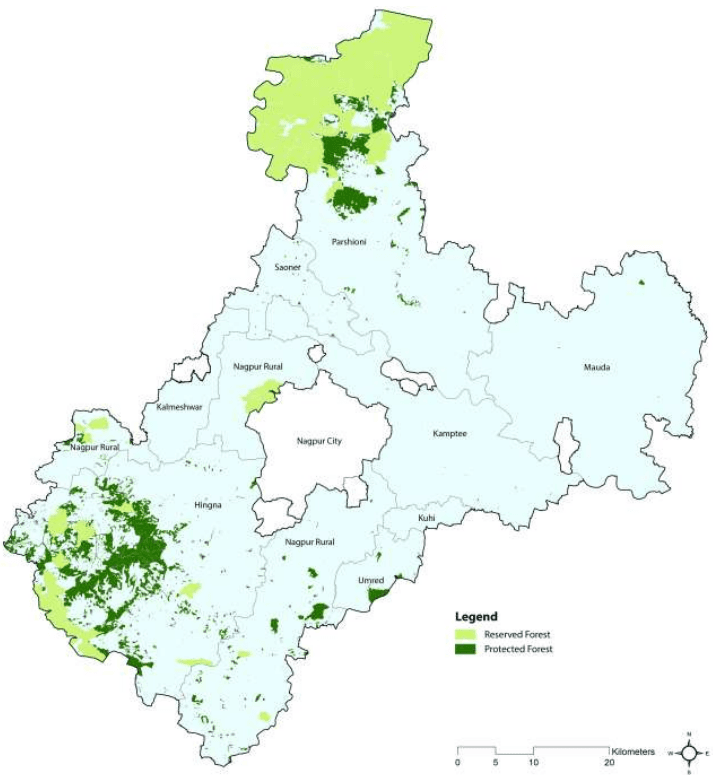
Within the NMA, majority forest land (Reserved and Protected forests) is at the northern side of the NMA in Parshioni tehsil. At the southern portion of the NMA, forests are located in south-west Hingna, parts of Nagpur Rural and Umred (see Figure 3-19). About 14.5 percent of the NMA is covered by Forest land.
3-30
At few places the forest areas are degraded and in some places barren rocky/ stony waste with scrubs are noticed and observed towards the north. The type of forests in NMA belongs to southern tropical dry deciduous classification. Zudpi Jungles are observed at scattered locations all over the NMA.
Figure 3-19: Forests in the NMA
Data Source: Forest Department, Revenue records. Map prepared by Halcrow
3-31
3.7.2 Flora and Fauna
Parts of the NMA, particularly the portions surrounding the Pench reserve are known to be rich and diverse in wildlife from the earliest records available since the 16th century. The scenic beauty and the floral and faunal diversity of the Central Indian Highlands have been well documented by the British since the late 17th century.
3.7.2.1 Flora
Due to fair amount of rain in the region, the slopes of the hills around Nagpur are well covered by plant species such as Tectona grandis, Hardwickia binata, Gardenia lucida, G. resinifera. The small hills have a few trees of Anogeissus latifolia, Terminalia paniculata, Flacourtia ramonchi, Diospyros melahoxylon, etc. These species shed their leaves completely in the hot season, which is prolonged. The species here develop mixed deciduous forest. In the summer months, grasses and other herbaceous vegetation get charred and dry up due to which the hillocks look barren. The soils in the hilly area are quite shallow but fertile. The forest mainly consists of dry deciduous species. A wide variety of small trees, herbaceous plants and shrubs are also observed in the area.
3.7.2.2 Fauna
The project area harbours common rural species. The avifauna includes jungle fowl, partridge, sand grouse, and quail. Common Indian reptiles are reported. Nagpur is also referred to as ‘Tiger Capital of the World’.
3.7.3 Protected Areas
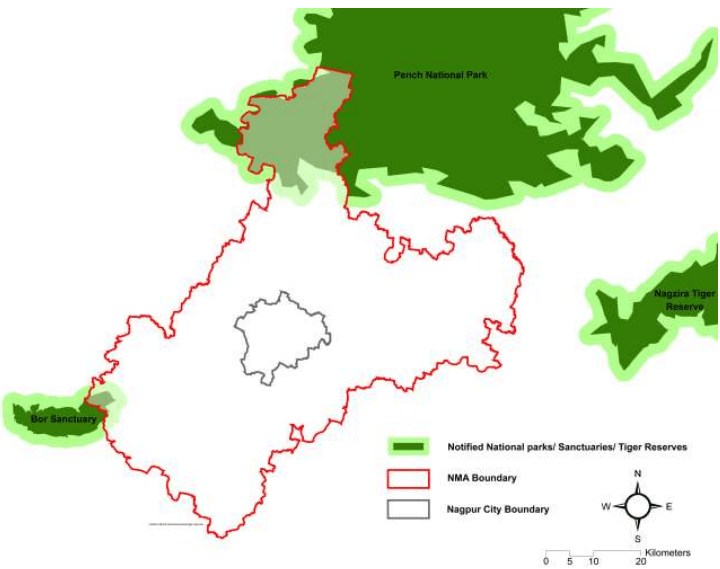
Protected areas within the NMA include part of the Pench National Park at north of the project area and part of the Bor sanctuary at south side which actually falls within Wardha district of the State (see Figure 3-20).
Pench National Park is located on the border of Madhya Pradesh and Maharashtra, which is at a distance of 70km from Nagpur City. The area notified under the National Park covers 257.26sqkm. It is covered with the southern tropical dry deciduous forest. Pench National Park comes under the Project Tiger network for special reserves and is one of the 39 tiger reserves in the country (Source: National Tiger Conservation Authority, MoEF). Tiger, panther, gaur, sambar, chital, barking deer, blue bull, macaque, langoor, wild boar, bear, wild dogs and civet cat are the wild animals that are found in this National Park. This undulating terrain is covered with small hills, steeply sloping on the sides.
Bor Wildlife Sanctuary is located at Hingni in Wardha district, Maharashtra. A part of this sanctuary falls within NMA. The sanctuary covers an area of 61.10 sqkm. It includes 3,237 ha Reserved Forest, 2,213 ha Protected Forest, and 660ha of Unclassified Forest. Bor Wildlife Sanctuary is covered with southern mixed dry deciduous forest. Teak, ain, tendu and bamboo are the main species of flora in this sanctuary. Tigers, panthers, bisons, blue bulls, chitals, sambars, peacocks, barking deers, chinkara, monkeys, wild boars, bears and wild dogs are the important fauna of the sanctuary.
3-32
Figure 3-20: Protected areas – Pench National Park and Bor Sanctuary
The above graphic is for indicative purposes only. Data Source: Halcrow Research, Google Earth
3.4Water Resources
3.4.1 Surface water
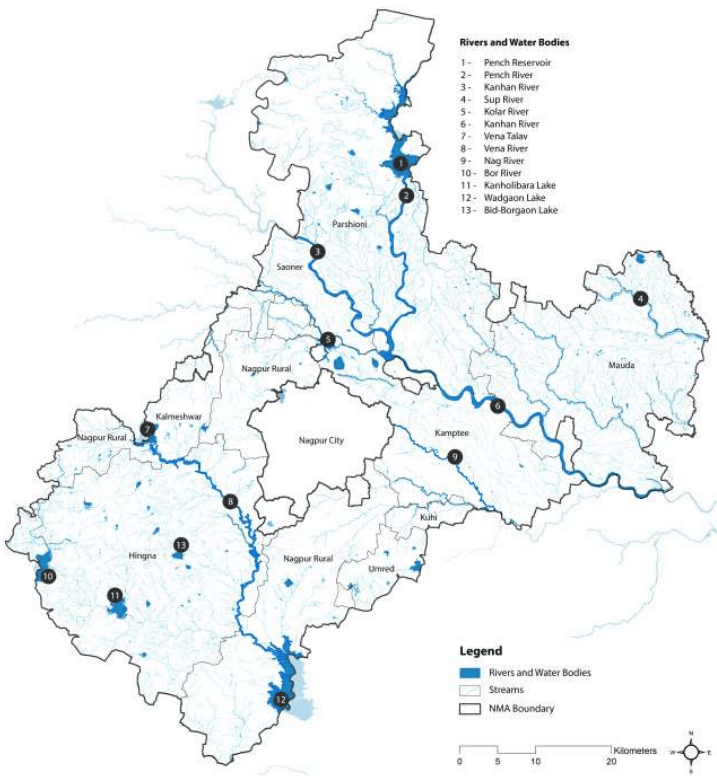
The NMA is drained by the Kanhan and Pench rivers in the centre, the Wardha in the west, and the Wainganga in the east. Both Wardha and Wainganga rivers later merge as Pranahitha, tributary of Godavari River. The area has a natural slope in two directions. The upper portion slopes from north to southeast and lower portion has slopes from south west to southeast. Due to the slope in dual direction and because of presence of many nallahs and rivers the total project area has excellent natural drainage pattern.
Approximately 70 percent of the NMA drains into River Wainganga through Kanhan River and its tributaries. Tributaries of Kanhan that drain from project area are Pench, Chandra Bagha, Nag, Pilli and Kanhari. Rivers Bawanthari, Surgay Mukhi drains directly into Wainganga River. Southwest portion of the NMA drains into River Wardha through Vena, Bor and Amghat. Figure 3-13 illustrates surface water resources of the NMA.
Though the topography of NMA provides an excellent natural drainage pattern, some areas are susceptible to water logging during heavy rains. Information sought through local enquiry has affirmed the same. Heavy downpour in year 2010 at regular intervals had inundated many low‐lying areas. A similar situation is reported almost every year after heavy rains. However, the NMA has not witnessed floods since 1994.
3-19
Figure 3-13: Surface water resources of the NMA
Data source: NIT, Survey of India Topographic Sheets; Map prepared by Halcrow
3-20
3.4.2 Ground Water
As the area is mostly covered by Deccan traps, unclassified gneisses, granites, sandstones and shales, the underground aquifers are mostly due to secondary porosity and fractures in the rocks. The yields range between 1 to 5 litres/sec in the NMA.
Ground water is available from both confined and unconfined aquifers. Dug wells generally tap upper shallow aquifer and whereas bore wells tap both upper shallow and deep aquifers. Previous studies indicate that the water levels in the area range from 400m below ground level (BGL) in the north to 250m BGL in the east. In general the groundwater flow direction in the entire area is towards east. Few areas around Kamptee, Saoner, Mauda and to the south of Hingna are identified as favourable for the tapping of groundwater in the area. The water table depth variation in the region during different seasons is given in Table 3-7.
Chapter 3Physical Features and Natural Resources
3.1 Topography and Landscape
The NMA exhibits topographical features that of the Nagpur district. The area has an average elevation between 350 m and 260 m above sea level (Survey of India topographical map). Its relief features are characterised by the residual hill ranges of the Satpudas and their detached members, enclosing undulating black soil valleys between them. The topography is typical of the Deccan traps1 having flat-top and terraced features, low buttressed sides, and isolated knolls. The landscape changes eastwards and north-eastwards due to the change in the underlying rocks. The greater part of the NMA is an undulating plateau. The terraced landscape of the Deccan lavas on the west has several flat-topped hills well-furrowed on their sides by streams. In the north, the upland ranges are an extension of the Satpuda ranges; these are narrow in the west but widen to a breadth of about 19 km (twelve miles) towards east. South of this upland range stretch the Ambegad hills. Major landforms observed in the region are Pediplain2, Inselbergs 3 and Piedmont zone4in the northern part of the NMA area. Valley fills exist in the north-west to south-east direction. Few highly dissected areas are noticed towards the south.
Landforms of the NMA (Source: Halcrow)
1 A large igneous province located on the Deccan Plateau of west-central India
2 Broad, relatively flat rock surface formed by the joining of several pediments (a gently inclined erosion surface carved into bedrock)
3 A residual relief feature – an isolated hill, knob, ridge or small mountain that rises abruptly like an island from a gently sloping or virtually level surrounding plain
4 Area at or near the foot of a mountain
3-1
Figure 3-1Figure 3-1 shows the slope within the NMA. As observed, more than 90 percent of the project area ranges within 0-3 percent slope. Northern and the south-western parts have a steeper slope as compared to the rest of the NMA in the range of 10-35 percent. Table 3-1 presents a summary of percent slopes in the NMA.
3.8Environmental challenges in the NMA
3.8.1 Impact of Mining Activities
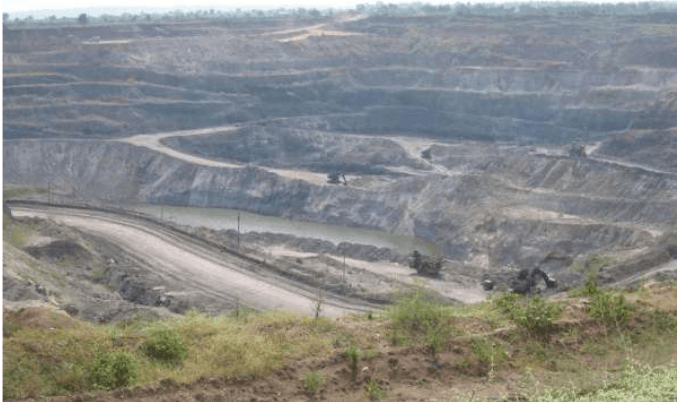
At present, about 26 sqkm area of the NMA is under mines and quarries, of which about 16 sqkm is only under mines. The minerals mined in the NMA include Coal and Manganese through open cast mines. Mining operations like drilling, blasting, extraction, transportation, crushing and other associated activities are carried out in underground and opencast mines. Mining operations damage the environment and ecology to an unacceptable degree, unless carefully planned and controlled.
Air pollution and water pollution are some of the major areas of concern due to mining operations within the NMA, apart from other environmental degradation issues. The Coal Mines Committee has visited the Coal Mines area under the Chairmanship of Deputy Speaker of Maharashtra Legislative Assembly. They have chalked out various plans to combat environmental degradation due to mining activities. MPCB has taken stringent action against the non-complying mines. Directions are issued to the various coal mines for implementing the environmental standards. It is seen that due to constant persuasion from the Board and efforts of WCL/Mines Authority, air quality in this area is improving. (Source: Nagpur District Environment Report, 2004)
3-33
Figure 3-21: Open cast coal mine in the NMA
3.8.1.1 Impact on Air Quality
Air pollution in mines is mainly due to the fugitive emissions of particulate matter and gases including methane, sulphur dioxide, oxides of nitrogen and carbon monoxide. Most of the mining operations produce dust.
The major operations producing dust are drilling, blasting, hauling, loading, transporting and crushing. Basically, dust sources in mines can be categorized as primary sources that generate the dust and secondary sources, which disperse the dust and carry it from place to place called as fugitive dust.
Opencast mining is more severe an air pollution problem in comparison to underground mining. High levels of suspended particulate matter increase respiratory diseases such as chronic bronchitis and asthma cases while gaseous emissions contribute towards global warming besides causing health hazards to the exposed population. The uncontrolled dust not only creates serious health hazard but also affects the productivity through poor visibility, breakdown of equipment, increased maintenance cost and ultimately deteriorates the ambient air quality in and around the mining site. The dust can also pollute nearby surface waters and stunt crop growth by shading and clogging the pores of the plants. Besides polluting the environment, the generation of dust means the loss of fines, which act as road surface binders.
3.6Vulnerability to Disasters
3.6.1 Seismicity
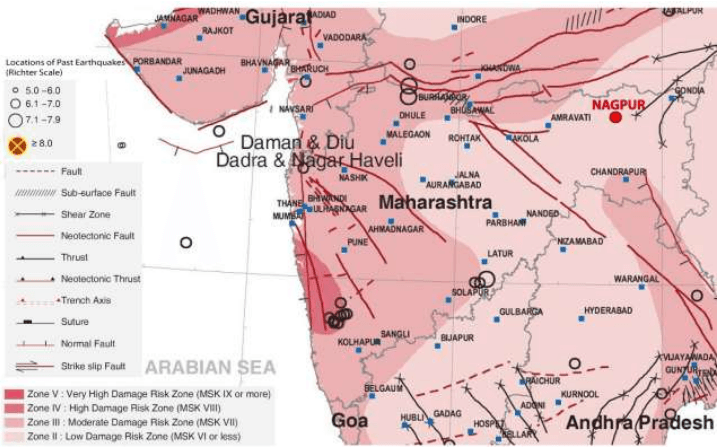
As per the 2002 Bureau of Indian Standards (BIS) map, Maharashtra falls in Zones II, III & IV. Historically, parts of the State have experienced seismic activity in the Magnitude (M) 6.0-6.5 range.
Figure 3-16 (see page 3-27) shows seismic vulnerability atlas for Maharashtra prepared by the Building Materials and Technology Promotion Council (BMTPC). As observed from the figure, Nagpur falls under Zone II which is classified as low damage risk zone/low hazard zone.
According to the Earthquake Disaster Management and Control Action Plan of Nagpur District prepared in 1993, two regions IA and IB (Wainganaga and Wardha river basins), have been identified as prone to geoseismic activities like river channel migration and consequent floods, liquefaction, river bank failures and consequent structural destruction and ground shaking and fissuring.
3-25
Figure 3-15: Cropping pattern in the NMA
Data source: MRSAC; map prepared by Halcrow.
3-26
Figure 3-16: Earthquake Vulnerability in Maharashtra
Source: Building Materials and Technology Promotion Council Vulnerability Atlas (Second Edition – Based on the Digitised data of SOI, GOI; Seismic Zones of India Map IS: 1893-2002, BIS, GOI; Seismotectonic Atlas of India and its Environs, GSI, GOI)
Building codes, land use regulations and zoning are implemented partially only in the urban areas. With more land being converted from agriculture use to urban uses, application of relevant building safety standards with regard to seismic hazards is crucial in the NMA.
Except for minor seismic activity, a major earthquake has not occurred in Nagpur district so far. The recent earthquake tremors experienced by Nagpur is provided in Table 3-10. The Deccan Plateau was considered to be seismically stable zone, but the occurances of Latur earthquake in 1993 and the Jabalpur earthquake in 1997 have raised doubts about this. During Jabalpur earthquake Nagpur District recorded tremors of the magnitude of 4.2 on the Richter scale. Most of the recent studies and observations suggest the need for rezoning and consider parts of Deccan Plateau with active faults as prone to geo-seismic hazards.
3.3Climatology
The climate of Nagpur is dry and tropical, typical to the central part of Deccan plateau. As per the India Meteorological Department (IMD) four seasons, summer, southwest monsoon, post monsoon, and winter are observed in the region. Summer starts from March and continues up to middle June. This is followed by the southwest monsoon lasting up to September. October and November constitute the post monsoon season. Weather is generally cold during December to February. The IMD operates a meteorological station at Nagpur airport. As meteorological data is applicable for over 40 km from the location of the
3-8
station this information is considered to be representative of the climate within the NMA. The IMD data of this station for the duration 2001-2011 has been studied and presented in this chapter.
3.3.1 Temperature
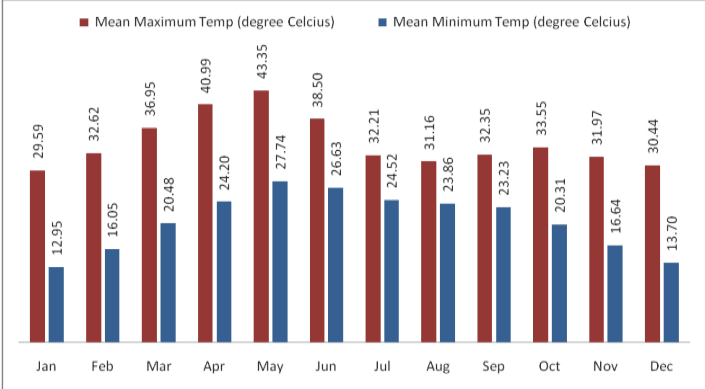
Monthly variation in temperature at Nagpur from 2001-2011 has been shown in Figure 3-6. It is clear from this table that May is the hottest month of the year with mean daily maximum temperature of about 43 Centigrade. With the onset of monsoon, temperature decreases appreciably in June but remains steady thereafter till September. During the period, the weather is generally pleasant. After monsoon, day temperature increases slightly and there is secondary maximum temperature in October. The climate becomes cool in December and continues up to February. December and January are the coldest months of the year.
3.3.2 Rainfall
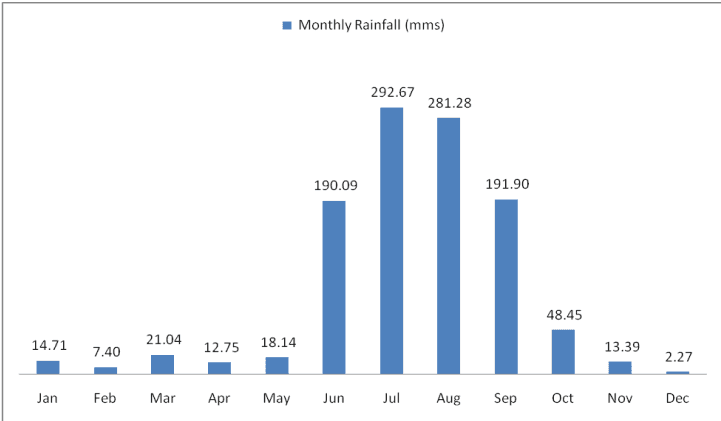
On an average the Nagpur district receives an annual rainfall of about 1,200 mm which classifies it in the moderate rainfall zone. Nagpur receives precipitation on account of both monsoons, namely southwest and northeast. The southwest monsoon occurs during June to September and northeast monsoon during October to December. Average monthly rainfall at Nagpur is shown in Figure 3-7.
As observed, July and August are the wettest months with continuous rainfall. Table 3-3 gives rainfall and number of rainy days by tehsils during monsoon. On an average there are 81.1 rainy days in a year in the NMA, of which 55.9 rainy days are in the period from June to September.
3-9
Figure 3-6 : Monthly average variation in dry bulb temperature at Nagpur
Table 3-7Variation in water table across seasons
S No
Season
Water Table Depth (m)
1.
Winter
7.6-10.7
2.
Summer
13.7-18.3
3.
Monsoon
6.1-7.6
4.
Post Monsoon
6.1-7.6
Source: Rapid Environmental Impact Assessment for 2 x 61.5 MW (Phase-II Expansion) coal based captive power plant in MIHAN Area at Nagpur, MADC Nagpur Energy Pvt. Ltd; 2009
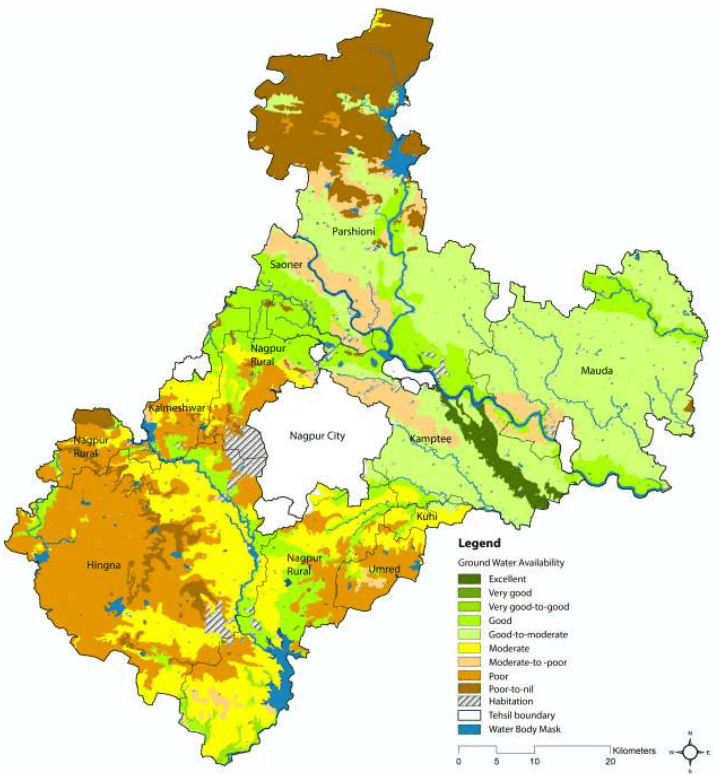
The Central Ground Water Board (CGWB) and Groundwater Survey and Development Agency (GSDA) have jointly estimated the ground water resources of Nagpur district. Ground water availability within the NMA as per the database prepared by MRSAC in different tehsils is shown in Figure 3-14. It can be seen that ground water availability in the areas bordering the western municipal city limits is poor. This area includes parts of Nagpur Rural and Hingna which have witnessed urban growth in the last few years.
As per the estimation during 2004, the total annual ground water recharge in the Nagpur District was 1102.27 million cubic meter (MCM) with the natural discharge of 60.38 MCM, thus the net annual ground water availability came out to be 1041.89 MCM. The total gross draft for all uses was estimated at 452.95 MCM with irrigation sector being the major consumer having a draft of 394.30 MCM. The allocation for domestic and industrial water requirements for the next 25 years is worked at 102.28 MCM. The net ground water availability for future irrigation is estimated at 567.62 MCM. Stage of ground water development varies from 13.57 percent (Mauda) to 98.53 percent (Katol). The overall stage of ground water development for the district is 43.47 percent.
In terms of ground water resources, all tehsils falling under NMA belongs to “Safe” category. The nature and yield potential of the aquifers occurring in different areas in the district has been assessed by the CGWB. As per the assessment, six tehsils of the NMA i.e. Hingna, Mauda, Umred, Kalmeshwar, Kuhi, and Kamptee, have medium to high yield potential and, Parshioni and Saoner tehsils have low to high yield potential. The suitable abstraction structures are dug-well and dug-cum-borewells (DCB).
3-21
Figure 3-14: Ground Water Availability in the NMA
Data source: MRSAC; Map prepared by Halcrow
3.4.3 Water quality
The surface water (SW) and ground water (GW) quality monitoring in the Maharashtra State is carried out by several agencies, namely, the Central Water Commission (SW), Central Pollution Control Board (GW), Groundwater Surveys and Development Agency (GW), Hydrology Project (SW), Maharashtra Pollution Control Board (MPCB), Central Ground Water Board (CGWB) and Directorate of Irrigation Research and Development (DIRD). The Hydrology Project monitors surface water quality through sampling points spread across the State throughout the year. DIRD monitors dug wells in the command area of major and
3-22
medium Irrigation Projects. Ground Water Surveys and Development Agency also monitors the dug wells as well as ground water levels of the State intermittently.
3.4.3.1 Surface Water Quality
MPCB is executing the GEMS (Global Environmental Monitoring System) /MINARS (Monitoring of Indian National Aquatic Resources) projects under National Water Quality Monitoring Program (NWMP) funded by CPCB to understand the nature and extent of pollution control required in the state. At present MPCB monitors 48 surface water and 25 ground water locations in Maharashtra. Monitoring at these stations is done as per the uniform protocol for water quality monitoring prescribed by MoEF and CPCB. Table 3-8 shows the surface water quality of the rivers falling in NMA.
Table 3-8Surface Water Quality for the year 2007
Sr.No.
Station Name
Monitoring Frequency
Parameters
Desired Range
Apr-07
Jul-07
Oct-07
1
Kanhan River, Agargaon, Kuhi D/s. of Nagpur
Quarterly
pH
6.5 to 8.5
7.4
7.5
8.1
BOD (mg/l)
<4mg/l
4
7
6.9
DO (mg/l)
>10mg/l
5.2
5.3
6.5
Tot. Coliform (per 100ml)
200
1,600
280
2
Kolar river before confluence with Kanhan river at Waregaon Bridge, Kamptee
Quarterly
pH
6.5 to 8.5
8.1
8.2
BOD (mg/l)
<4mg/l
7.5
9.6
DO (mg/l)
>10mg/l
4.8
5.4
Tot. Coliform (per 100ml)
240
70
3
Wainganga after confluence with Kanhan. Village-Ambhora, Taluka- Kuhi,
Quarterly
pH
6.5 to 8.5
7.3
7.7
8
BOD (mg/l)
<4mg/l
5.5
6.5
6.3
DO (mg/l)
>10mg/l
5
5.7
6.7
Tot. Coliform (per 100ml)
500
1,600
500
Source: Water Quality under GEMS MINARS Project- Monitored by MPCB
As observed from the above table, the pH of surface water ranges from 7.3 to 8.3. The limits specified for pH in IS: 2296 and IS: 10500 is 6.5-8.5. Thus, the same is on the higher side. The BOD concentration in all the rivers above is greater than 4mg/l depicting that water is contaminated with organic matter making it unfit for drinking purpose.
The concentration of DO ranges from 4.5mg/l to 6.6mg/l, which indicates presence of good biological life in the rivers. But DO level is less than desirable level of 10mg/l. Higher coliform count in rivers indicates that water is contaminated with biological waste and is not suitable for drinking without disinfection. The contamination is taking place due to direct mixing of untreated waste water of cities/town located along these rivers through local drains.
3-23
3.4.3.2 Ground Water Quality
In the district, 35 water samples were collected by CGWB during May 2007 to assess the ground water quality. Groundwater quality as monitored by CGWB for three years (2007, 2008 and 2009) by tehsils is as given in Table 3-9.
Table 3-9Ground Water Quality by Tehsil (2007, 2008 and 2009)
Tehsil
Ground Water Quality as per CGWB
Hingna, Mauda,
The water quality evaluations of the villages of these tehsils indicated that the overall
Nagpur Rural and
ground water quality was good in all these tehsils for the available data set, except
Parshioni
Hingna Industrial area. Also, it was observed from the descriptive statistics that except high nitrate levels in 23-36% samples, almost all other samples were within the desirable or permissible limit.
Kamptee
The overall water quality of Kamptee tehsils was poor for the available data set. The poor water quality could be due to the high levels of fluoride and nitrate in all the samples.
Umred
Umred village in Umred tehsil, monitored in 2008, showed that the water quality was excellent as all the parameters were within the desirable or permissible limit.
Saoner
In this tehsil, water quality varied from good to poor. The overall ground water quality was found to be poor in 2007 while good in 2008-09. The probable reasons for poor water quality could be the high levels of TH, Mg and nitrate in the range of 17 to 20% and 33-50% respectively.
Kuhi
The ground water monitoring carried out in Kuhi village of Kuhi tehsil indicated that the ground water quality was excellent in both the years i.e. 2007-08.
Kalmeshwar
Kalmeshwar and Dhapewada villages in Kalmeshwar tehsil varied between poor to unsuitable for drinking. The overall ground water quality of the tehsil was very poor in 2007, unsuitable for drinking in 2008 and poor in 2009. The high contamination levels of TDS, TH, Ca, Mg and nitrate is about 50-100% in ground water.
It can be concluded from above water quality description that Umred and Kuhi showed excellent water quality in NMA. Good water quality is observed at Nagpur Rural, Parshioni, Mauda and Hingna whereas Kamptee and Kalmeshwar had poor water quality. The high concentration of TH, Mg and nitrate along with fluoride exceedance in some part of this region, are the major issues for this district. Excessive nitrate in the water could be due to intensive agriculture, un-sewered sanitation in densely populated areas or from point sources such as irrigation of land by sewage effluents. Agricultural (use of phosphatic fertilizers) and industrial activities (clays used in ceramic industries or burning of coals) contribute to high fluoride concentrations in groundwater. During weathering and circulation of water in rocks and soils, fluorine can leach out and dissolve in groundwater and thermal gases. The fluoride content of groundwater varies greatly depending on the geological settings and types of rocks. Also high levels of Mg and total hardness in water are due to excessive application of lime and other chemicals to the soil in agricultural areas.
Table 3-1Summary of percent slopes in the NMA
Slope
Percent Area Covered
0 - 5 %
99.78 %
5 - 10 %
0.08%
10 - 15 %
0.01%
15 - 35 %
0.14%
35 - 50 %
0.01%
3-34
3.8.1.2 Impact on hydrological regime
Mining and its associated activities not only use a lot of water but also affect the hydrological regime of the area ultimately impacting water quality. The major hydrological impact of large and deep opencast mines is on the overall ground water regime of the region.
Water that seeps into mines and collected in mine sumps is partly used up in the mine and the excess amount is discharged into the surface drainage system. The water used for spraying on haul roads, conveyors, at loading and unloading points, bunkers etc. is lost by evaporation. A deep mine is likely to have longer haul roads requiring more spraying water. The water used for green belts and plantation areas are also lost by evapo-transpiration. Many areas of the country faced over exploitation of ground water resources resulting in alarming lowering of water table.
Acid Mine Drainage
Acidic water results in severe water pollution problems. Acid Mine Drainage (AMD) refers to distinctive types of waste bodies that originate from the weathering and leaching of sulphide minerals present in coal and associated strata. Environmental effects of AMD include contamination of drinking water and disrupted growth and reproduction of aquatic plants and animals. Effects of AMD related to water pollution include the killing of fish and loss of aquatic life and corrosion of mining equipment and structures such as barges, bridges and concrete materials.
Generally, water quality characteristics of acidic mine water reflect high acidity and high hardness along with high iron and sulphate contents. Various toxic trace/ heavy metals become soluble in acidic water and may present significant concentration levels depending upon their availability in the source material. AMD cripples the economy of mines and involves huge cost burden in its management.
Pumping Mine Water
The mining industry has to discharge millions of litres of water every day to the adjacent watercourses and thereby causing water pollution in the surrounding areas. This water, otherwise a valuable water resource, becomes contaminated with various domestic and industrial trade effluents and subsequently is wasted while putting on an extra cost burden on the underground mines. Further costs are incurred on abstraction of water from adjoining surface water bodies containing this water and additional costs are required for the treatment to meet the water quality objective criteria.
3.8.1.3 Impact on Land
Irrespective of the type of mining used for extracting coal, mining invariably results in enormous land disturbance- e.g. large scale excavation, removal of top soil, dumping of solid wastes, cutting of roads, creation of derelict land etc. The mining industry, in general, is reluctant to reuse overburden material for economic reasons but in a few cases it has been planned to reuse the material to fill the voids created at the end of mining, and it is expected that the practice will become more widespread in future. Opencast mining has more potential impact on land than underground mining. With improved technology, opencast coal mining is being used extensively because of its cost effectiveness and productivity though it results in large-scale land disturbance. Although underground mining has considerably less impact than opencast mining on land, it causes enough damage through subsidence. The surface subsidence inflicts severe
3-35
damages to engineering structures such as highways, buildings, bridges and drainage besides interfering with ground water regime.
3.8.1.4 Impact of Noise and Vibrations
A cumulative effect of all mining activities produces enormous noise and vibrations in the mining area.The availability of large diameter, high capacity pneumatic drills, blasting of hundreds of tonnes of explosive are particularly identified as major sources of noise pollution. Inpit crushing system with mobile crusher and large capacity materials handling plants are being installed to facilitate speedy handling of large quantities. All these activities are major sources of noise and vibrations in and around the mining complexes.
The obvious implication of noise is the potential for noise-induced hearing loss. In addition, noise produces other health effects, reduces work performance and makes communications more difficult. Besides, the fauna in the forests and other areas surrounding the mines/industrial complexes is also affected by noise and it has generally been believed that wildlife is more sensitive to noise and vibrations than the human beings.
Thus the mining industry has enormous impacts on the environment and on local communities. Local and regional effects of coal mining include conversion of vast swathes of land into desolate wastelands; habitat loss and species extinction; cracked river beds; waterways polluted with salt and sediment; air, noise, and visual pollution resulting in negative health impacts on local communities; exploitative workplace practices; displacement of alternative industries, and more. (Source: Environmental Issues with Best Management Practice of Coal Mining in India, Dr. Gurdeep Singh, Professor and Head, Centre of Mining Environment, Indian School of Mines, Dhanbad)
M/s. WCL have taken some measures for control of air pollution as well as water pollution in their mines, such as installation of fix type water sprinklers on coal transportation roads, haul roads, area near coal handling plants, other sources of pollution. They have provided tar roads to avoid the fugitive emissions during transportation of coal.
3.8.2 Air Pollution due to Thermal Power Plants
Thermal power plants (TPP) account for a major share of industrial emissions in the NMA. TPPs are located in Koradi (Kamptee Tehsil) and Khaperkheda (Hingna Tehsil). Koradi TPP is the major source of air pollution for its surrounding areas and the effects of emission of un-burnt coal particles, dust and particulate matter from TPP stacks is observed up to 10-15kms from the plant. These emissions are one of the causes of ailments related to respiratory system in the NMA.
The main emissions from coal combustion at thermal power plants are carbon dioxide (CO2), nitrogen oxides (NO), sulphur oxides (SO), chlorofluorocarbons (CFCs), and air- borne inorganic particles such as fly ash, soot, and other trace gas species. Carbon dioxide, methane, and chlorofluorocarbons are greenhouse gases. These emissions are considered to be responsible for heating up the atmosphere, producing a harmful global environment. Oxides of nitrogen and sulphur play an important role in atmospheric chemistry and are largely responsible for atmospheric acidity. Particulates and black carbon (soot) are of concern, in addition to possible lung tissue irritation resulting from inhalation of soot particles and various organic chemicals that are known carcinogens.
3-36
3.8.3 Impact of Ash Ponds on Ground Water Quality
The main waste product from a thermal power plant is ash (fly ash and bottom ash). It is generally recommended to utilise 100% fly ash for manufacturing of fly ash based products (such as Portland pozzolona cement, brick, light weight aggregates, asbestos cement products etc.). In order to avoid environmental hazards, ash should be safely disposed in ash ponds.
Water sprinkling should be employed in order to control fugitive dust emission from the ash ponds. After the ash pond is reclaimed, the area should be covered with tree plantation. HDPE liners should be provided in the ash pond in order to arrest any seepage of ash pond water into groundwater. Ash pond leachate may lead to contamination of ground water due to leaching of heavy metals from ash.
Disposal of fly ash from two power plants, namely, Koradi TPP (1,160 MW) and Khaperkheda TPP (840MW) is one of the major problems faced by MSEB and local residents. As per the Fly Ash Notification issued by MoEF, New Delhi in 1999 (Draft Notification 2007 yet to be finalised) all thermal power plants based on coal/lignite shall provide fly ash to cement/brick manufacturers free of cost for manufacturing concrete, bricks and use in other construction activity.
The Maharashtra Pollution Control Board (MPCB) is the prescribed authority for implementation of fly ash utilization regulation in the state. The power stations are located near the city, causing environmental problems to the nearby locality. The brick manufacturers within 100km area consume only about six percent ash generated. The utilization of fly ash needs to be attended on priority basis. MPCB has taken action against brick manufacturing unit regarding cancellation of mining lease and has requested cement plants to use fly ash for the production of Pozzolana cement.
M/s. WCL is filling sand (stowing) in the underground coal mines. If fly ash is stowed instead of sand in the underground coal mines then most of the problem of fly ash utilization will be addressed to an extent. MSEB Thermal Power Stations have to chalk out comprehensive policy for utilization of fly ash. (source: Environment Report Nagpur 2004)
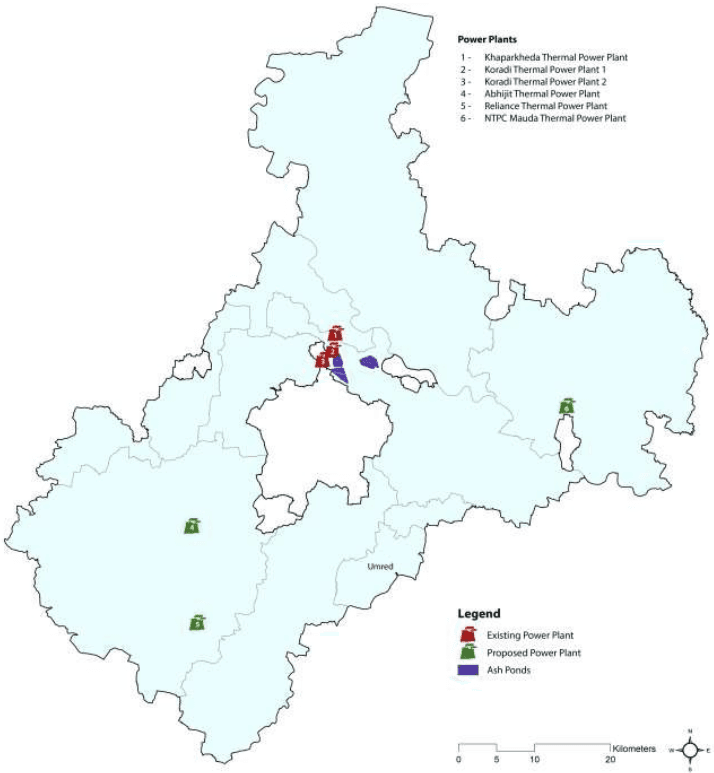
Table 3-12 shows the quantity of fly ash generation and fly ash utilisation at Koradi and Kaparkheda power plants in 2005-2006. It is observed that only 10 percent of fly ash was utilised from Koradi power plant, with majority quantity utilised by brick kiln manufacturers. In case of Khaperkheda power plant, only 39 percent of fly ash was utilised with majority quantity utilised by cement manufacturers. This information clearly presents the mismanagement of fly ash at these power plants which is ultimately leading to pollution in the nearby localities.
Table 3-12Ash generation from thermal power plants and utilization (2005-2006)
Description
Unit
Koradi TPP
Kaparkheda TPP
Total
Power generation capacity
MW
1,080
840
1,920
Total annual coal consumption
MT/yr
77,03,121
44,52,394
1,21,55,515
Average percent Ash content in coal
22.73
37.23
59.96
Total Ash Generation
MT/yr
17,51,004
16,57,598
34,08,602
Ash Pond Details
Ash pond area
ha
445
387.7
832.7
Active ash pond area used
ha
434
332.5
766.5
Quantity of ash in ash bunds
mm3
25
10.5
35.5
3-37
Fly Ash Utilisation in 2005-2006
Cement Industry
MT
5,27,458
5,27,458
Brick kiln manufacturing
MT
1,35,056
72,151
2,07,207
Ash based products
MT
8,740
8,740
Agriculture
MT
494
23,054
23,548
Other activities
MT
39,450
21,216
60,666
Total fly ash utilization in a year
MT
1,75,000
6,52,619
8,27,619
Utilization of fly ash as percent of total generation
10%
39%
49%
Source: MPCB
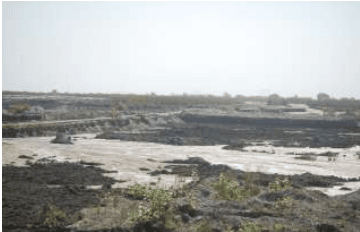
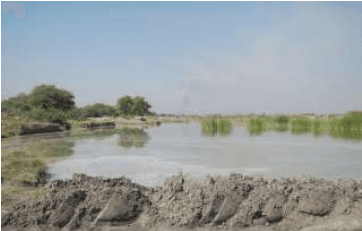
View of ash ponds
3-38
Figure 3-22: Location of ash ponds
3-39
This page is intentionally left blank.
3-40
Table 3-10Recent Earthquake Tremors Experienced in Nagpur
S No
Date
Earthquake details
1.
18 September 2011
The magnitude of the tremors recorded in Nagpur was 6.3 on the Richter scale. This was the powerful earthquake that rocked the northeast and other parts of country.
2.
23 June 2000
Nagpur and most areas of Eastern Vidarbha experienced mild tremors as an earthquake of `slight' intensity struck south-east border of the State, about 40 kms west-south-west of Chandrapur. However, no damage to
3-27
S No
Date
Earthquake details
property or casualties was reported. The earthquake measuring 4.0 on Richter Scale, was recorded at 3.40.41 pm and lasted for about 86 seconds
3.
27 December 2003
An earthquake of mild intensity measuring 3.1 on the Richter scale rocked the city in the early hours. The quake had its epicenter in Akola district of Maharashtra.
3.6.2 Floods
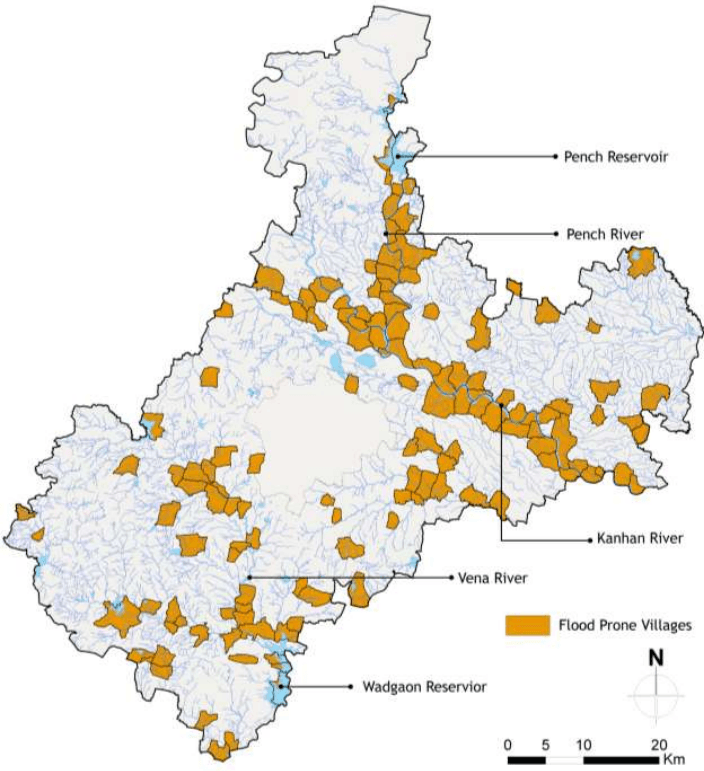
NMA is flood prone during monsoons. The history of last 50 years reveals that if there is heavy rainfall in the Satpura hills of the catchment area of Rivers Wardha, Kanhan or Pench rivers, sudden and big flash floods occur in these rivers. Nalas are non-perennial streams and are generally prone to flash floods. During the last thirty years, seven major floods had occurred in Nagpur district with 606 deaths and total loss of approximately Rs. 814 million. Prominent floods that have occurred in the past include the 1962 Wardha river flood, 1979 Vena river flood, 1991 Wardha river flood and 1994 heavy floods in all rivers of the District. The Vena River Floods of 1979 caused very heavy damages. This river has its catchment in Kalmeshwar and Katol Tehsils and a portion of Kalmeshwar lies within the NMA.
Kanhan and Pench rivers falling within NMA have frequency of heavy floods as once in 10 years and Kamptee town is especially susceptible to the floods in these rivers. Low lying areas of Kamptee cantonment and Kamptee town need flood protection measures. There are flood prone villages / towns on the banks of Kanhan and Pench rivers in Saoner, Parshioni, Kamptee and Mauda Tehsils. The District Disaster Management Action Plan (DDMAP) enlists flood prone villages/towns in the District. The Figure 3-17 illustrates flood prone villages declared in the DDMP and included in the NMA. In all around 157 villages in all tehsils of the NMA, except Kuhi, are prone to floods. A list of these villages is provided in Annexure 5.
3-28
Figure 3-17: Flood prone villages in the NMA
Data Source: Nagpur District Disaster Management Action Plan; Map prepared by Halcrow
3.6.3 Cyclones
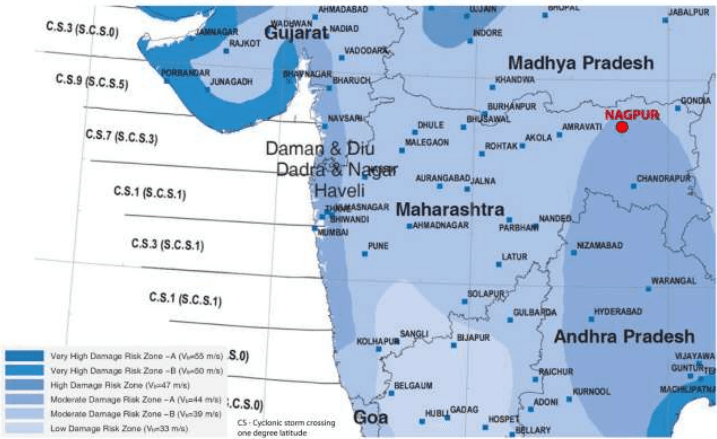
Nagpur lies at a distance of at least 1,000 km from the coastline. As per the Cyclone Hazard map prepared by the BMTPC, the NMA partly lies in the Moderate Damage Risk Zone – A and Moderate Damage Risk Zone - B. However in the absence of any such past event, historical evidence demonstrates that the NMA is not prone to Cyclones. Figure 3-18 shows Wind and Cyclone Vulnerability in Maharashtra as per the map prepared by the Building Materials and Technology Promotion Council (BMTPC).
3-29
Figure 3-18: Wind and Cyclone Vulnerability in Maharashtra
Source: Building Materials and Technology Promotion Council Vulnerability Atlas (Second Edition, Peer Group MOH&UPA – Based on digitised data of SOI, GOI: Basic Wind Speed Map IS 875(3) – 1987: Cyclone data 1877-2005 IMD, GOI)
Data source: IMD data, 2001-2011
Figure 3-7: Average total monthly rainfall in the NMA (mm)
Data source: IMD data, 2001-2011
3-10
Table 3-3Total rainfall and rainy days in the tehsils of the NMA during monsoon
Tehsil
June
July
August
September
Rainfall (mm)
Rainy Days
Rainfall (mm)
Rainy Days
Rainfall (mm)
Rainy Days
Rainfall (mm)
Rainy Days
Kalmeshwar
146.9
11.5
462.3
16.5
248.0
14.8
181.7
10.3
Kamptee
136.7
17.6
311.4
17.6
274.6
17.6
181.9
11.3
Kuhi
149.1
10.4
347.8
17.7
334.5
17.3
180.9
11.5
Umred
139.8
11.1
340.4
17.2
335.1
17.4
161.7
10.3
Nagpur Rural
136.4
11.0
307.9
11.0
253.7
15.9
196.2
10.9
Saoner
168.5
11.7
282.0
17.2
196.0
14.5
177.2
9.5
Parshioni
141.7
11.0
353.4
19.6
249.2
16.7
172.9
12.3
Hingna
160.6
10.7
364.0
19.2
302.4
18.5
210.2
11.5
Mauda
169.2
10.3
277.8
16.5
229.8
15.7
155.3
9.1
Data source: IMD data, 2001-2011
3.3.3 Humidity
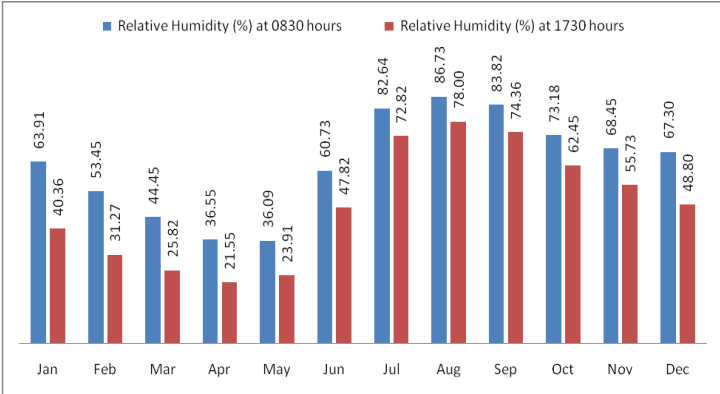
Monthly variation of humidity at Nagpur has been given in the Figure 3-8. An increase in temperature results in corresponding decrease in relative humidity and vice versa. Therefore, as observed from the figure, summer months form the driest part of the year when relative humidity is low, particularly in April and May. The climate is highly humid in monsoon, particularly in August. The average relative humidity in monsoon months goes as high as 85 percent.
Figure 3-8: Monthly average variation in relative (percent) humidity at Nagpur
Data source: Nagpur IMD observatory data
3-11
3.3.4 Cloud Cover
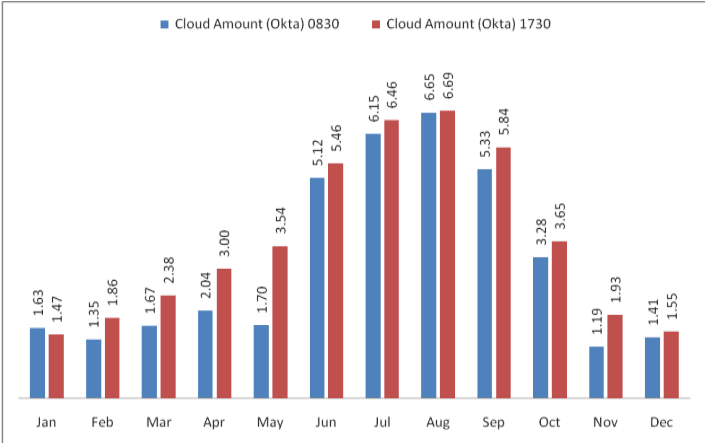
The cloud cover data for Nagpur IMD observatory is presented in Figure 3-9. As observed, the sky is heavily clouded to overcast during southwest and southeast monsoon and moderately clouded in post monsoon. During rest of the year the sky is clear or lightly clouded. Cloud cover is measured in Oktas5.
Figure 3-9: Monthly variation in cloud cover at Nagpur
Data source: IMD Metrological Station, Nagpur
3.3.5 Solar Radiation and Potential for Solar Energy Generation
India is located in the equatorial sun belt of the earth, thereby receiving abundant radiant energy from the sun. The annual global radiation in the country varies from 1,600 kWh/m2to 2,200 kWh/m2, which is comparable with radiation received in the tropical and sub-tropical regions. The equivalent energy potential is about 6,000 million GWh per year.
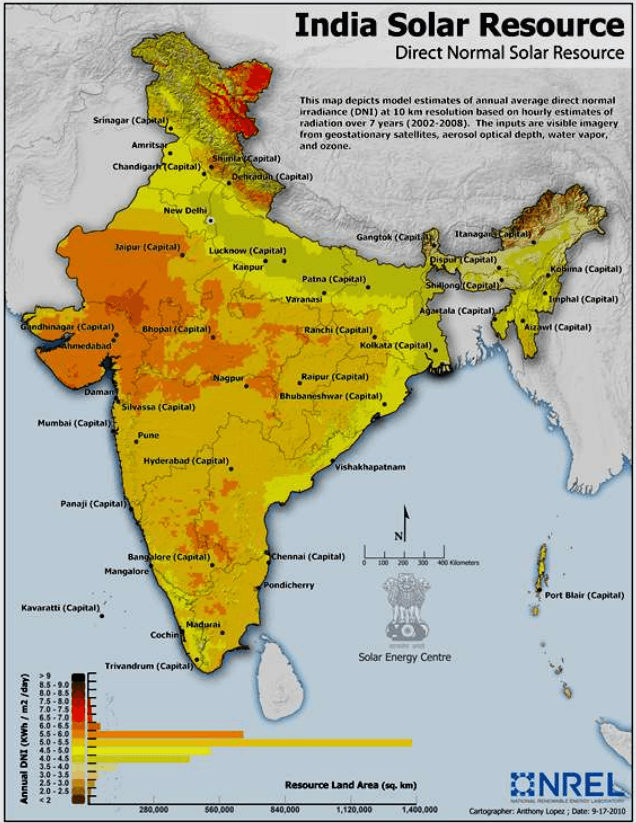
The Ministry of New and Renewable Energy (MNRE) in collaboration with the IMD has published the typical climatic data for selected radiation stations in India, including Nagpur (data from period 1986 to 2000). This is presented in Table 3-4. Also, the US National Renewable Energy Laboratory (NREL) in collaboration with MNRE has developed a map representing ‘Direct Normal Solar Irradiance in India. This is shown in Figure 3-10.
5In meteorology, an okta is a unit of measurement used to describe cloud cover. Sky conditions are estimated in terms of how many eighths of the sky are obscured by cloud, ranging from completely clear, 0 oktas, through to completely overcast, 8 oktas.
3-12
The average annual solar radiation in Nagpur is about 5.09 kWh/m2/day with more than 300 sunny days per year. Unobstructed exposure to sunlight for most or for the whole day, throughout the year is very essential in order to harness solar energy, making the NMA geographically suitable for development of solar energy resources and infrastructure. However it should be noted that parts of Gujarat, Rajasthan are more suitable than most others and the solar irradiance at Nagpur is generally within the average range observed in majority parts of India.
Table 3-4Mean annual solar radiant exposure over select IMD radiation stations in India
S No
Station
Solar Radiant Exposure (KWh/m<sup>2</sup>/day)
1.
Srinagar
4.27
2.
Kolkata
4.49
3.
Shillong
4.51
4.
Ranchi
4.55
5.
New Delhi
5.06
6.
Mumbai
5.06
7.
Nagpur
5.09
8.
Vishakhapatnam
5.13
9.
Bhopal
5.18
10.
Ahmedabad
5.36
11.
Chennai
5.37
12.
Thiruvanathpuram
5.4
13.
Pune
5.41
14.
Bangalore
5.47
15.
Jodhpur
5.54
16.
Panjim
5.55
Source: MNRE solar radiation handbook (2008)
3-13
Figure 3-10: Estimates of annual average direct normal solar irradiance in India
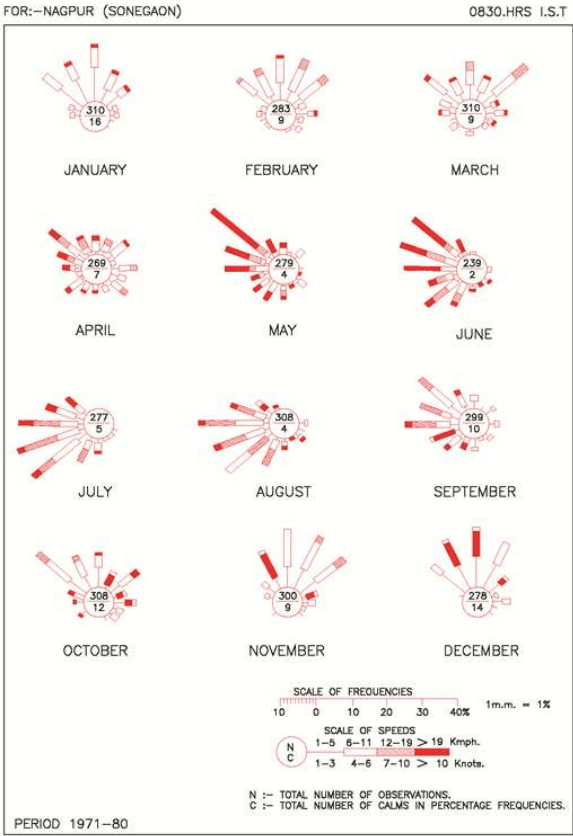
Wind velocity observed in the NMA ranges from light to moderate with some increase during the latter part of the summer and monsoon seasons. Monthly average wind speed recorded by IMD at Nagpur is presented below in the Table 3-5. The monthly wind rose diagrams showing wind persistence in various directions are shown in Figure 3-11. During this period the wind directions are mostly from southwest and northwest directions. In April, May and June winds generally blow from the northwest. During October to December, winds mainly blow from northerly and north-easterly in the forenoons and north-easterly to easterly in the afternoons. The prevailing wind direction is from north-west and north-east in the period from May to September and from west and south-west during June-July and August months. It is clear from the wind rose diagram that the dominant wind direction is North West-West to South East-East.
In the month of May and June, the climate undergoes a low pressure period resulting in the wind blowing at a speed of 20 km/h or more. But for the rest part of the year, wind speed is between 5 km/h to 6 km/h.
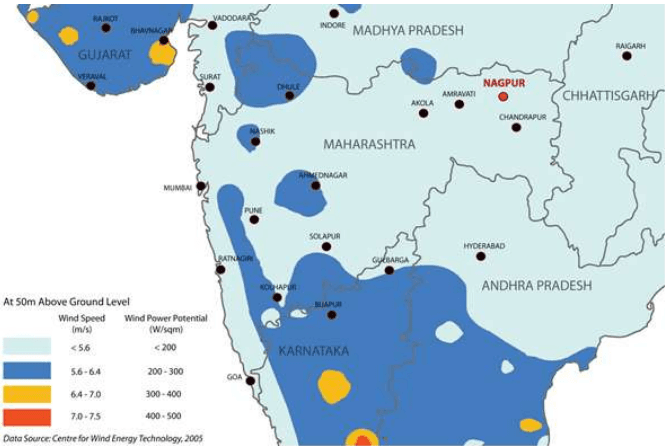
Figure 3-12 illustrates the average wind speed and wind power potential at 50 m above ground level in parts of Maharashtra. It is seen that wind power potential observed within the Nagpur region is below 200 W/m2, which does not make it a viable location for wind power generation.
Table 3-5Monthly average wind speed at Nagpur
S No
Month
Average Wind Speed (km/h)
1.
January
6.6
2.
February
7.9
3.
March
8.5
4.
April
9.6
5.
May
13.4
6.
June
14.1
7.
July
12.0
8.
August
11.1
9.
September
9.5
10.
October
7.6
11.
November
7.2
12.
December
6.4
Source: IMD metrological station, Nagpur
3-15
Figure 3-11 : Monthly wind-rose diagram
3-16
Figure 3-12: Wind speed and wind power potential
3.3.7 Air Quality
The Maharashtra Pollution Control Board (MPCB) is responsible for monitoring air quality in the region. This is being done as part of National Air Monitoring program (NAMP), through independent institutes who directly report to the Central Pollution Control Board (CPCB). The CPCB has six sanctioned NAMP stations in Nagpur. National Environmental Engineering Research Institute (NEERI) and Vishveshwarya National Institute of Technology (VNIT) are the responsible implementation agencies for air quality monitoring at 3 stations each. Table 3-6 presents the air quality of these six stations for 2006-2008.
As observed from the above air quality monitoring data, the levels of S O 2 and N O X are well below the National Ambient Air Quality Standards (NAAQS) at all the monitoring locations for 2011, 2012 and 2013. Not much difference is observed in the trends of concentration of these parameters. However, the levels of Respirable Suspended Particulate Matter (RSPM) are exceeding the prescribed limits at most of the locations with some exceptions. It may be mentioned that out of these monitoring stations only one monitoring station (MIDC office, Hingna Road) falls in NMA. Other locations are within the Nagpur city.
3-17
Table 3-6Annual average air quality in Nagpur
Location
MIDC Office, Hingna Road, Nagpur
Govt. poly technique College, Nagpur
Institution of Engineers, North Ambazari Road, Nagpur
RO Office Premises, Civil Lines, Nagpur
Type of Land Use/Year/Parameters
Industrial
Rural & other areas
Residential
Residential
2011
SO2
10
9
9
9
NOX
36
30
34
27
RSPM
106
80
86
57
2012
SO2
11
10
11
9
NOX
40
36
38
30
RSPM
132
86
96
54
2013
SO2
11
7
10
9
NOX
34
34
31
24
RSPM
118
80
91
58
National Ambient Air Quality Standards (NAAQS)
Parameters
Industrial
Residential
SO₂
80
60
NOX
80
60
RSPM
120
60
Source: Maharashtra pollution control board
Air quality in the past years6
The annual average levels of Suspended Particulate Matter (SPM), S O 2 and N O X in Nagpur city during the years 1991 to 2003 were analysed by NEERI to assess the trend variations in the three representative activity zones. Annual air quality trends (in terms of SPM, SO2 and N O X ) at the industrial, commercial and residential sites in Nagpur are presented in Annexure 4.1, along with the applicable CPCB standards and World Health Organisation (WHO) guidelines. Analysis of SPM data indicates that the SPM levels were marginally higher than the corresponding CPCB standards. SPM levels were consistent during 1998-1999, then increased in 2000 and remained quite consistent (in the range 129-145 µ g/m ³ during 2000- 2003. Annual mean S O 2 levels remained more or less consistent at all the three sites, and were always much below the corresponding CPCB and WHO standards throughout the period. Annual mean N O X levels were also much below the corresponding CPCB and WHO standards throughout the period.
Monitoring of particles of 10 micrometers or less (PM10) levels was included in CPCB stations during 2001. Annual mean levels of PM10 in Nagpur, Pune and Mumbai during 2001-2003 are presented in Annexure 4.2. In general, PM10 levels exceeded the CPCB standard of 6 0 µ g / m 3 in all the three cities during this period. A decreasing trend in PM10 concentrations was observed in Nagpur.
Concentration of all the pollutants is lowest in Nagpur as compared to other cities and is well below the prescribed CPCB standards. However, it should be noted that there are many industries outside the Nagpur
6 State of environment, Maharashtra, 2006-07
3-18
municipal limits (within NMA) including MIDC Hingna and Butibori industrial area. Industries belonging to Red, Orange and Green categories exist within the NMA. Majority of the industries belong to Orange category, which are comparatively less polluting than Red category industries (classified as heavily polluting).