Natural Resource Conservation includes management of water (surface and ground), air and noise. The environmental quality of an area depends up on the ambient air quality and water quality which influence the quality of life of the inhabitants.
21.1.1 Climate
21.1.1.1 Precipitation
Ernakulam district has wet monsoon type of climate. The district experiences heavy rainfall during southwest monsoon season followed by northeast monsoon. During the other months the rainfall is considerably less. March, April and May are the hottest months. December to February is the coldest months. The district receives on an average 3359.2mm of rainfall annually. The annual rainfall ranges from 3233 to 3456 mm at different places of the district. The rainfall is less in the western part of the district and gradually increases towards the east.
Kochi Municipal Corporation
ENVIRONMENT
Maximum rainfall is received around Neriamangalam area in the eastern part where the normal annual rainfall is found to be 5883 mm. While Kochi, which is in the western part receives around 3233 mm rainfall annually. South-west monsoon season contributes nearly 67.4% of total rainfall of the year, followed by the north-east monsoon which contributes nearly 16.6% and the balance of 16% is received during the month of January to May as summer showers (Source Ground water information booklet, Ernakulam 2013)Extreme rainfall events have become a recent occurrence which affects the general agriculture pattern and capacity of existing drainage system causing flash floods in Kochi
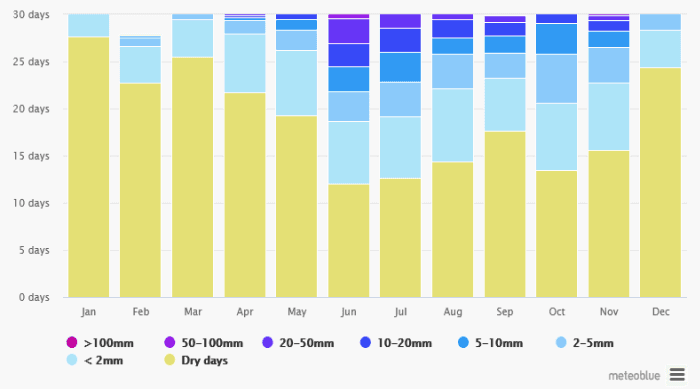
Figure 21:1 Precipitation variation (annual), Source: meteoblue.com
21.1.1.2Wind Rose
The wind speed ranges from 6.7 to 10.9 km/hour with mean speed of 9.1 km/hour, which is high during the period from March to September. The major wind flow direction is from South West – West to North East and East direction.
Westerlies carry pollutants towards eastern direction and Easterlies which are weak or absent during night accumulates pollutants at the source.
• During SW monsoon the pollutants are removed with scrubbing effect
550
Obnoxious industries causing air pollution are not recommended in the western coastal area.
Kochi Municipal Corporation
ENVIRONMENT
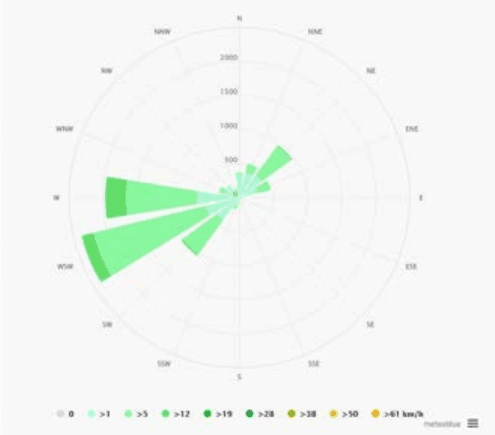
Figure 21:2 Wind Rose Diagram (annual) Source: meteoblue.com
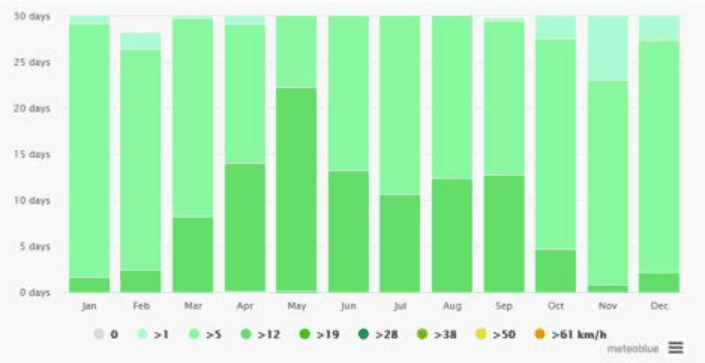
Figure 21:3 Annual Variation of Wind speed Source: meteoblue.com
Kochi Municipal Corporation
ENVIRONMENT
As per the data from Cochin port trust, the wave climate is governed by the South West monsoon when wave action can be strong with prevailing wave direction from north-west to south-west. Deep water (15m) wave observation in the past indicate the significant wave heights of 4m, 2m and 1 m at the water depths of 10m, 5m and 2m respectively, the predominant wave direction being west. Wave action inside the harbour is insignificant because of narrow entrance between Cochin Gut and Fort Cochin and the configuration of the land. Generally calm conditions prevail throughout the year except during the times of extreme wind action. Therefore wind and wave energy are not suitable options for developing non-conventional energy.
21.1.1.3Temperature
The mean monthly maximum temperature ranges from 28.1 to 3 1 . 4 ° C and the minimum ranges from 23.2 to 2 6 ° C , The maximum temperature occurs during March and April months and the minimum temperature occurs during December and January months. The humidity ranges from 68 to 89% during morning hours and 64 to 87% during evening hours. The maximum humidity is observed during May to October months.
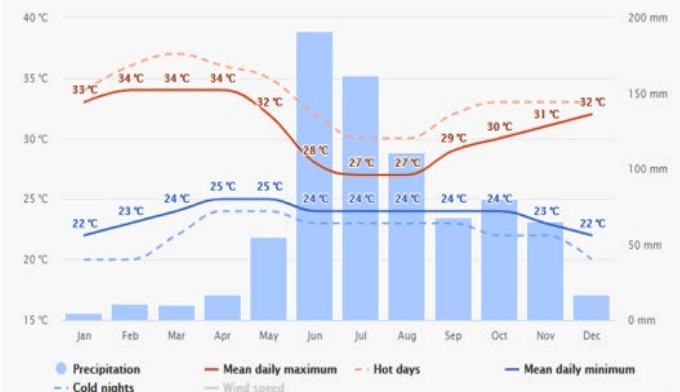
Figure 21:4 Annual temperature variation with precipitation Source: meteoblue.com
552
Sunshine hours range from 4.3 to 9.7 hours/day. Maximum sunshine is during the month of February. The months of June to August record the minimum sunshine due to the cloudy sky. Generally good sunshine hours are recorded in the months of November to May.
Kochi Municipal Corporation
ENVIRONMENT
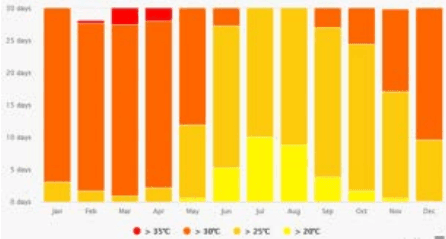
Figure 21:5 Temperature variation in Cochin city over an year Source: www.meteoblue.com
21.1.1.4Kochi as a potential heat island
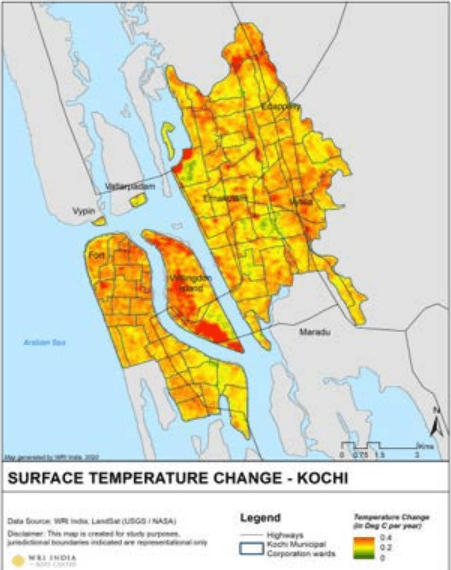
Figure 21:6 Land Surface Temperature Source : WRI, India
Kochi Municipal Corporation
ENVIRONMENT
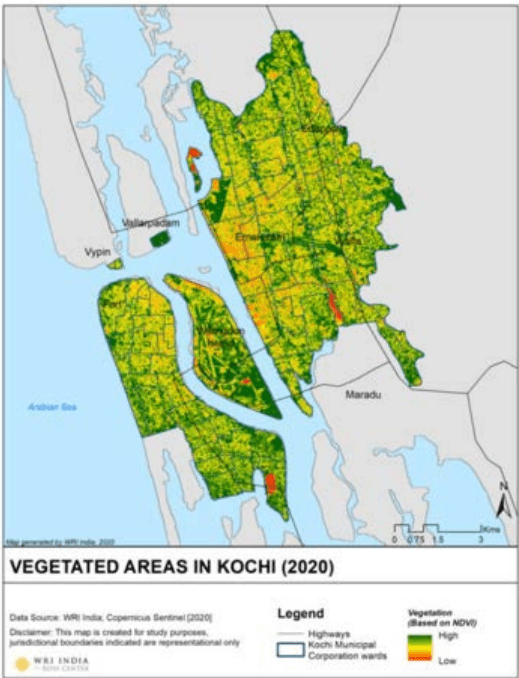
Figure 21:6and Figure 21:7show surface temperature change in Kochi and the corresponding vegetation cover (image source: Raj Palaniswamy, WRI India). An inverse correlation can be seen within the map where the surface temperature change throughout the year is high in urban and industrial areas whereas low in green patches. Urban areas can increase heat within the city with large paved and impermeable surfaces, thermal mass in buildings, lack of vegetation, waste heat from mechanical air conditioning and changes in climate. The future of Cochin city calls for an adaptation of sustainable green infrastructure wherever possible within the corporation area.
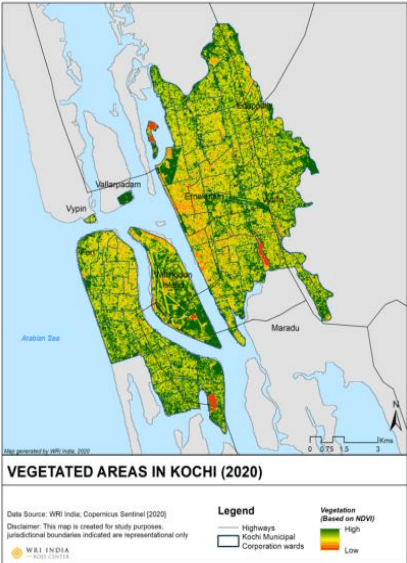
Figure 21:7 Vegetated Areas in Kochi
Source: WRI , India