In order to assess the demand for parking on major road stretches in Kochi city, parking accumulation and duration surveys were carried out during the period between 10:00 am and 07:00 pm covering both morning and evening peak periods at all the major parking locations in the city. The road stretches having on-street parking were identified based on road inventory survey.
Kochi Municipal Corporation
TRANSPORTATION
8.3.7.1 Parking Accumulation
Analysis of parking accumulation data reveals that more than 7,000 vehicles were parked in the roads of Kochi city during peak period. Most of the accumulated vehicles consisted of two wheelers constituting 68%, followed by 22% cars. Remaining 10% of the vehicles were found to be autorikshaws, goods vehicles, buses etc. Map of Kochi city showing major parking streets according to parking accumulation is shown in figure below.
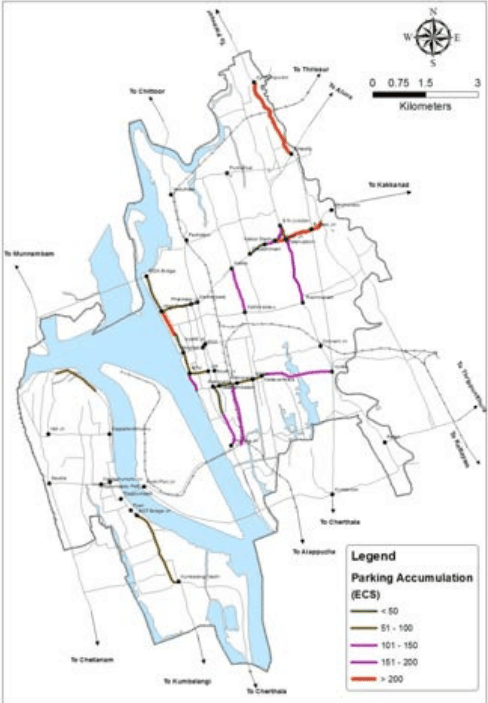
Figure-8:8 Peak Hour Traffic Volume at Major Road Stretches in Kochi Source: NATPAC study report, 2019
Kochi Municipal Corporation
TRANSPORTATION
Severest parking accumulation was found around Palarivattam area with about 750 ECS of vehicles parked around the junction area on the roadside leading to Kakkanad, Kaloor and Vyttila. Other major parking areas are High court area with about 238 ECS, Edappally-Kunnumpuram road (in front of Lulu Mall) with 232 ECS, and Marine Drive road from Hospital Jn. to High court with 201 ECS.
8.3.7.2 Parking Duration
Data pertaining to parking duration were conducted on representative basis on selected roads in the city which reveal that short duration parkers less than one hour were the major components of all parkers accounting for more than 87% percent of parkers. Only 13% of parkers parked for a duration of more than one hour.
| SL. No | Type of Vehicle | Duration of parking (minutes) | Total | |||||||
| <30 | 30-60 | 60-90 | 90-120 | 120-150 | 150-180 | 180-210 | >210 | |||
| 1 | Bus | 18 | 10 | 1 | 1 | 2 | - | - | - | 32 |
| 2 | Van | 25 | 4 | 1 | - | - | - | - | - | 30 |
| 3 | Car | 154 | 29 | 18 | 8 | 3 | 2 | 1 | - | 215 |
| 4 | Passenger Auto | 50 | 5 | - | 2 | - | - | 1 | - | 58 |
| 5 | Two Wheeler | 792 | 195 | 72 | 30 | 23 | 17 | 3 | 3 | 1,135 |
| 6 | Truck | - | 1 | - | - | - | - | - | - | 1 |
| 7 | LCV | 1 | - | - | - | - | - | - | - | 1 |
| 8 | Goods Auto | 27 | 8 | 2 | 1 | - | - | - | - | 38 |
| Total | 1067 | 252 | 94 | 42 | 28 | 19 | 5 | 3 | 1,510 | |
| Share (%) | 70.66 | 16.69 | 6.23 | 2.78 | 1.85 | 1.26 | 0.33 | 0.20 | 100.00 | |
Source: NATPAC study report, 2019
The parking accumulation along selected 11 stretches revealed that two wheelers and cars take up the maximum share. Two wheelers constituting 74% of the total had a predominate influence over the duration of parking at different intervals. Maximum parking accumulation of two-wheelers was seen at lesser than 30 minutes and 30 to 60 minute intervals.