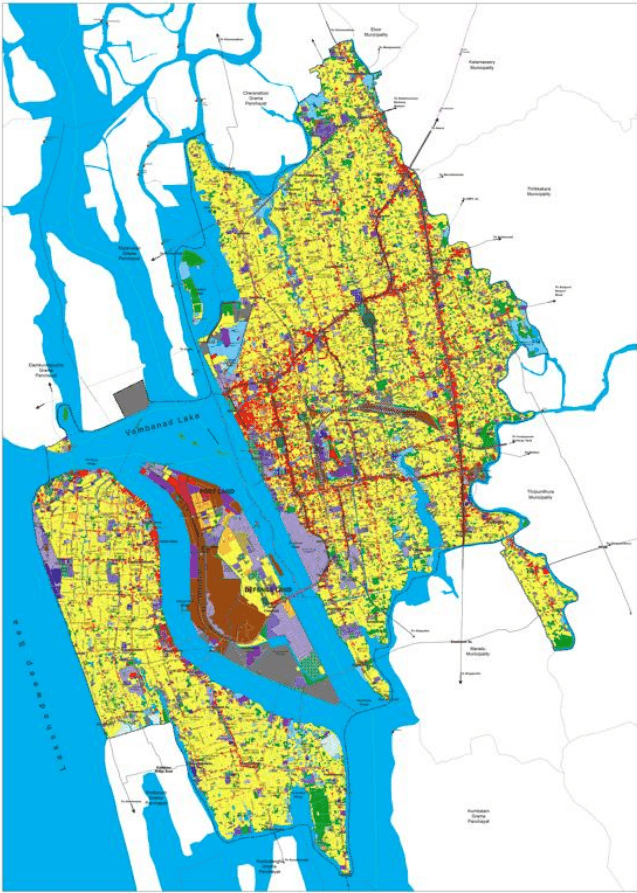
The spatial distribution shows a clear demarcation between the various land uses which makes it possible to assign definite development character to each area. It is clear that the commercial and mixed use land uses are very high towards the central city area contributing to the urban character of the city and the green areas along with wetlands are along the boundaries of the Kochi Corporation area. The scope for development on a large scale is restricted due to the limitations of available land. Strategies for the optimum usage of vacant land, transit oriented development, application of land techniques and retrofitting of existing development is essential for a balanced and sustainable city development.
Kochi Municipal Corporation
ECONOMIC ASPECTS
Chapter 6Land Use
6.1
Introduction
Land use planning is a systematic procedure carried out to assess the land utilization pattern of existing development. This helps to ensure the sustainable development of the land resources which can cater to the people’s needs and demand for both the present and the horizon year. This chapter deals with the existing land use distribution within the planning area.
6.2 Exiting Land Use
Physical, social, political and economic factors have played their decisive roles in the formation of land use pattern in Kochi Corporation Area. These factors have brought about significant variations in the land utilization pattern over different areas within the planning area. A land use survey was undertaken by the LSGD Planning Department in the year 2020. The land use distribution of Kochi Corporation is shown below.
Table 61 Land Use Distribution - Kochi Municipal Corporation Area
Sl. No
Existing Landuse
Area in Ha
Percentage(%)
1
Residential
3466.42
36.53
2
Commercial
412.66
4.35
3
Industrial
128.15
1.35
4
Public& Semi-public
38.73
0.41
5
Central Govt. Property
243.01
2.56
6
State Govt. Property
37.36
0.39
7
Educational
159.47
1.68
8
Health Services
57.15
0.60
9
Religious
99.97
1.05
10
Public Utilities
17.19
0.18
11
Heritage Structure
1.59
0.02
Kochi Municipal Corporation
LAND USE
12
Solid Waste Management
0.65
0.01
13
Recreational-1 (Open Space)
94.59
1.00
14
Recreational-2 (Built up)
23.31
0.25
15
Transportation
1165.36
12.28
16
Traffic Related
22.36
0.24
17
Railway Property
15.62
0.16
18
Communication
2.67
0.03
19
Mixed
332.49
3.50
20
Dry Agriculture
412.62
4.35
21
Bird Sanctuary
3.80
0.04
22
Mangrove
23.79
0.25
23
Sacred Groves
0.22
0.00
24
Others
132.81
1.40
25
Vacant Land
638.48
6.73
26
Paddy
2.44
0.03
27
Wetlands
189.68
2.00
28
Waterbodies
1765.40
18.61
Total
9488.00
100.00
Source: Land Use Survey 2020
Kochi Municipal Corporation
LAND USE
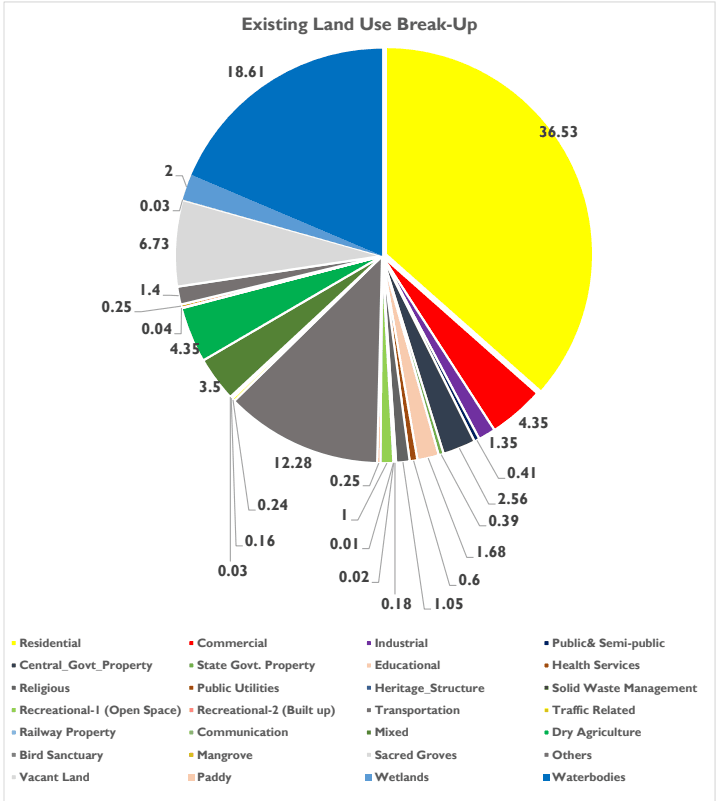
Figure 6:1 Land Use Split Up of Kochi Municipal Corporation Area Source: Land Use Survey 2020
The existing land use is shown in figure below. The most dominant land use within the planning area is Residential land use with 36.53% and 3466.42 Ha. The next major land use observed is water bodies, with an area of 1765.4 Ha and 18.61% of total area.
Kochi Municipal Corporation
LAND USE
Figure 6:2 Existing Land Use of Kochi Municipal Corporation Area Source: Land Use Survey, 2020
Kochi Municipal Corporation
LAND USE
As per URDPFI, Kochi Corporation falls under the category of a large city on the basis of population. The land use structure for a large city as percentage of developed area is shown in table below.
Table 62 Land Use Structure for a large city as per URDPFI
Sl. No
Land Use Category
Percentage of Developed Area for Large Cities
1
Residential
36-39
2
Commercial
5-6
3
Industrial
7-8
4
Public & Semi-Public
10-12
5
Recreational
14-16
6
Transport & Communication
12-14
7
Agriculture, Water Bodies and Special Areas
Balance area
Source: URDPFI Guidelines, 2015
On comparison to the standards Residential land use as percentage of developed area falls at 46.2% which is above the range as specified in the guidelines. Commercial land use amounts to 5.5% which again falls just within the prescribed range. Industrial land use is only 1.7% whereas the prescribed range is between 7 to 8 %. The low percentage denotes that the potential for industrial development is low within the planning boundary. However, the city has prominent industries located along it’s immediate periphery outside the administrative boundary of Kochi Corporation. This factor coupled with the presence of an all-weather port and container terminal, helps negate the low percentage. Transportation and Communication kland use falls above the prescribed range. However Public & Semi-Public land use as well as Recreational land use falls short from the desired range. Mixed land use amounts to 3.5% of the total area. Land is a scarce resource within the planning area as a considerable percentage of land falls under uses such as water bodies, wetlands etc.
All the land uses in the municipal corporation area, their characteristics, and distribution are analysed in the following section. The distribution and concentration pattern of each of the land use is analysed with the help of ‘Land use Concentration Index (LCI), derived for each Division. The Division wise Land Use Concentration Index indicates the concentration of a particular land use in the Division in comparison to other Divisions in the municipal area. The value of CI of a particular land use, if greater than one, indicates that the land use under consideration is relatively more concentrated in that Division, than other Divisions in the town. The Concentration Index of a particular land use is calculated as follows.