The number of workers in the Kochi corporation in 2011 is 2.28 lakhs, which is 18.33% of the total workers in Ernakulam District (12.49 lakhs). The chart provides the temporal variation in the number of workers in the district and its urban and rural areas, along with that of the Corporation. The number of workers has been increasing temporally. It can be seen that the number of workers in urban areas of Ernakulam has seen a significant increase in the urban workers from 1991 to 2011, while the Workers in rural areas of the district has declined from 2001 to 2011. A corresponding decrease in the rural workers indicates that this change is due to reclassification of rural areas to urban areas.
It can also be observed that the rate of increase in number of workers in the urban and the district is higher than that in the rural areas, especially in the last decade, indicating that the opportunities for work in the urban areas is increasing at a higher rate when compared to the rural areas. This may also indicate the reduced employability in rural areas as well as the highly-travelling workforce of Kerala, which resides in the urban hinterland and commutes daily to the work place. When the temporal changes of work force within the district is analysed, it can be seen that a great majority of workforce belonged to the Corporation, historically. However, the number of workers in the urban part of the district is increasing at a much higher rate than the corporation, and the gap in the share of work force between the corporation and the other LSGs is decreasing, as seen in table 5.1
Kochi Municipal Corporation
EMPLOYMENT
| Year | Ernakulam District | Ernakulam Urban | Ernakulam Rural | Kochi Corporation |
|---|---|---|---|---|
| 1991 | 8,73,408 | 4,09,267 | 4,64,141 | 1,69,370 |
| 2001 | 11,17,091 | 5,05,823 | 6,11,268 | 2,04,325 |
| 2011 | 12,49,343 | 8,31,346 | 4,17,997 | 2,28,968 |
Source: Census data
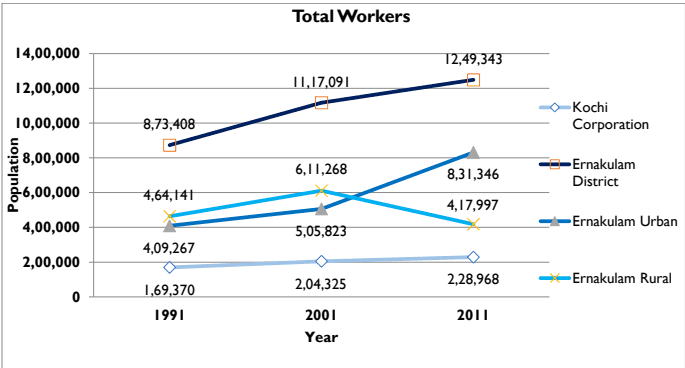
Figure 5:1 Temporal variation of workers in planning area in comparison with the region Source: Census data
When the changes in the other urban local governments in Ernakulam district are studied, it can be seen that Thripunithara has traditionally accounted for highest number of workers followed by Kalamassery and Maradu. These three LSGs show the highest rate of growth in the number of workers in the last decade as well and is shown in table 5-2 and figure 5-2 .
| District/LSG | 1991 | 2001 | 2011 |
|---|---|---|---|
| Kochi Corporation | 1,69,370 | 2,04,325 | 2,28,968 |
| Aluva | 7583 | 7790 | 7798 |
| North Paravur | 8133 | 9369 | 10560 |
Kochi Municipal Corporation
EMPLOYMENT
| Kothamangalam | 10843 | 13537 | 14675 |
|---|---|---|---|
| Angamaly | 9618 | 12199 | 12606 |
| Thripunithura | - | 21249 | 27700 |
| Eloor | 9471 | 10133 | 11490 |
| Muvattupuzha | 4943 | 9469 | 10756 |
| Perumbavoor | 7484 | 8790 | 9816 |
| Maradu | 10018 | 13569 | 16903 |
| Piravam | 7826 | 10592 | 10173 |
| Koothatukulam | 5574 | 7508 | 7074 |
| Thrikkakara | 16159 | 23444 | 28782 |
| Kalamassery | 16521 | 21366 | 26454 |
Source: Census data
Temporal variation of workers in other urbal local bodies in comparison to the Corporation
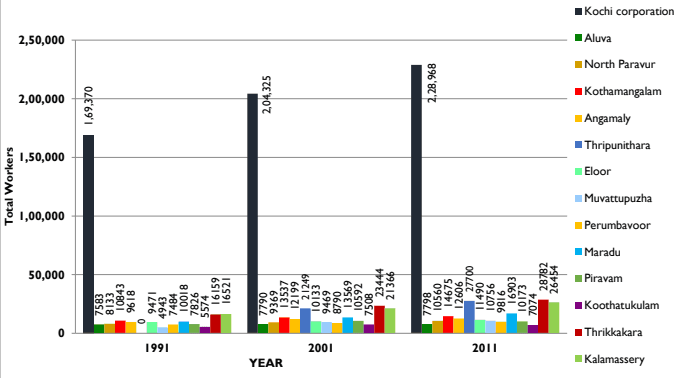
Figure 5:2 Temporal variation of workers in the constituent LSGs in comparison to Corporation Source: Census data
The total labour force may be classified into three categories. They are the main workers, the marginal workers who work for less than 6 months per year and the unemployed (non-workers). When the main-marginal composition of workers in 2011 is studied, it can be seen that 91.8% of the workers in Corporation area are main workers. It can be seen from the
Kochi Municipal Corporation
EMPLOYMENT
chart below that the Corporation area have low shares of marginal workers when compared to the district, the urban average and rural average of the district. This indicates that the corporation provides its workers with work for most of the year, when compared to the urban and rural areas of the district.
Percentage of Main and Marginal Workers in comparison with the region
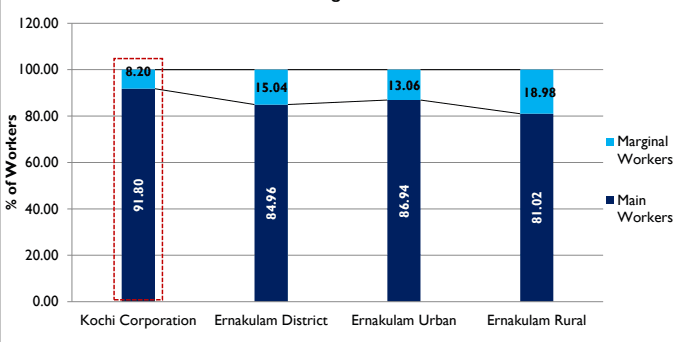
Figure 5:3 Percentage of Main and Marginal Workers in comparison with the region Source: Census 2011
| Workers | Kochi Corporation | Ernakulam District | Ernakulam Urban | Ernakulam Rural |
|---|---|---|---|---|
| Main Workers | 210191 | 1061388 | 722738 | 338650 |
| Marginal Workers | 18777 | 187955 | 108608 | 79347 |
Source: Census 2011
When the main-marginal share of workers of the LSGIs in the District is studied, it can be observed from the Figure 5-4, that Piravam has the least proportion of main workers whereas Muvattupuzha has the highest. It can be seen that Piravam and Perumbavoor has the least number of main workers, 20%-22% are marginal workers.
88
Kochi Municipal Corporation
EMPLOYMENT
| District/LSG | Main Workers | Main Workers(%) | Marginal Workers | Marginal Workers(%) | Total Workers |
|---|---|---|---|---|---|
| Kochi Corporation | 210191 | 91.80 | 18777 | 8.20 | 2,28,968 |
| Aluva | 7082 | 90.82 | 716 | 9.18 | 7798 |
| North Paravur | 9139 | 86.54 | 1421 | 13.46 | 10560 |
| Kothamangalam | 12226 | 83.31 | 2449 | 16.69 | 14675 |
| Angamaly | 10872 | 86.24 | 1734 | 13.76 | 12606 |
| Thripunithara | 25013 | 90.30 | 2687 | 9.70 | 27700 |
| Eloor | 9251 | 80.51 | 2239 | 19.49 | 11490 |
| Muvattupuzha | 9916 | 92.19 | 840 | 7.81 | 10756 |
| Perumbavoor | 7802 | 79.48 | 2014 | 20.52 | 9816 |
| Maradu | 15335 | 90.72 | 1568 | 9.28 | 16903 |
| Piravam | 7934 | 77.99 | 2239 | 22.01 | 10173 |
| Koothatukulam | 5787 | 81.81 | 1287 | 18.19 | 7074 |
| Thrikkakara | 25291 | 87.87 | 3491 | 12.13 | 28782 |
| Kalamassery | 23851 | 90.16 | 2603 | 9.84 | 26454 |
Source: Census 2011
89
Kochi Municipal Corporation
EMPLOYMENT
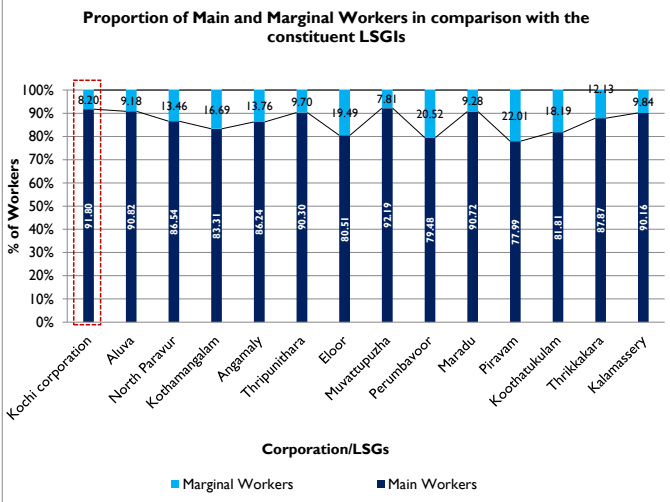
Figure 5:4 Proportion of Main and Marginal Workers in comparison with the constituent LSGIs Source: Census data
When the temporal change of marginal workers is analysed (Figure 5-5), it can be observed that their number in the constituent LSGs witnessed a significant decline from 2001- 2011.
Apart from Kochi Corporation; When the trends in other LSGIs in the District is studied, it can be seen that the number of main workers is the highest in Thrikkakara, followed by Thripunithara, Kalamssery, Maradu, Kothamangalam, Angamaly, Muvattupuzha, Eloor, Paravur, Piravam, Perumbavoor, Aluva and Koothatukulam. Similar to the trend in number of workers, the corporation has the highest share of main workers historically. The number of marginal workers in the Corporation area shows a decline in 2001-2011. While closely analysing the LSGIs within the District, it can be seen that all the LSGIs also follow the same trend. The decline in agriculture and traditional industries in the region would have resulted in this incline in 1991, followed by the employment generated by service sector as well as other industries resulting in the high in 1991. Thus from Table 5-5; it is found that, the share of the marginal workers is decreasing and that of the main workers is increasing temporally in the corporation area and LSGs.
Kochi Municipal Corporation
EMPLOYMENT
| Corporation/LSG | Main workers | Marginal Workers | ||||
| 1991 | 2001 | 2011 | 1991 | 2001 | 2011 | |
| Kochi corporation | 1,62,654 | 182189 | 210191 | 6716 | 22136 | 18777 |
| Aluva | 7,451 | 7238 | 7082 | 132 | 552 | 716 |
| North Paravur | 7,865 | 8276 | 9139 | 268 | 1093 | 1421 |
| Kothamangalam | 9,966 | 11477 | 12226 | 877 | 2060 | 2449 |
| Angamaly | 8,984 | 9603 | 10872 | 634 | 2596 | 1734 |
| Thripunithara | - | 18445 | 25013 | - | 3098 | 2687 |
| Eloor | 8,229 | 8472 | 9251 | 1242 | 1661 | 2239 |
| Muvattupuzha | 4,772 | 8395 | 9916 | 171 | 1074 | 840 |
| Perumbavoor | 6,965 | 7869 | 7802 | 519 | 921 | 2014 |
| Maradu | 9,804 | 11805 | 15335 | 214 | 1764 | 1568 |
| Piravam | 7,496 | 7973 | 7934 | 330 | 2619 | 2239 |
| Koothatukulam | 4,801 | 5571 | 5787 | 773 | 1937 | 1287 |
| Thrikkakara | 15,218 | 19312 | 25291 | 941 | 4132 | 3491 |
| Kalamassery | 15,771 | 18562 | 23851 | 750 | 2804 | 2603 |
Source: Census Data
Kochi Municipal Corporation
EMPLOYMENT
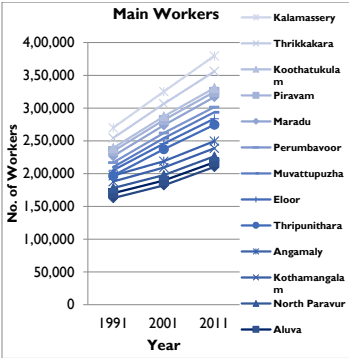
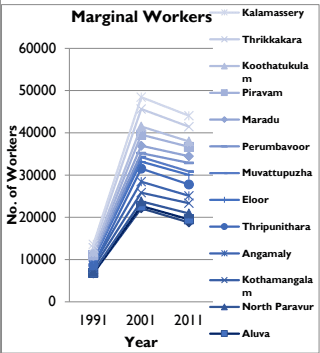
Figure 5:5 Temporal variation of main and marginal workers in the constituent local governments Source: Census data