Kochi Corporation serves as a major center of economic activities with its influence area extending beyond its administrative boundary. The convergence of roads, railways, waterways, airways and the port contributes to the city to make it the most important node in the state for economic development with a high floating population percentage. As the transportation sector is a vital component of any city, planning of transportation infrastructure incorporating the increased travel demand and vehicle population is an essential requirement.
Transportation System in Kochi
Kochi is one of the few cities that is served by all major modes of transport viz road, rail, air, metro and water. Road network has a wide presence throughout the study area owing to its extent and suitability to all terrain conditions. The rail network has a limited but dominating influence. Air network has a supplementary role with waterways currently being fully utilized to its potential.
8.4.3Inter-City Goods Traffic by Road
The transportation planning of a city has to take into account the impact of both passenger and goods traffic over the road system. As part of the study, detailed study of the goods traffic was carried out to assess the quantum of goods carrying vehicles entering and existing the city along with the characteristics of goods such as their origin and destination, nature of goods, quantity and type of vehicles used and goods traffic demand of different zones in the city. The findings of the study are summarized in the following sections.
8.4.3.1 Origin Destination Matrix of Goods Traffic
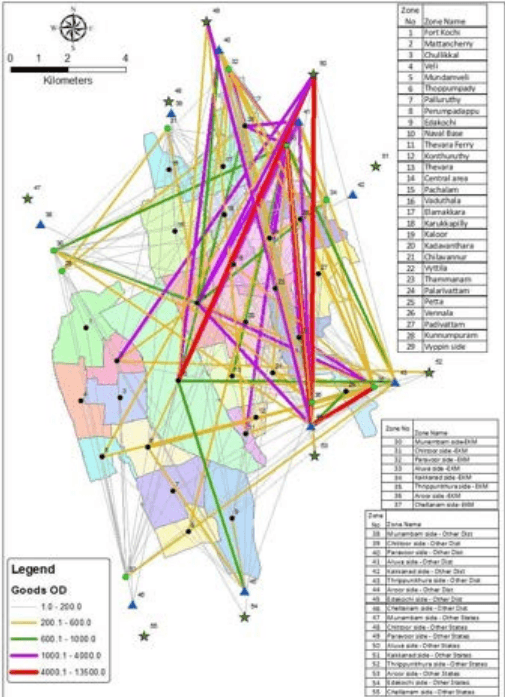
Origin destination matrix of inter-city goods traffic is given in Table 7.12 and presented as desirelines in Figure 7.4. It could be seen that 35% of the trips were generated from Kochi city, 35% of trips from Ernakulam district, 17% from other districts and 10 percent from other States. Within the City, Kochi port area contributed to 17%and Central area with 8%. Within district, 13% were generated by Aluva side and 14% by Petta side. Regarding other states, 8%
Kochi Municipal Corporation
TRANSPORTATION
were generated by Tamil Nadu on Aroor side. Almost similar trend was noticed in the case of traffic attraction also.
Figure 8:15 Desire Lines of Goods Traffic
Source: NATPAC, Traffic survey, 2019
8.4.3.2 Modal split of Goods Traffic by road
Inter-city goods traffic in the study region was handled by a number of goods vehicles consisting of 10,440 trucks, 11,802 mini-trucks/tempos and 8,305 goods auto. Goods traffic to the tune of 1.13 lakh metric tons were transported to various destinations, of which the
Kochi Municipal Corporation
TRANSPORTATION
share of mini trucks constituted 42 % (62,605 MT), followed by trucks 37% and goods autos 21%. The data pertaining to mode wise goods traffic are given in table below.
Table 811 Modal split of intercity goods traffic by road in Kochi city
Sl.No
Mode
No.of Vehicles
Goods Carried (MT)
1
Truck
10,440
42,337
2
Mini Truck
11,802
47,055
3
Goods auto
8,305
23,660
Total
30,547
1,13,052
Source: NATPAC study report, 2019
8.4.3.3 Pattern of Goods Traffic
An analysis of pattern of inter-city goods traffic through Kochi City reveals that bulk of goods vehicles (63%) either originated from or terminated in Kochi city. As high as 36 per cent of the goods vehicles were found to be bypassing the city. Details of goods traffic pattern according to mode of travel is shown below
Table 812 Pattern fo Goods traffic movement in Kochi City
Sl.No
Pattern
Goods Carried (MT)
Percentage (%)
1
Internal - Internal
1,686
1.49
2
Internal- External
37,426
33.11
3
External - Internal
33,550
29.68
4
External - External
40,390
35.73
Total
1,13,052
100
Source: NATPAC study report, 2019
8.4.3.4 Commodities Transported
Of the about 30,000 goods vehicle trips encountered at the outer cordon survey points, nearly one-fifth of the vehicles (6,600) were empty vehicles. In the remaining vehicles, construction materials were carried out in large quantities which accounted for about 37% of total tonnage, followed by 15% each of petroleum products and agricultural products and 10% of industrial goods. the distribution of goods vehicle trips through outer cordon points according to commodity carried in Kochi City is given in Annexure
8.4.3.5 Inter-city Vehicular traffic by Road
An analysis of OD survey data was made to assess the number of vehicles passing through various outer cordon locations in the city after eliminating number of vehicles passing through more than one survey stations. Different categories of vehicles were brought into a single
Kochi Municipal Corporation
TRANSPORTATION
value called PCU by using suitable conversion factors and summarized as modal split and vehicular pattern.
Figure 8:16 Desirelines of Inter-city Vehicular Movements in Kochi City Source: NATPAC study report, 2019
Table 813 Pattern of vehicular traffic by road in Kochi city
Area
i Clktmaanryu E
e i Sdbmamanu M
i Sidhtteroo C
i Sderooarav P
i Sdleavu A
i Sddkkeanaa K
e i<sup>d</sup> <sup>S</sup><sub>iih</sub>h<sub>taranpru</sub> T
66iH Naroor v A
H <sub>i</sub> <sup>N</sup><sub>dl</sub> <sub>oaroo</sub>r <sub>v</sub> <sub>de</sub> A i s
i Sdllhemanae C
<sup>lta</sup>o T
Ernakulam City
1,661
7340
6272
12844
32907
15061
14500
10336
6408
7926
115255
Munambam Side
5032
-
18
206
58
98
78
38
65
5592
Chitoor Side
7470
35
-
-
17
18
77
77
-
-
7694
Paravoor Side
7607
110
33
897
374
899
599
66
39
10625
Aluva Side
26,828
328
44
1111
607
1169
4945
27
101
35160
Kakkanad Side
13,601
40
11
263
325
-
293
389
15
59
8.4.3.6 Inter-city Passenger traffic by Metro
Eight out of 21 metro stations lie outside Kochi Corporation limits. An analysis of metro passenger with regard to intra city and inter-city reveals that out of 65,622 metro passengers handled at the metro stations, 3,840 commuters performed their trips outside Kochi city and 34,080 within Kochi city. Inter-city commuters were only 27,702 constituting 42% of the total commuters. Edappally and Maharajas stations generated as well attracted most of the intercity commuters.
8.4.3.7 Inter-city Passenger traffic by train
Inter-city passenger movements to the extent of about 75,000 were performed by train from both north and south railway stations in a day. Out of these passengers, 7% were found to be inter-State passengers, 43% travelled to other districts and seven percent to places within Ernakulam district.
8.4.3.8 Inter-city Passenger traffic by boat
There are 11 operational boat jetties in and around Kochi city, out of which three – Mulavukadu, Kakkanad, Varappuzha - are located outside corporation limits. Out of an estimated 15,670 passengers using the boat services for their travel in Kochi city, only around 720 passengers make inter-city travel connecting Kochi city with terminals located outside the city limits.
8.4.3.9 Modal Split of Inter-city Commuters
An estimated 9.86 lakh passengers performed inter-city trips in Kochi city; majority of them (42%) travelled by bus, followed by 24% in car, 18% in two wheeler, 8% by train etc. in the order. Hardly 3% of passengers used metro for their inter-city travel needs.
Table 814 Modal Split of Inter-city commuters
Sl.No
Mode
No. of
Percentage (%)
1
Bus
412,986
41.87
2
Car
232,729
23.60
3
Passenger Auto
54,837
5.56
4
Two Wheeler
182,313
18.48
5
Train
74,996
7.60
6
Metro
27,702
2.81
7
Boat
720
0.07
Total
986,283
100
Source: NATPAC study report, 2019
Kochi Municipal Corporation
TRANSPORTATION
14997
Thrippunithara side
14,688
321
74
805
1267
204
2875
96
164
20494
Aroor via NH 66 side
10,542
248
87
545
4767
590
2037
-
-
18818
Aroor via old NH side
7,312
24
14
59
48
14
45
13
-
2
7529
Chellanam Side
4,088
84
-
4
36
17
98
17
-
-
4353
Total
98830
8530
6535
15649
40469
16943
19216
19339
6649
8356
240517
Source: NATPAC study report, 2019
It could be seen that most of the vehicles other than buses terminated in the study region. They accounted for 88 % of the 2.4 lakh PCU vehicles that crossed the nine survey locations. Only 12% of the vehicles were found to be through vehicles.
Kochi Municipal Corporation
TRANSPORTATION
8.4.1Origin-Destination survey at outer codon locations on road
Origin-destination surveys and link volume surveys were conducted to study the inter-city passenger and goods movement pattern in Kochi city. An analysis of these traffic movements will give the proportion of bye-passable traffic along with the major external interaction areas. The survey was conducted at nine entry/exit points of the city. The list of the cordon points are given in the table below.
Table 85 List of Outer Cordon Survey Locations in Kochi city
Sl.No
Name of Location
Name of Road
1
Near Vyppin
High Court -Vyppin - Munambam road
2
Near Vaduthala bridge
Chittoor road
3
Near Kunnumpuram
NH-66: Paravoor road
4
Edappally bridge
NH-544: Aluva road
5
Alinchuvadu
Kakkanad road
6
Petta bridge
Thrippunithura road
7
Chembakkara bridge
NH-66 Bypass
8
Aroor Old bridge
Old NH-66
9
Corporation boundary
Chellanam road
Source: NATPAC study report, 2019
O-D surveys were carried out continuously for a period ranging from 16 to 24 hours on a normal working day depending upon the intensity of traffic flow. During the survey, passenger and goods vehicles were stopped at random with the help of police to collect trips particulars of the traveling public and motor vehicles. Particulars like origin of trip, final destination, travel
Kochi Municipal Corporation
TRANSPORTATION
distance, number of passengers in the vehicle, purpose of journey, occupation etc., were collected from the passenger vehicles crossing the survey station. In the case of goods vehicles, details like origin and destination of goods traffic, type of commodity carried, quantity carried etc. were collected. An analysis of the survey data has revealed the proportion of inter-city traffic that could be diverted from the town roads. Besides this, the analysis has identified the major traffic generating points within the influence area of the town.
8.4.1.1 Inflow and Outflow of vehicular traffic
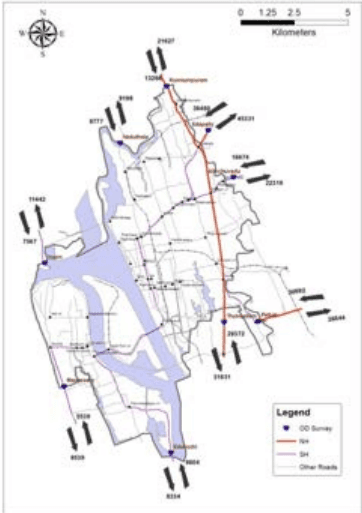
The outer-cordon survey of vehicles entering and exiting Kochi city revealed that during the survey period of 24 hours, the maximum of 72,000 PCU of vehicles either entered or exited the City through Pathadipalam located on Ernakulam – Thrissur NH-544, followed by 50,000 PCU of vehicles each through Thykkoodam on Ernakulam – Alappuzha NH 66 and Petta on Ernakulam -Thrippunithura road, 45,000 through Alinchuvadu on Ernakulam – Kakkanad road, 33,000 PCU through Kunnumpuram on Ernakulam – Paravoor NH 66.Other surveys locations witnessed traffic between 18,000 and 22,000 PCU only.
Figure-8:12 Inbound and outbound traffic in PCU at outer cordon locations Source: NATPAC study report, 2019
Kochi Municipal Corporation
TRANSPORTATION
8.4.1.2 Zoning Pattern adopted for the study
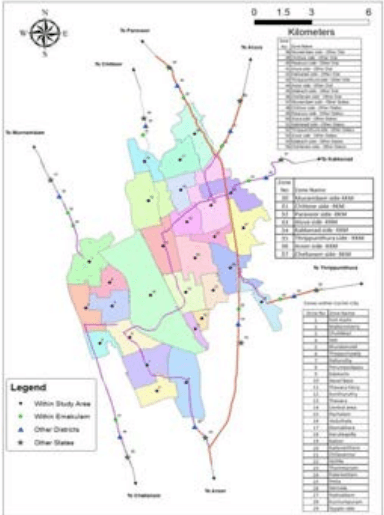
The study area and the surrounding regions were divided into traffic zones for spatial distribution of traffic within the study region. The Kochi Corporation area has been divided into 29 internal zones corresponding to the one or more wards of the city. The area outside the Corporation limits has been divided into 26 outer zones. The zoning of outside city has followed survey location wise intra district, inter district and interstate regions. Accordingly, first nine zones are intra district, next eight zones are outside Ernakulam district but within Kerala State and the rest are outside State. The zoning pattern would help to identify the traffic distribution within the district, inter-district and inter-state movement.
Figure 8:13 Zoning Pattern adopted for the study in Kochi City Source: NATPAC study report, 2019
8.4Inter-City Travel Characteristics
Inter-city movement of passenger and goods movements were handled by road based goods vehicles, trains, boats and Kochi metro. In order to capture these movements, data from both primary surveys as well as secondary data were compiled in Kochi city.Secondary data pertaining to rail passengers handled by both Ernakulam south and north stations were compiled from concerned railway stations. Regarding boat trips and the passengers handled were obtained from State Water Transport Department, Ernakulam. In respect of metro passengers, data were provided by Kochi Metro Rail Ltd, Ernakulam. Primary surveys like volume survey and origin destination surveys were conducted at all the outer cordon survey locations in Kochi city.
8.4.2Inter-City Passenger Traffic by Road
An analysis of OD survey data was carried out to assess major traffic generation/ attraction points in the city and outside, modal split of inter-city passenger traffic as well as the pattern of vehicular traffic whether it is internal-internal, internal-external, external-internal or
Kochi Municipal Corporation
TRANSPORTATION
external-external, characteristics of trips makers etc. The results of the analysis are discussed below;
8.4.2.1 Origin Destination Matrix of Passengers
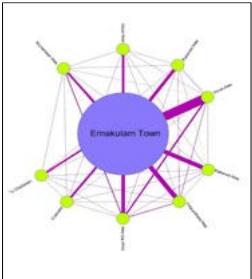
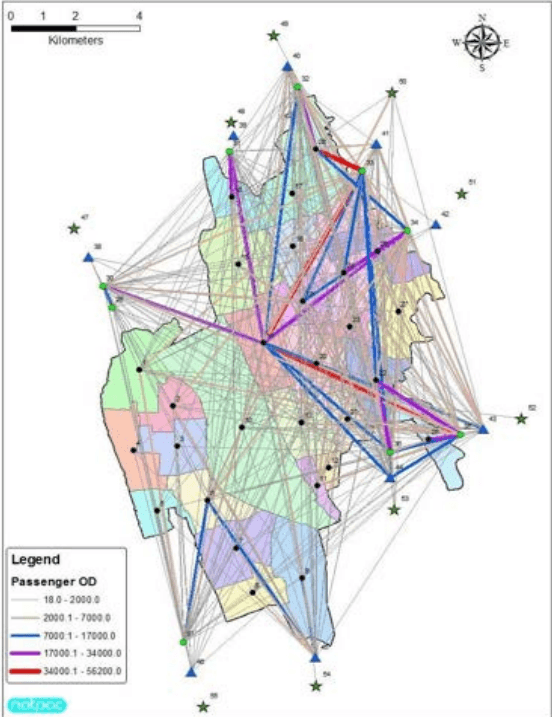
The origin destination matrix of inter-city passengers were developed and presented as desire lines as shown below.
Figure-8:14 Desirelines of Inter-city Road Passengers in Kochi City Source: NATPAC study report, 2019
Kochi Municipal Corporation
TRANSPORTATION
It could be seen that 45% of the trips were generated from Kochi city, 43% of trips from Ernakulam district, 10% from other districts and hardly 1% from other States. Within the City, central area contributed to 12% followed by Edappally area with 7% and Vyttila area with 3%. Within district, 12% were generated by Thrippunithura side, 10% by Aluva side and 6% by Kakkanad side. Almost similar trend was noticed in the case of traffic attraction also.
8.4.2.2 Modal Split of Passenger Trips by Road
It is estimated that 8.83 lakh passenger trips were performed in the study region by various modes of traffic. Buses carried the maximum of passengers with about 47%, followed by 26% by cars, 21% by two wheelers and 6 % by autos.
Table 86 Modal Split of inter-city passenger traffic in Kochi City
Sl.No.
Mode
No.of Passengers
Percentage (%)
1
Bus
412,970
46.78
2
Mini-bus/car
232,729
26.36
3
Auto-rikshaw
54,837
6.21
4
Two-Wheelers
182,290
20.65
Total
882,827
100
Source: NATPAC study report, 2019
8.4.2.3 Pattern of Passenger Trips by Road
An analysis of movement pattern of passengers through the outer cordon survey locations shows that about 45% and 43% of passenger trips were external to internal and internal to external trips respectively and 12% of passengers are through trips, which have no business in the City
Table 87 Pattern of Passenger Traffic in Kochi City
Sl.No.
Mode
No.of Passengers
Percentage (%)
1
Internal - internal
6,709
0.76
2
Internal - External
397,080
44.98
3
External - Internal
376,370
42.63
4
External - External
102,668
11.63
Total
882,827
100
Source: NATPAC study report, 2019
279
8.4.2.4 Purpose of Passenger Trips by Road
In the transport planning process, purpose of trip is an important input in land use modelling and travel demand modelling. Inter-city trips are broadly classified into six purposes including work, education etc. In Kochi City, inter-city passenger trips to the tune of 5.78lakh person
Kochi Municipal Corporation
TRANSPORTATION
trips were performed for work purpose. This formed nearly 66% of the total inter-city passenger movement. The work trips were followed by 1.18 lakh social and recreation trips (13%), shopping trips (5%), and medical trips (3%). Table 8 12 gives the distribution of intercity passenger trips through outer cordon points according to purpose of trips in Kochi.
Table 88 Purpose of Passenger Trips in Kochi City
Sl.No
Purpose
No.of Passengers
Percentage (%)
1
Work
5,78,670
65.55
2
Education
16,016
1.81
3
Social
1,01,854
11.54
4
Recreation
40,601
4.60
5
Medical
28,519
3.23
6
Shopping
43,973
4.98
7
Others
73,194
8.29
Total
8,82,827
100
Source: NATPAC study report, 2019
8.4.2.5 Frequency of Passenger Trips by Road
The distribution of frequency of passenger trips were analyzed to study the trip behavioral characteristics. The frequency of trips made by the passengers show that about 64% were daily passengers, followed by 10% bi-weekly and 9% were weekly passengers. Table below gives the mode-wise distribution of inter-city passenger trips through outer cordon points according to frequency of trips in Kochi City.
Table 89 Frequency of Travel of Inter-City Passenger Trips by Road
Sl.No
Frequency
No.of Passengers
Percentage(%)
1
Daily
5,65,921
64.10
2
Alternate day
88,641
10.04
3
Weekly
79,034
8.95
4
Monthly
61,101
6.92
5
Occasionally
88,129
9.98
Total
8,82,827
100
Source: NATPAC study report, 2019
8.4.2.6 Occupation of Passenger Trips by Road
The occupational status of inter-city passengers was ascertained from the O-D survey conducted at outer-cordon points. It has been observed that persons working in the private
Kochi Municipal Corporation
TRANSPORTATION
service constituted the major segment (37 percent) of the inter-city passengers, followed by business people with 17 per cent of the total passengers. Casual laborers and Government employees constituted 16% and 11% respectively. Table 8 14presents distribution of inter-city passenger trips by road according to occupational status.
Table 810 Occupation of Inter-City Passengers by Road