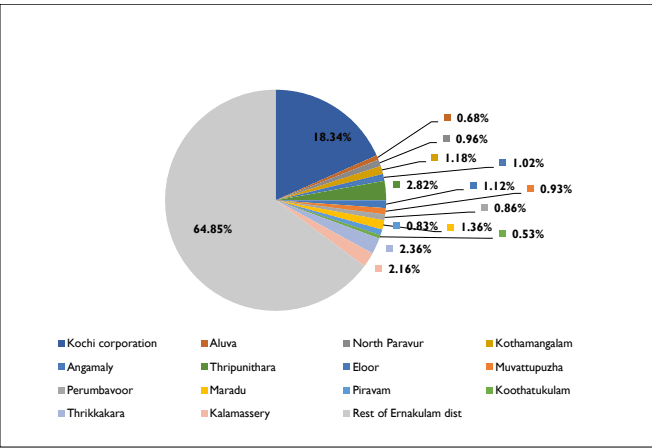
The Demographic parameters help in understanding the pattern of population within a city. This chapter gives a brief account on the Population size, Population density and other demographic aspects.Ernakulam district has the credit of being the economic nerve centre of the state. It is the industrially advanced and flourishing district of Kerala. According to 2011 Census, Ernakulam district has a population of 3,282,388 persons with an average density of 1,072 persons per sq. km. Out of the total Ernakulam population as per 2011 census, 35.15% lives in urban regions of district. Figure below shows percentage share of population in Kochi and other urban local bodies, Ernakulam district.
Figure 4:1 Percentage share of population in Kochi and other urban local bodies, Ernakulam district. Source : Census 2011
As per census 2011, the population of Kochi Municipal Corporation is 602046 which amounts to 18.34% of the total population in the district. Area wise, Kochi Corporatiom amounts to just over 3% of the total area of the district. When compared to the other urban local bodies
Kochi Municipal Corporation
DEMOGRAPHY
in the district, Kochi has the highest share of urban population in the District, even higher than the total share of population of other urban local bodies in the district. Percentage share of population of Kochi Municipal Corporation and that of Eranakulam District is shown in figure 4.2.
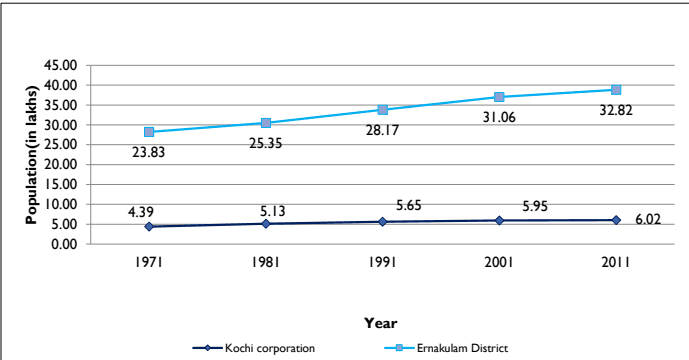
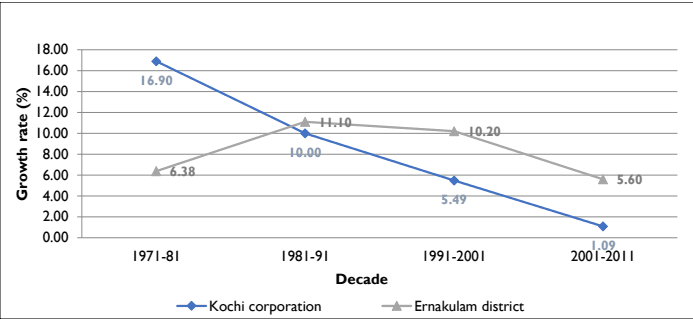
The municipal population is also growing in a very slow pace. It is evident that the growth within the municipal limits is witnessing saturation .The variation of the population from 1971 onwards, in comparison with the District is shown in figure below.The population for Kochi Municipal Corporation had increased from 4.39 lakh in 1971 to 5.95 lakh in 2001 and eventually reached 6.02 lakh in 2011. Table 4-1 shows population growth trend of Eranakulam District and Kochi Municipal Corporation.
Figure 4:2 Temporal variation of population of Kochi and Ernakulam district 1971-2011 Source: Census data
Table 41 Population growth trend of Ernakulam District and Kochi Corporation (1971-2011)
Name / Year
Population per year
1971
1981
1991
2001
2011
Kochi corporation
439066
513249
564589
595575
6,02,046
Ernakulam District
2383178
2535294
28,17,236
31,05,798
32,82,388
Source: Census data
Kochi Municipal Corporation
DEMOGRAPHY
Population Size
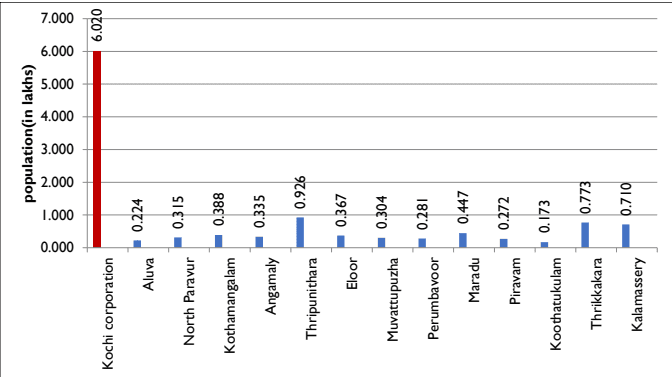
Kochi Municipal Corporation being the only first order settlement in the district is the most highly populated urban local body in the district as shown in the figure below. It has a geographical area of 94.88 Sq.km. Its population is more than 6 folds the highest populated Thripunitura and 35 times the least populated Koothattukulam among the other urban local bodies in the district. Figure 4-3 shows the comparison and Table 4-2 shows population of Kochi Corporation area and other urban local bodies in Eranakulam District
Figure 4:3 Comparison of the population of Kochi Municipal Corporation with other Urban Local Bodies in the district Source: Census 2011
Table 42 Population of Kochi corporation area and other urban local bodies in Ernakulam District
LSG's
2001
2011
Kochi corporation
595575
602046
Aluva
24110
22428
North Paravur
30059
31503
Kothamangalam
37173
38837
Kochi Municipal Corporation
DEMOGRAPHY
Angamaly
33409
33465
Thripunithara
59884
92550
Eloor
35573
36722
Muvattupuzha
29246
30397
Perumbavoor
26547
28110
Maradu
41012
44704
Piravam
27263
27229
Koothatukulam
17253
17253
Thrikkakara
65984
77319
Kalamassery
63116
71038
Source: Census data
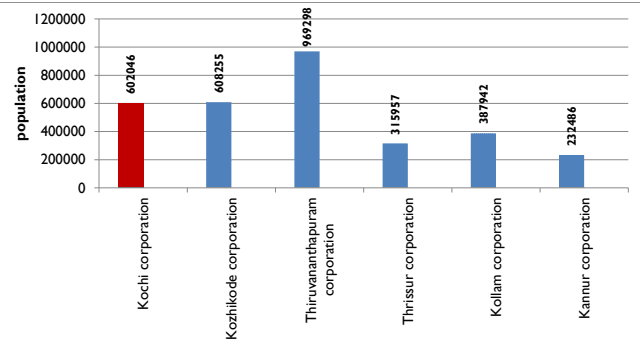
It is the third highly populated municipal corporation in the state after Thiruvananthapuram corporation (969298) and Kozhikode corporation (608255) as shown in figure below. Kannur being the recently formed municipal corporation has the least population among the municipal corporations.
Figure 4:4 Comparison of Population of Kochi with other municipal corporations in the state-2011 Source: Census -2011
Kochi Municipal Corporation
DEMOGRAPHY
Population Growth Rate
Kerala started showing a constant decline in population growth rate since 1981 census. The net addition to the population has also been continuously less ever since. The population growth rate of the state in the last decade (2001-2011) is 4.86, less than the growth rate of 1991-2001. The growth of population during 2001-2011 has declined in all the districts of the State including Ernakulam, when compared to the growth rate in 1991-2001. Even so, Ernakulam district is among those districts having population growth rate of 5.69, higher than the State average during 2001-2011, together with Kasaragod, Malappuram, Palakkad and Kozhikode, all of which fall in the middle and North Kerala. (Source: Census 2011).
In the recent years due to many large scale development projects, especially in the construction sector and information technology, substantial employment opportunities are generated in Kochi and this is a positive factor for migration. However, sharp increase in land values and scarcity of developable land prevent lower and middle income group families from buying land within the city for residential purposes. This has made a good percentage of people to opt for residences in the outskirts of the city. Though the trend reduces migration, it increases floating population in the city.
The contributing factors of population growth in the area are mainly the natural increase and the migration from nearby rural areas for trade and employment. Even though the natural growth rate of population does not show exorbitant increase, floating population and migration in Kochi are to be considered while proposing infrastructure requirements. Facility for daily commutation from the region around adds to the increased number of floating population in the city.
Population growth from 1971 to 2001 shows a gradual decreasing trend in the corporation in tune with the Urban Local bodies. Declassification of some of the urban settlements of 1991 and the resultant reduction in urban areas is a major factor leading to this situation. This is a pattern of urban growth contrary to the popular belief that there is in migration of people into the urban area. Table 4.6 shows the temporal variation of decadal population growth rates of Kochi Municipal Corporation with that of Ernakulam district.
The comparison of decadal growth rate with other local bodies in the district is shown in Figure 4-7. The growth rate of Kochi Municipal Corporation decreased from 10% in 1981-91 to 1.09% in 2001-11. The present decadal population growth rate of Kochi city is 1.09 %, which is very low when compared to the decadal growth rate of the district and state being 5.6% and 4.87%.
Kochi Municipal Corporation
DEMOGRAPHY
Figure 4:5 Temporal variation of Decadal population growth rates of Kochi Municipal Corporation and Ernakulam District 1971-2011 Source: Census -2011
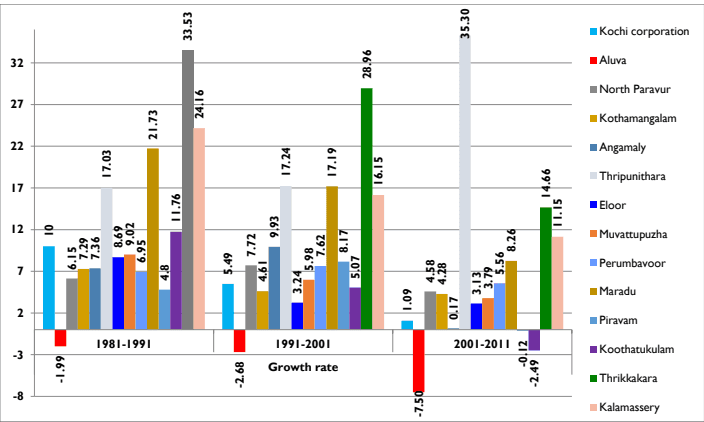
When compared to the other urban local bodies in the district, Kochi has a very low decadal population growth rate. Neighbouring towns like Thripunithura, Thrikkakkara and Kalamassery are the fastest growing urban local bodies in terms of population with growth rates of 54.55%, 17.18% and 12.55%.The high growth rate of Thripunitura is associated with the change in its administrative area after adding Thiruvamkulam to it. However the growth rates of all these urban local bodies show a declining trend with Aluva, Piravom and Koothattukulam showing negative growth rates. Table 4-3 shows the population growth rates of other urban local bodies in the district for the past three decades. This is graphically represented in Figure below. The lower growth rate in Kochi Corporation area can be attributed to the increasing land value, thereby forcing people to settle in the suburbs. Since the urban spread has extended far beyond the limits of the corporation area and availability of better transportation facilities to connect with the corporation area have increased, more and more people are attracted to settle in the neighbouring local bodies also. This can also be a rationale behind lower growth rate of Kochi Corporation.
Table 43 Population Growth rates of urban local bodies in Ernakulam District 1981-2011
LSGs
Population
Growth rate
1981
1991
2001
2011
1981-1991
1991-2001
2001-2011
Kochi corporation
513249
564589
595575
602046
10
5.49
1.09
Aluva
25278
24774
24110
22428
-1.99
-2.68
-7.50
Kochi Municipal Corporation
DEMOGRAPHY
North Paravur
26288
27906
30059
31503
6.15
7.72
4.58
Kothamangalam
33122
35535
37173
38837
7.29
4.61
4.28
Angamaly
28307
30391
33409
33465
7.36
9.93
0.17
Thripunithara
43646
51078
59884
92550
17.03
17.24
35.30
Eloor
31701
34455
35573
36722
8.69
3.24
3.13
Muvattupuzha
25313
27595
29246
30397
9.02
5.98
3.79
Perumbavoor
23064
24667
26547
28110
6.95
7.62
5.56
Maradu
28749
34995
41012
44704
21.73
17.19
8.26
Piravam
24048
25203
27263
27229
4.8
8.15
-0.12
Koothatukulam
15057
16828
17682
17253
11.76
5.07
-2.49
Thrikkakara
38318
51166
65984
77319
33.53
28.96
14.66
Kalamassery
43767
54342
63116
71038
24.16
16.15
11.15
Source: Census -2011
Figure 4:6 Comparison of population growth rates with other urban local bodies in the district 1981-2011 Source: Census -2011
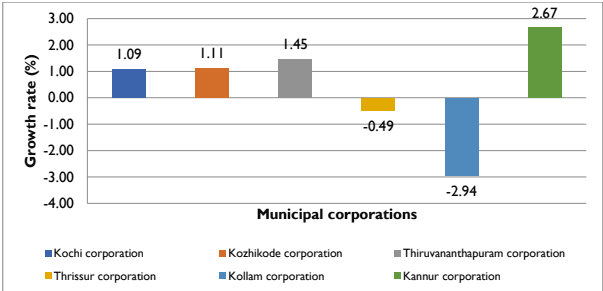
When compared with other municipal corporations,Thiruvanathapuram, Kozhikode and Kannur corporations have slightly higher population growth rates while Thrissur and Kollam exhibits negative population growth rates as shown in figure below.
Kochi Municipal Corporation
DEMOGRAPHY
Figure 4:7 Comparison of Population growth rates with other municipal corporations in the state- 2011 Source: Census -2011