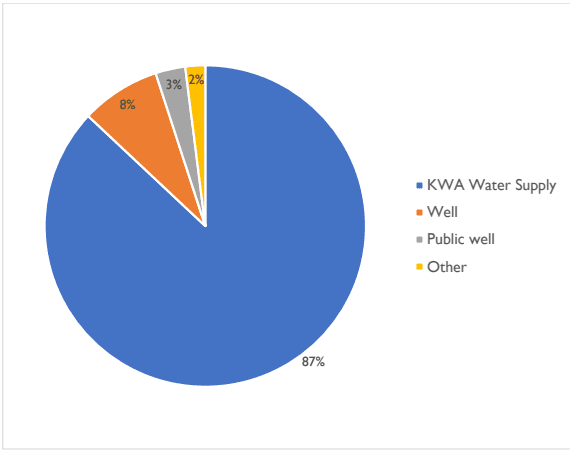
The corporation depends on Kerala Water Authority (KWA) as its main source for water supply. From the data collected through primary survey, this amounts to 87% of the total households in the Kochi corporation area. Only 8 % of households depend on well as the main source of water. The saline and brackish water especially in the western areas of the corporation makes it unsuitable for the construction of wells. While it is seen that 87% of the total households have access to water supply system, 70% of them are dependent only on KWA water supply. This underlines the importance of water supply system to cater to the needs of drinking water supply to the people of Kochi Corporation.
Figure 10:1shows the sources of water supply in Kochi Corporation. Other sources for drinking water are met with ground water and tankers as well. Along with water from KWA, people also depend on other sources due to the unavailability and seasonal scarcity.
362
Figure 10:1 Main water supply sources in Kochi Corporation area Source: Socio – Economic Survey, 2019
Kochi Municipal Corporation
WATER SUPPLY
Water Supply System
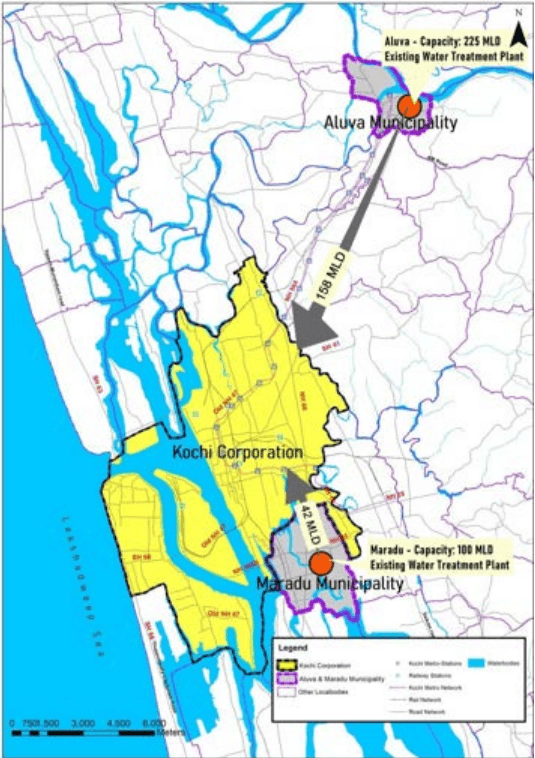
The major surface water sources for this water supply is Periyar river with head work at Aluva; and Muvattupuzha river with head works at Pazhoor. The major water supply to the Corporation area is from the Water Treatment Plant at Aluva with a capacity of 225 MLD. This water source is located approximately 20km away from the city
Figure 10:2 Quantity of water to Kochi Corpration area from Aluva and Maradu WTP’s Source: Kerala Water Aunthority
Kochi Municipal Corporation
WATER SUPPLY
In 2016 Water Treatment Plant at adjoining municipality Maradu was commissioned with a capacity of 100 MLD. Both these Water Treatment Plants presently cater to the needs of Water Supply in Kochi Corporation. As per the City Water Balance Plan for Kochi Corporation, 158 MLD and 42 MLD water is supplied Kochi Corporation area from Aluva and Maradu WTP’s respectively as shown in Figure 10:2.
10.4.1Water Treatment Plants
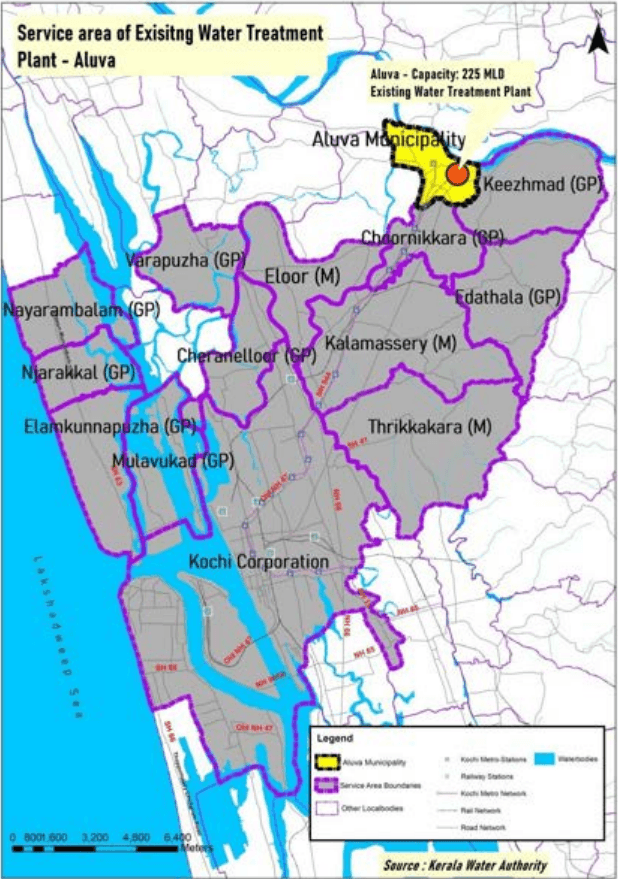
There are 4 water treatment plants working at KWA land at Aluva with a total production capacity of 225 million Litres per Day (MLD). At present 290 MLD is being produced daily with an overload of 30%. Out of these, 42 MLD is distributed from the Aluva WTP site itself from an overhead tank cum pumping to Aluva Municipality, Keezhmad GP, Edathala GP and Choornikkara GP.
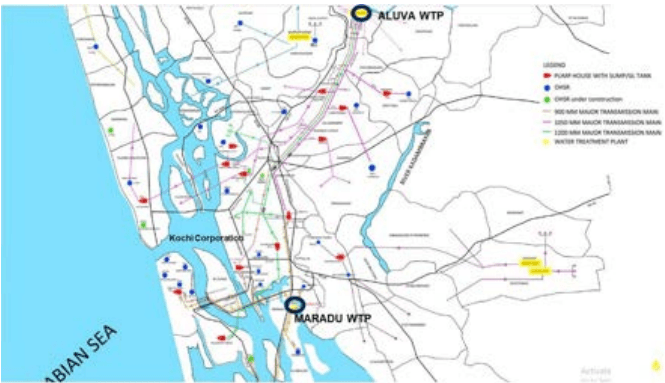
The rest quantity is supplied to Kochi Corporation, Eloor Municipality, Thrikkakara Municipality, Kalamassery Municipality, Njarakkal GP, Elamkunnappuzha GP, Nayarambalam GP, Mulavukad GP, Varappuzha GP and Cheranelloor GP and shown in figure10.3. The treated water is carried towards Ernakulam area through three major transmission mains 900 mm, 1050 mm and 1200 mm. Due to the problems in clear water transmission and distribution, there are many tappings in the major distribution pipelines coming from the existing WTPs at Aluva towards Kochi.
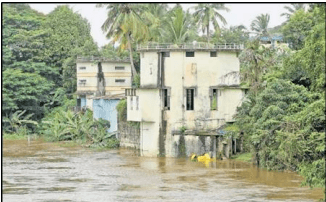
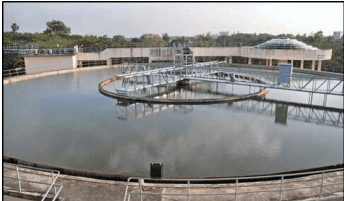
Water pumping station at Aluva & Water Treatment Plant at Maradu
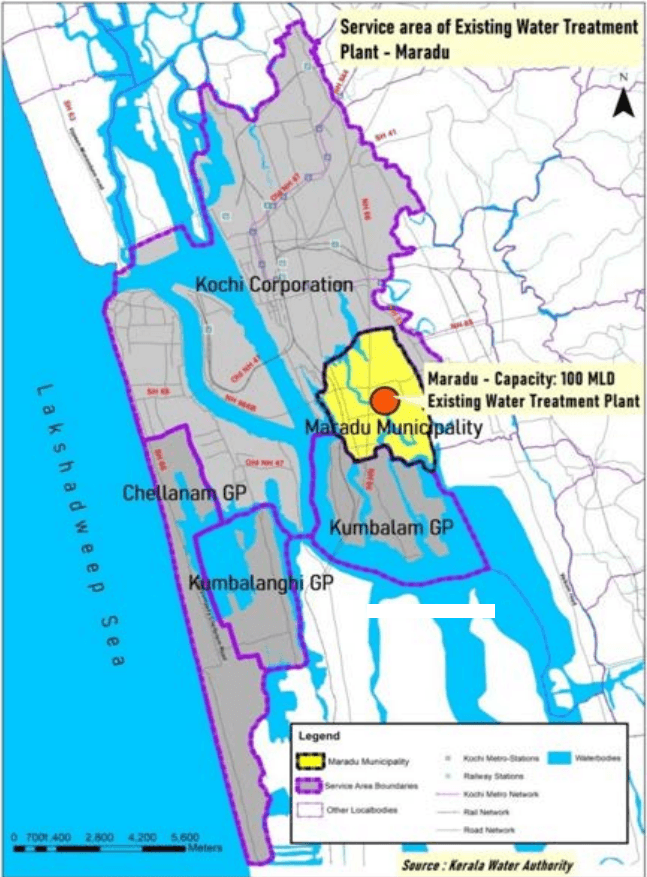
In 2016, Water Treatment Plant at Mardu was commissioned with a capacity of 100 MLD catering to Kumbalam GP, Kumbalangi GP, Chellanam GP, Maradu Municipality and Eda Kochi, Cochin Port, Navy, Karuvelippadi, Thevara, Thammanam areas of Kochi Corporation.
Kochi Municipal Corporation
WATER SUPPLY
Figure 10:3 Service area of Aluva Water Treatment Plant Source: Kerala Water Aunthority
Kochi Municipal Corporation
WATER SUPPLY
Figure 10:4 Service area of Maradu WTP Source: Kerala Water Authority
Kochi Municipal Corporation
WATER SUPPLY
Chapter 10Water Supply
10.1
Introduction
The management of drinking water supply in Kerala obtains importance at the policy level due to the state’s paradoxical situation where there is scarcity in the midst of plenty, as well as the growing demand for water due to the high population density and changing water use habits. Similarly, the high population density, unchecked urbanisation, rising rate of per capita waste generation, changing waste streams and poor waste handling habits have resulted in a complex waste management scenario in Kerala. In the water supply sector, there were a number of reforms from time to time on aspects of governance, planning principles, supply norms, implementation and management of schemes.
Supply of clean drinking water is very crucial for any city’s un-interrupted functioning. The growing cities over time have become very water demanding and this is seen in the case of the metropolitan cities. This chapter briefs about the existing water supply network, water treatment plants, physical loss, demand-supply gap, problems faced with regards to latter.
The KWA is the largest institutional entity in the field of water supply, and implemented thousands of small, medium and large urban and rural piped water supply schemes. It was established in 1984 for the development and regulation of water supply and waste water collection and disposal in Kerala. Kerala Water Authority deals with the Planning, Designing, Implementation, Operation and Maintenance of the water supply projects in Kochi.
Climate, Rainfall and Groundwater
361
Climate and rainfall: Ernakulum district has wet monsoon type of climate. The district experiences heavy rainfall during southwest monsoon season followed by northeast monsoon, while during other months rainfall is considerably lower. Nearly 100 years of data (1901 – 1999) show that the annual rainfall averages 3359mm and ranges from 3233mm to 3456mm at different places of the district. The district is drained by the Periyar River and its tributaries on the north and Muvattupuzha River on the south.
Groundwater: The depth of water level in the district shows wide variation on account of the physiographical units in which the wells are located and undulating terrain in the mid land. Water level is shallower in western coastal part (less than 2 m below ground level in general) while in the eastern part of the district it follows the riverine alluvial belt of Periyar River. In the midland region, the water table is between 5 and 10m below ground level and at isolated pockets it is found at deeper levels (more than 10m). Kochi is located on the coastal plain
Kochi Municipal Corporation
WATER SUPPLY
with water level is very shallow and less than 2m below ground level especially in the western coastal areas.
10.4.2Coverage & Distribution Network
The city is divided into 19 zones for water supply. At present, major transmission lines from Aluva as well as distribution lines in Kochi city are interlinked. Hence equitable distribution of water is not possible in the scheme area. Even though there are 8 elevated reservoirs at various locations in the city, they cannot be completely utilized due to the interlinking of distribution and transmission lines. The total distribution of water to Kochi corporation was 126 MLD in 2018 and by 2022 this has increased 200 MLD of water from Aluva and Maradu Water Treatment. The supply hours ranges from 15 to 20 hrs and lacks a 24 x 7 water supply system. Presently, there are three distribution mains from the Aluva Water Treatment Plant as shown in Fig 10.7.
➢ The first main 900mm CI pipe supplies approximately 48 MLD of water to Perumannur sump, its distribution point and boosted into the town distribution system, covering areas such as Cochin Port, Naval Base, Cochin Shipyard, Thoppumpadi, Karivelippadi and Western part of Kochi. The remaining quantity of 31.15 MLD is supplied to Ernakulam City Area after distributing to the West Kochi area.
➢ The second main is a 1050 mm diameter pipeline that conveys water to Ernakulam town, Palarivattom, Edappally, Pachalam, Chittur, Vypin & Vaduthala. Several tappings are provided to convey water to various local bodies and bulk consumers. The end point of this pipe line is Thammanam pump house. But practically no water is reaching the end point due to the intermediate tapping.
➢ The third main, a 1200 mm pipeline, also conveys water to the Corporation area, and is the other main supply water to Municipality/Panchayat populations located in close proximity to the head works. There are no tappings till Samskara Junction. At Samskara Junction a 700 mm dia branch out to supply to the North – Eastern parts of the corporation. The remaining quantity of 16 MLD is given to Elamkulam Sump and from there it is further supplied to Palluruthy and Edakochi areas of Western Kochi. The Thammanam pump house receives 11 MLD water from WTP at Maradu also. The pump house at Thammanam is mainly used to boost the supply to Corporation areas. From the 100 MLD WTP at Maradu, about 67 MLD of water is supplied to Kochi Corporation area mainly covering the areas of Edakochi, Cochin Port, Navy, West Kochi and Thevara.
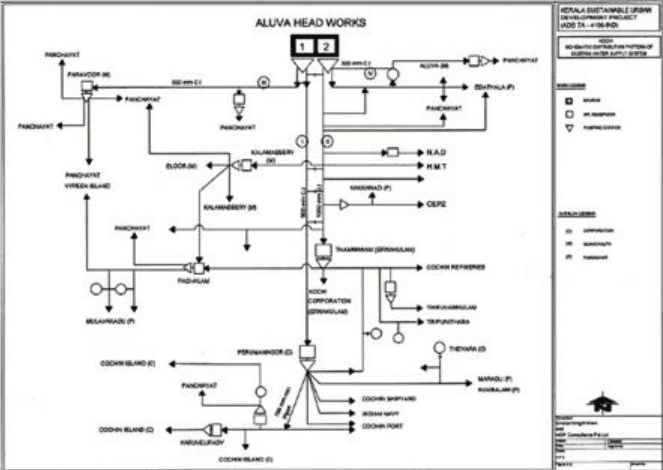
The schematic diagram of existing water supply system to Kochi Municipal Corporation is given below.
Kochi Municipal Corporation
WATER SUPPLY
Figure 10:5 Schematic diagram of the existing water supply system
Source: KWA; based on Kerala Sustainable Urban Development Project (PPTA 4106 – IND), Technical Analysis, Final Report Volume 6, May 2005
Although a pipe was laid by HUDCO (with World Bank assistance) to augment water supply of 105 MLD in West Kochi, existing railroads caused an obstruction, and the pipes could not be extended past Thammanam. Thus the current service levels of water supply in West Kochi, especially in areas like Fort Kochi and Mattancherry is poor. The water supply network in the Kochi Corporation is between 10 and 25 years old as per the Service Level Benchmarking (SLB) exercise of the MoUD. The water supply details of Kochi Corporation area is given below.
Table 101 Water supply details of Kochi Corporation area
Corporation
Quantity of Water Supplied (MLD)
Times/Hours of supply per day
No. of Connections
Per capita Consumption (LPCD)
Area covered (Sq.km)
Kochi
200
15-20 Hrs.
164742
145 (Avg.)
94.88
Source: KWA, 2020
Water supply connections for each residential, non-domestic, industrial and public uses are given below.
Kochi Municipal Corporation
WATER SUPPLY
Table 102 Water connections in Kochi Corporation area
Corporation
Type of Connection
Connections
Kochi
Residential
132469
Non-Domestic
26111
Industrial
253
Public Stand Post
5909
Source: KWA 2020
A schematic diagram of existing water distribution network in Kochi Corporation is given in Figure 10:6.
Figure 10:6 Schematic diagram of existing water distribution network in Kochi Corporation including the water supply infrastructure Source: KWA, 2020
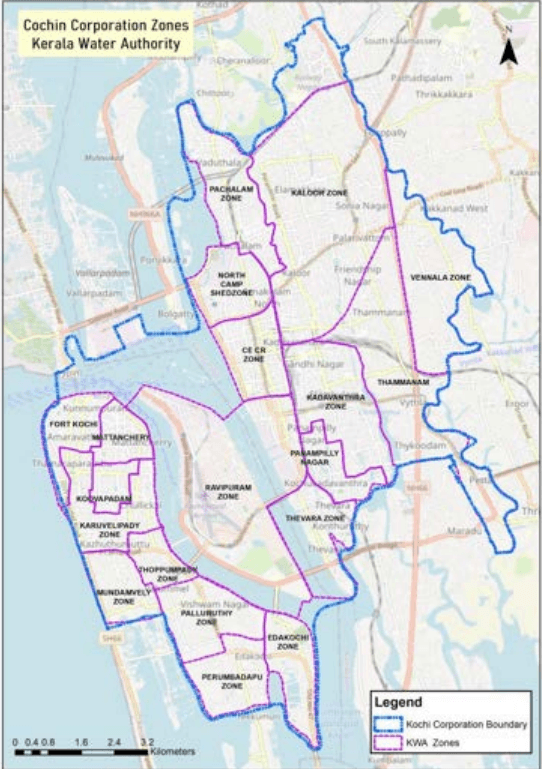
The city is divided into 19 zones for the purpose of water distribution. The West Kochi consists of 9 Water Supply Zones and Mainland including Willington island consists of 10 Zones. This is shown in Figure 10:7. There is 1697 Km length of distribution lines that runs against 982 Km of Roads in the Corporation area. There are about 132469 household connections with water tap connections. The distribution is metered except the supply through the public taps.Considering reservoirs, there are 8 elevated reservoirs at various locations in the city with a total capacity of 12.8 MLD. In addition, there are 6 ground level reservoirs also. The water reservoirs cannot be fully utilized due to the inter linkage and head loss and therefore, many of the consumers are getting water through direct pumping.
Kochi Municipal Corporation
WATER SUPPLY
Figure 10:7 Water supply zones in Kochi Corporation area Source: KWA, 2020
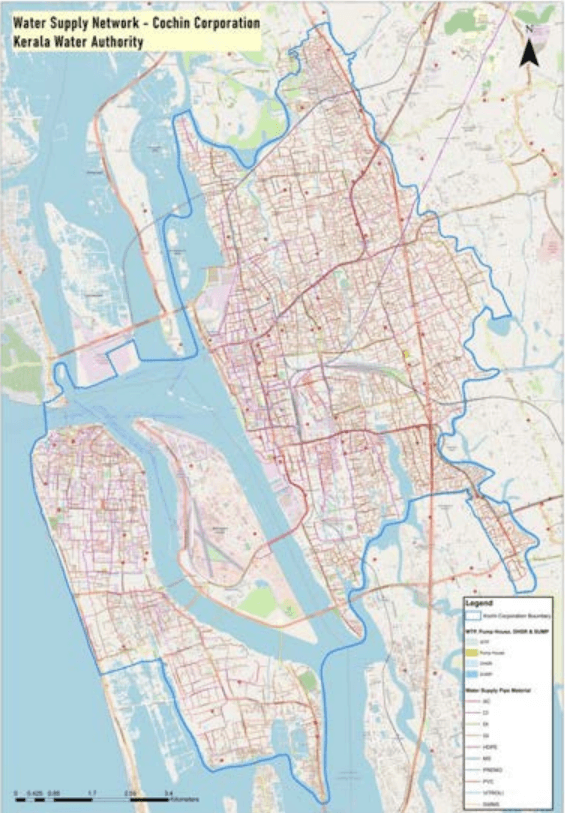
Figure 10:8 shows the water supply network in Kochi Corporation area. It can be seen that the water supply network is evenly distributed all over the corporation area except parts of Willington island. But the water that is reaching the city need to be equitably distributed all
Kochi Municipal Corporation
WATER SUPPLY
through the city. CI, GI, PVC and AC pipes are mostly used for the distribution lines. But due to old age some pipes need to be replaced for reducing NRW (Non-Revenue Water). As per the analysis the pipe network shows fully covers the street network
Figure 10:8 Water supply network in Kochi Corporation area Source: KWA, 2020
Kochi Municipal Corporation
WATER SUPPLY
It is observed from Census 2011 figures that 95.5 % of households have access to tap water when compared to that of 30.35% in the state as shown in Table 10:3 . The coverage of water supply network in the corporation area is way ahead, when compared with the state average.
Table 103 Household tap connections
Indicator
Kochi Municipal Corporation
Kerala (State)
% of Households with access to tap water from treated source
95.55
30.35
Source: Household amenities and assets, Census of India 2011
The details on number of overhead tanks/ reservoirs along with their capacities are given below. All the existing schemes have been designed and implemented by KWA and are responsible for the entire maintenance of these schemes and revenue collection except for street taps.
Table 104 Water supply infrastructure
Corporation
Over Head tanks/ Reservoirs and its Capacity
Capacity of Water treatment plant
Treated supply as % of total water supplied
Capacity
Kochi Corporation
OH tank at Kadavanthara
20.80 LL
225 MLD (Aluva) 100 MLD (Maradu)
100%
Ravipuram
11.365 LL
Semitherimukku
18.6 LL
Thevara
2 LL
Mattanchery
22 LL
Koovappadam
18.2 LL
Fort Kochi
14.2 LL
Thoppumpady
18.25 LL
Kannamaly
1 LL
Kandakkadavu
40 LL
Kumbalanghi
4.1 LL
Perumanoor sump
18 L and 11 L
Perumanoor GL tank
10 L
Thammanam GL tank
130 LL and 80 LL
Vaduthala GL tank
25 LL
Elamkulam GL tank
65 L
Kochi Municipal Corporation
WATER SUPPLY
Pachalam sump
1 L
Karuvelippady sump
50 L
Palluruthy GL tank
20 Nos 40 L
Kumbalanghi sump
29 LL
Source: KWA, 2017,*LL- lakh litres
Table 10:5 gives the status of water supply service levels for the Corporation of Kochi, compared with the MoUD benchmark. It shows the indicators like coverage, metering, cost recovery, extent of non-revenue water and efficiency in collection of watersupply-related charges fall short in relation to the required levels.
373
Table 105 Status of water supply service levels
Sl.No.
Indicators
Present Status
MOUD Benchmark
1
Coverage of Water supply Connections
85%
100%
2
Per capita Supply of Water
145 LPCD
135 LPCD
3
Extent of metering of water connections
96%
100%
4
Extent of non-revenue water (NRW)
46.7 %
20%
5
Quality of water supplied
98 %
100%
6
Cost recovery in water supply services
44 %
100%
7
Efficiency in collection of water supply related charges
80%
90%
Source: SLIP (2017-18)
According to the available data, as per Service Level Improvement Plan 2017 -18 (SLIP) the Non – Revenue Water (NRW) level is 46.7%. 1 n 2021, as per KWA, the estimated loss of water in the distribution system on account of leakage and theft is to the tune of 30 - 35%. Although the total water that is supplied is 200 MLD, the actual quantity of water that ultimately reaches to the consumers is close to 140 MLD. The present water supply system has to bear this hefty loss of 60 MLD of ‘Unaccounted Water’ (UFW) in the distribution which has to be brought down. Main reasons for the high percentage of NRW is due to the interlinking of the distribution lines with pumping mains and transmission mains; causing leaks in the distribution lines. By arranging zone wise water supply, replacing the old damaged pipe
Kochi Municipal Corporation
WATER SUPPLY
lines & leaky joints, water metering and introducing effective NRW management system will reduce this considerably.