Turning movement surveys were conducted at 45 major intersections in the study area to obtain the peak hour demand. The surveys were carried out during peak hours between 8.00 AM and 12.00 Noon in the morning or between 03.30 PM and 07.30 PM in the evening. Total volume, composition of traffic and turning flow for different directions was recorded. Peak hour volumes observed at the 45 intersections are presented below
| Sl. No. | Name of Junction | No. of arms | Peak hour volume (PCU) | Peak hour |
|---|---|---|---|---|
| 1 | Edappally Jn | 4 | 11,021 | 9.00 - 10.00 |
| 2 | Manorama | 3 | 7,969 | 09.15-10.15 |
| 3 | ThevaraJn | 3 | 7,737 | 8.45-9.45 |
| 4 | Kaloor | 4 | 7,314 | 9.00 - 10.00 |
| 5 | Madhava Pharmacy | 3 | 7,200 | 17.15-18.15 |
| 6 | Kacherippady | 4 | 7,189 | 17.45-18.45 |
| 7 | Vyttila | 5 | 7,139 | 8.30-9.30 |
Kochi Municipal Corporation
TRANSPORTATION
| 8 | Kundanoor | 5 | 7,122 | 18.00-19.00 |
|---|---|---|---|---|
| 9 | Palarivattam Bypass | 4 | 6,835 | 9.30-10.30 |
| 10 | Kadavanthara | 4 | 6,820 | 16.15-17.15 |
| 11 | PallimukkuJn | 3 | 6,700 | 8.30 - 9.30 |
| 12 | Deshabhimani | 4 | 6,127 | 10.00-11.00 |
| 13 | St Martin Jn | 3 | 6,093 | 9.45-10.45 |
| 14 | S N Jn | 3 | 5,961 | 8.45-9.45 |
| 15 | Kaloor Stadium | 3 | 5,193 | 16.45-17.45 |
| 16 | GCDA | 3 | 4,811 | 18.00-19.00 |
| 17 | Kathirikadavu | 4 | 4,446 | 16.30-17.30 |
| 18 | Palarivattam | 3 | 4,374 | 16.00 - 17.00 |
| 19 | KPCC Jn | 4 | 4,348 | 9.30 - 10.30 |
| 20 | High Court | 3 | 4,345 | 10.45-11.45 |
| 21 | Petta | 3 | 4,220 | 17.15-18.15 |
| 22 | Valanjambalam | 4 | 4,214 | 16.30-17.30 |
| 23 | Cochin Port Jn | 4 | 4,036 | 18.00-19.00 |
| 24 | Kunnumpuram | 4 | 3,918 | 9.00-10.00 |
| 25 | Jose Jn | 4 | 3,906 | 16.45 - 17.45 |
| 26 | Hospital | 3 | 3,822 | 16.15-17.15 |
| 27 | ThoppumpadyPalli | 3 | 3,719 | 10.30-11.30 |
| 28 | Goshree Bridge Jn | 3 | 3,431 | 9.30-10.30 |
| 29 | ThammanamJn | 4 | 3,336 | 17.15-18.15 |
| 30 | Alinchuvadu | 3 | 3,020 | 18.00-19.00 |
| 31 | KazhuthumuttuJn | 3 | 2,935 | 17.30-18.30 |
| 32 | BOT Bridge Jn | 3 | 2,927 | 16.15-17.15 |
| 33 | BTH | 3 | 2,919 | 17.30-18.30 |
| 34 | Convent Jn | 3 | 2,798 | 16.30-17.30 |
| 35 | Pachalam | 6 | 2,650 | 9.45-10.45 |
| 36 | Thoppumpady | 3 | 2,482 | 8.30-9.30 |
| 37 | KumbalangiVazhi | 3 | 2,269 | 16.00-17.00 |
| 38 | Punnakkal | 4 | 2,259 | 17.45-18.45 |
| 39 | South Jn | 4 | 2,215 | 9.45-10.45 |
| 40 | Pyari | 3 | 2,004 | 17.15-18.15 |
| 41 | Kappalandimukku | 4 | 1,834 | 10.30-11.30 |
| 42 | IyyattilJn | 3 | 1,511 | 9.45-10.45 |
| 43 | SaudiaJn | 3 | 1,298 | 16.30-17.30 |
| 44 | Vaduthala | 3 | 1,244 | 9.45-10.45 |
| 45 | Veli | 3 | 1,164 | 8.45-9.45 |
Source: NATPAC study report, 2019
It could be seen that Edappally junction handled the highest peak hour traffic volume of about 11,000 PCU in the city, followed distantly by Valanjambalam Jn., Thevara Jn., Kaloor, Madhava
Kochi Municipal Corporation
TRANSPORTATION
Pharmacy, Kacherippady, Kundanoor and Vyttila with more than 7,000 PCU per hour. Five junctions namely Palarivattam Bypass, Kadavanthara, Pallimukku, Deshabhimani and St Martin Jn. handled peak hour traffic volume between 6,000 and 7,000 PCU. SN Jn. and Kaloor Jn. had traffic volume between 5,000 and 6,000 PCU and eight junctions between 4,000 and 5,000 PCU. Rest of the 22 junctions had traffic volume below 4,000 PCU.
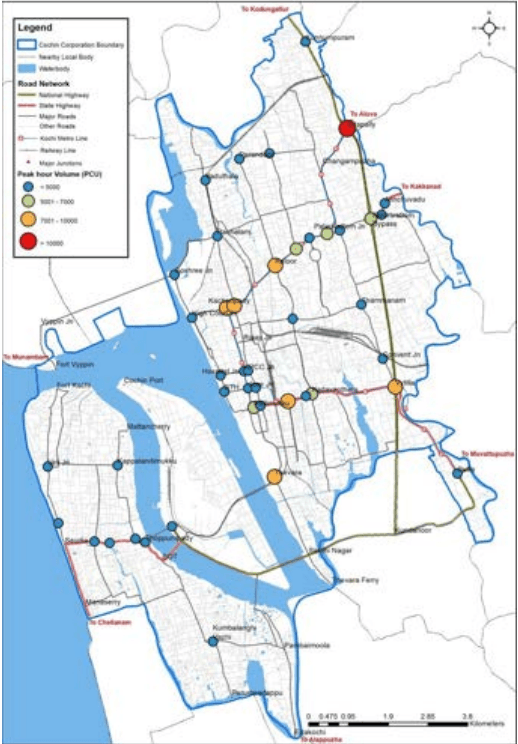
Figure 8:5 Traffic Volume at Major Intersections Source: LSGD (Planning), NATPAC study report, 2019
Kochi Municipal Corporation
TRANSPORTATION