This chapter gives a brief description on the existing employment character of the Kochi city as per the occupational structure provided in the 2011 Census. Employment, being a major indicator of financial well-being of an area and its residents, is a significant parameter in the preparation of a Masterplan. Hence, Reviewing and analysing the workforce is very important to determine workforce demographics and employment trends. This chapter highlights analysis of the temporal changes, gender participation, duration of employment etc. which helps in revealing the economic welfare of a society. The change that has happened in the economic base of the district and corporation over a period of time is also probed into.
5.2Work Force
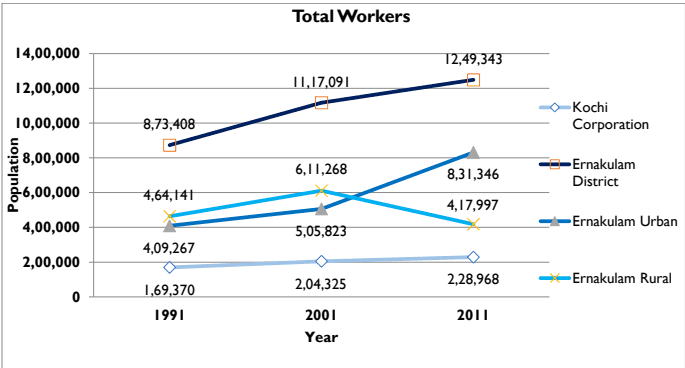
The number of workers in the Kochi corporation in 2011 is 2.28 lakhs, which is 18.33% of the total workers in Ernakulam District (12.49 lakhs). The chart provides the temporal variation in the number of workers in the district and its urban and rural areas, along with that of the Corporation. The number of workers has been increasing temporally. It can be seen that the number of workers in urban areas of Ernakulam has seen a significant increase in the urban workers from 1991 to 2011, while the Workers in rural areas of the district has declined from 2001 to 2011. A corresponding decrease in the rural workers indicates that this change is due to reclassification of rural areas to urban areas.
It can also be observed that the rate of increase in number of workers in the urban and the district is higher than that in the rural areas, especially in the last decade, indicating that the opportunities for work in the urban areas is increasing at a higher rate when compared to the rural areas. This may also indicate the reduced employability in rural areas as well as the highly-travelling workforce of Kerala, which resides in the urban hinterland and commutes daily to the work place. When the temporal changes of work force within the district is analysed, it can be seen that a great majority of workforce belonged to the Corporation, historically. However, the number of workers in the urban part of the district is increasing at a much higher rate than the corporation, and the gap in the share of work force between the corporation and the other LSGs is decreasing, as seen in table 5.1
Kochi Municipal Corporation
EMPLOYMENT
Table 51 Temporal variation of workers in planning area in comparison with the region
Year
Ernakulam District
Ernakulam Urban
Ernakulam Rural
Kochi Corporation
1991
8,73,408
4,09,267
4,64,141
1,69,370
2001
11,17,091
5,05,823
6,11,268
2,04,325
2011
12,49,343
8,31,346
4,17,997
2,28,968
Source: Census data
Figure 5:1 Temporal variation of workers in planning area in comparison with the region Source: Census data
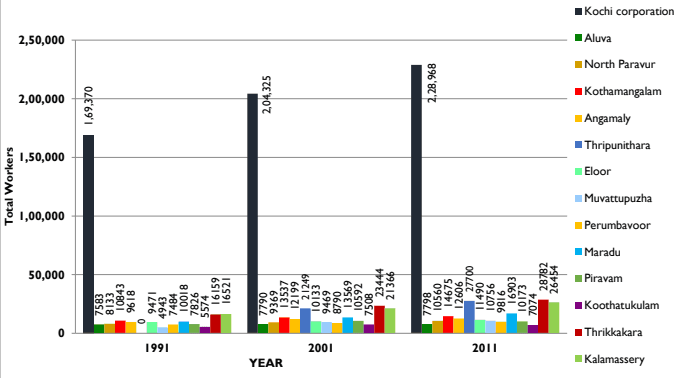
When the changes in the other urban local governments in Ernakulam district are studied, it can be seen that Thripunithara has traditionally accounted for highest number of workers followed by Kalamassery and Maradu. These three LSGs show the highest rate of growth in the number of workers in the last decade as well and is shown in table 5-2 and figure 5-2 .
Table 52 Workers in other urban local governments and Corporation (1991-2011)
District/LSG
1991
2001
2011
Kochi Corporation
1,69,370
2,04,325
2,28,968
Aluva
7583
7790
7798
North Paravur
8133
9369
10560
Kochi Municipal Corporation
EMPLOYMENT
Kothamangalam
10843
13537
14675
Angamaly
9618
12199
12606
Thripunithura
-
21249
27700
Eloor
9471
10133
11490
Muvattupuzha
4943
9469
10756
Perumbavoor
7484
8790
9816
Maradu
10018
13569
16903
Piravam
7826
10592
10173
Koothatukulam
5574
7508
7074
Thrikkakara
16159
23444
28782
Kalamassery
16521
21366
26454
Source: Census data
Temporal variation of workers in other urbal local bodies in comparison to the Corporation
Figure 5:2 Temporal variation of workers in the constituent LSGs in comparison to Corporation Source: Census data
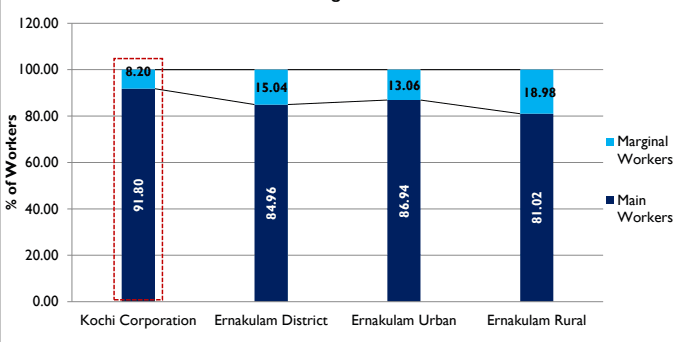
The total labour force may be classified into three categories. They are the main workers, the marginal workers who work for less than 6 months per year and the unemployed (non-workers). When the main-marginal composition of workers in 2011 is studied, it can be seen that 91.8% of the workers in Corporation area are main workers. It can be seen from the
Kochi Municipal Corporation
EMPLOYMENT
chart below that the Corporation area have low shares of marginal workers when compared to the district, the urban average and rural average of the district. This indicates that the corporation provides its workers with work for most of the year, when compared to the urban and rural areas of the district.
Percentage of Main and Marginal Workers in comparison with the region
Figure 5:3 Percentage of Main and Marginal Workers in comparison with the region Source: Census 2011
Table 53 Proportion of Main and Marginal workers in the corporation and the region
Workers
Kochi Corporation
Ernakulam District
Ernakulam Urban
Ernakulam Rural
Main Workers
210191
1061388
722738
338650
Marginal Workers
18777
187955
108608
79347
Source: Census 2011
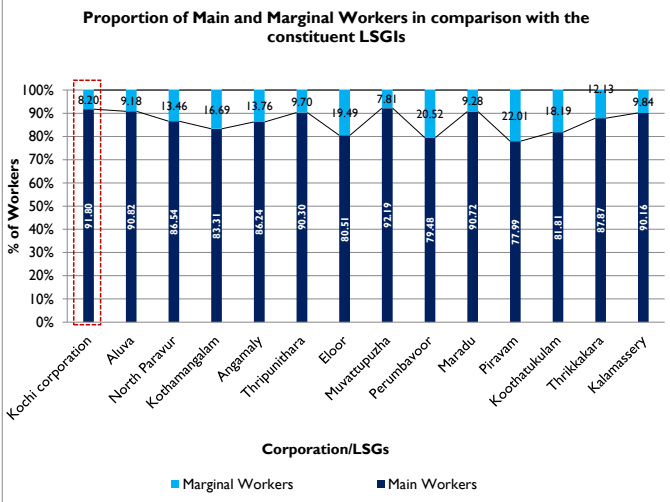
When the main-marginal share of workers of the LSGIs in the District is studied, it can be observed from the Figure 5-4, that Piravam has the least proportion of main workers whereas Muvattupuzha has the highest. It can be seen that Piravam and Perumbavoor has the least number of main workers, 20%-22% are marginal workers.
88
Kochi Municipal Corporation
EMPLOYMENT
Table 54 Main and Marginal Workers in the constituent LSGIs and Corporation-2011
District/LSG
Main Workers
Main Workers(%)
Marginal Workers
Marginal Workers(%)
Total Workers
Kochi Corporation
210191
91.80
18777
8.20
2,28,968
Aluva
7082
90.82
716
9.18
7798
North Paravur
9139
86.54
1421
13.46
10560
Kothamangalam
12226
83.31
2449
16.69
14675
Angamaly
10872
86.24
1734
13.76
12606
Thripunithara
25013
90.30
2687
9.70
27700
Eloor
9251
80.51
2239
19.49
11490
Muvattupuzha
9916
92.19
840
7.81
10756
Perumbavoor
7802
79.48
2014
20.52
9816
Maradu
15335
90.72
1568
9.28
16903
Piravam
7934
77.99
2239
22.01
10173
Koothatukulam
5787
81.81
1287
18.19
7074
Thrikkakara
25291
87.87
3491
12.13
28782
Kalamassery
23851
90.16
2603
9.84
26454
Source: Census 2011
89
Kochi Municipal Corporation
EMPLOYMENT
Figure 5:4 Proportion of Main and Marginal Workers in comparison with the constituent LSGIs Source: Census data
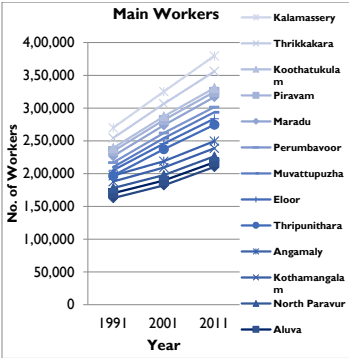
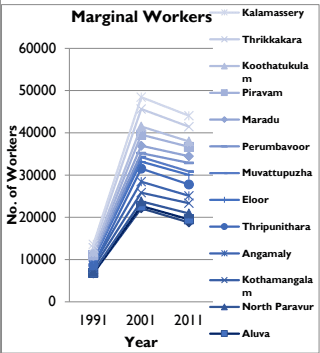
When the temporal change of marginal workers is analysed (Figure 5-5), it can be observed that their number in the constituent LSGs witnessed a significant decline from 2001- 2011.
Apart from Kochi Corporation; When the trends in other LSGIs in the District is studied, it can be seen that the number of main workers is the highest in Thrikkakara, followed by Thripunithara, Kalamssery, Maradu, Kothamangalam, Angamaly, Muvattupuzha, Eloor, Paravur, Piravam, Perumbavoor, Aluva and Koothatukulam. Similar to the trend in number of workers, the corporation has the highest share of main workers historically. The number of marginal workers in the Corporation area shows a decline in 2001-2011. While closely analysing the LSGIs within the District, it can be seen that all the LSGIs also follow the same trend. The decline in agriculture and traditional industries in the region would have resulted in this incline in 1991, followed by the employment generated by service sector as well as other industries resulting in the high in 1991. Thus from Table 5-5; it is found that, the share of the marginal workers is decreasing and that of the main workers is increasing temporally in the corporation area and LSGs.
Kochi Municipal Corporation
EMPLOYMENT
Table 55 Number of main and marginal workers in the constituent local governments, 1991-2011
Corporation/LSG
Main workers
Marginal Workers
1991
2001
2011
1991
2001
2011
Kochi corporation
1,62,654
182189
210191
6716
22136
18777
Aluva
7,451
7238
7082
132
552
716
North Paravur
7,865
8276
9139
268
1093
1421
Kothamangalam
9,966
11477
12226
877
2060
2449
Angamaly
8,984
9603
10872
634
2596
1734
Thripunithara
-
18445
25013
-
3098
2687
Eloor
8,229
8472
9251
1242
1661
2239
Muvattupuzha
4,772
8395
9916
171
1074
840
Perumbavoor
6,965
7869
7802
519
921
2014
Maradu
9,804
11805
15335
214
1764
1568
Piravam
7,496
7973
7934
330
2619
2239
Koothatukulam
4,801
5571
5787
773
1937
1287
Thrikkakara
15,218
19312
25291
941
4132
3491
Kalamassery
15,771
18562
23851
750
2804
2603
Source: Census Data
Kochi Municipal Corporation
EMPLOYMENT
Figure 5:5 Temporal variation of main and marginal workers in the constituent local governments Source: Census data
5.6Inference
Workers in the Kochi Corporation in 2011 constitute 18.3% of the total workers in Ernakulam District and 27.5% of that of the urban area of Ernakulam. The main-marginal composition of workers in 2011 indicates that the Corporation provides its workers with work for most of the year, when compared to the other urban and rural areas of the district. Female WPR is very low in corporation. This suggests that women centred work centres and job opportunities need to be planned to ensure an inclusive development. Analysing the occupational structure, it is seen that share of main workers is high which will aid the overall development. The share of marginal workers is comparatively low. Analysis shows lesser share of primary sector employees (cultivators and agricultural labourers), which together constitute only 0.5% of the total main workers. The percentage of household industrial workers is less and follows a consistent form. The higher proportion of other workers in employment pattern shows a lack of interest towards the primary agriculture sectors, due to the reduced output from those sectors.
The fragmentation of land holdings and high wages in agricultural labour discourages the employment stabilization in this sector on one hand. On the other hand spiralling land values encourages the conversion of agricultural land to urban land. Reduction of employment in agricultural sector is a natural corollary of urban growth. Despite this, a slight increase is observed in the proportion of agricultural workers from 2001-11. The proportion of workers in the household industries sector in Kochi City is 1.8% which is not high compared to the state figure in 2011. The past trend indicates that this sector is reducing. However, the existence of literate population, low capital and technological requirements, a ready and vast market for a variety of consumer goods and organizations like Kudumbashree are favourable points for generating employment in this sector. A goal of achieving at least the state average employment in Household Industry sector will be most desirable.
Steady expansion of economic activities within the city as well as in the hinterlands and extensive regional network of communication and transportation facilities enabled the city of Kochi to exert strong economic influence beyond its administrative boundaries. Its influence on other parts of the state is evident from the fact that the size of the floating population to the city is as high as 46% of the resident population. More than one-third of the floating population (37 per cent) is from other districts (NATPAC 2007). Two-thirds (65 percent) of the commuters visited Kochi for work- and work-related purposes (ibid). More than 40 percent of the city jobs are availed by commuters from outside the city (CII-Kerala, CPPR and Kumar Group 2012). With near stagnation in population growth in Kochi Municipal Corporation area, the dependence on workers from outside the city limits is bound to increase in the future. Kochi is one of the few cities in India which has all major modes of
Kochi Municipal Corporation
EMPLOYMENT
transport connecting the city with the rest of the state. The city serves its daily commuters by three dominant modes of transport: firstly, road-based transportation; secondly, rail based transportation; thirdly, a limited network of water transport services mainly from the islands to the mainland. A major development taking place which facilitates commuting within the urban agglomeration is the construction of Metro rail (Patterns of commuting for work a case study of Kochi city, RULSG occasional paper 2015)
Kochi Municipal Corporation
LAND USE
5.3.1Male Work Participation Ratio
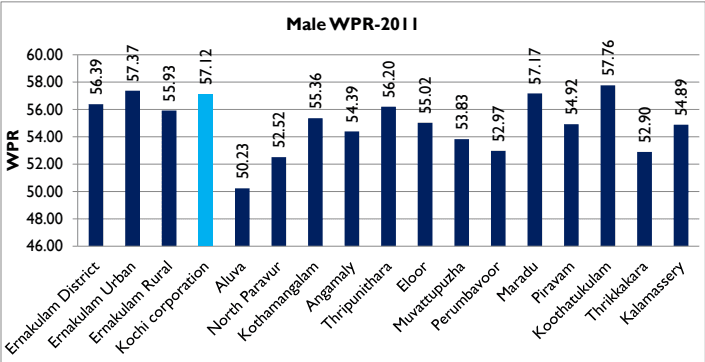
Male work participation ratio is 57.12 in the Corporation area and 56.39 in the District. Among the other constituent local governments, Koothatukulam and Maradu, has a high male WPR, higher than the Corporation area.
Table 58 Male WPR in District, Corporation
District/LSG
Census 2011
Total males
Total male Workers
Male WPR
Ernakulam District
1619557
913249
56.39
Ernakulam Urban
518510
297463
57.37
Ernakulam Rural
1101047
615786
55.93
Kochi corporation
296949
169606
57.12
Source: Census 2011
Figure 5:8 Comparison of MWPR of Kochi Corporation with District and LSGs Source: Census 2011
Work Participation Ratio
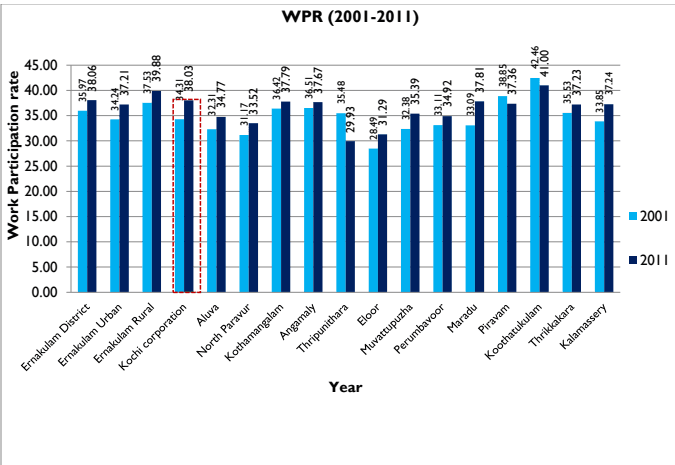
The work participation ratio of the Corporation area in 2011 is 38.03%, whereas the expected WPR as per URDPFI guidelines is 33%, which indicates the strength in terms of higher employment opportunities in the Corporation area.
The Corporation area has a slightly lower WPR compared to the district urban average of 38.06%. Among the LSGIs in District, Koothatukulam, which still has a relatively more active agricultural sector, has a better WPR of 41.00, higher than the Corporation area. Prominence of plantation workers in the Koothatukulam region is the main reason for the higher value of WPR. The remaining local governments have higher WPRs in comparison to URDPFI guidelines, except for Eloor and Thripunithara, which is even lower than the district rural and urban average. It is observed that the WPR of District rural (39.88) is higher than that of District Urban (37.21). This can be attributed to the prevalence of primary sector despite the rise of tertiary sector opportunities.
92
Kochi Municipal Corporation
EMPLOYMENT
Table 56 WPR of Corporation, District (2001-2011)
District/LSG
2001
2011
Population
Total Workers
WPR
Population
Total Workers
WPR
Ernakulam District
3105798
11,17,091
35.97
3282388
12,49,343
38.06
Ernakulam Urban
1477085
5,05,823
34.24
2234363
8,31,346
37.21
Ernakulam Rural
1628713
6,11,268
37.53
1048025
4,17,997
39.88
Kochi corporation
595575
2,04,325
34.31
602046
2,28,968
38.03
Source: Census data
Figure 5:6 Temporal change of WPR of Corporation, District and LSGs (2001-2011) Source: Census data
From 2001-2011, it can be seen that the WPR of urban areas and rural areas has been showing a general trend of increase temporally while that of Thripunithara has decreased.
Kochi Municipal Corporation
EMPLOYMENT
Figure 5:7 Work participation observed in various wards of the Corporation Source: Census data
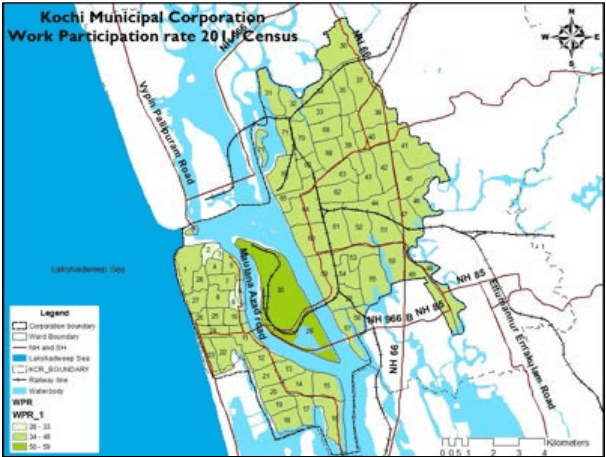
Considering the WPR of various wards as shown in Figure 5-7, the highest WPR is observed in Willingdon Island, while the wards 2,3,6 and 9 in the western side of the corporation show a low WPR, much less than the benchmark of 33% as suggested by URDPFI. All other wards in the corporation display a WPR higher than the expected WPR stated by URDPFI guidelines.
When the work participation rate of Kochi Corporation is compared with that of the other corporations of the state, it can be seen that Kochi has the highest WPR among them. This indicates the strength and potential in terms of job opportunities in the corporation area, thus promoting a sustainable economy.
Table 57 Comparison of WPR with Other Corporations
LSGs
WPR (2001)
WPR (2011)
Kochi
34.37
38.03
Thrissur
32.51
35.79
Kollam
32.19
34.32
Thiruvananthapuram
33.10
36.28
Kozhikode
30.64
32.18
Source: Census data
Kochi Municipal Corporation
EMPLOYMENT
5.1.1Female Work Participation Ratio
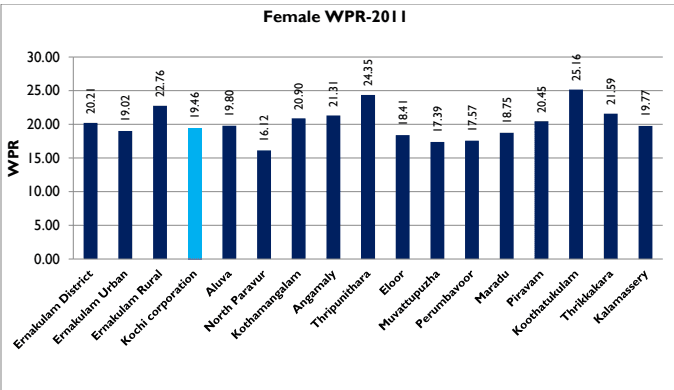
The female work participation ratio in the District and Kochi Corporation are low, to the tune of 20.21 and 19.46 respectively. It can also be seen that the Female WPR in the Corporation area is lower than the district and district urban average, indicating the effect of primary and secondary sector which provides more jobs for women.
Kochi Municipal Corporation
EMPLOYMENT
Table 59 Female WPR in District, Corporation and other LSGs
District/LSG
Census 2011
Total Females
Total Female Workers
Female WPR
Ernakulam District
1662831
336094
20.21
Ernakulam Urban
1133316
215560
19.02
Ernakulam Rural
529515
120534
22.76
Kochi corporation
305097
59362
19.46
Source: Census 2011
Figure 5:9 Comparison of FWPR of Kochi Corporation with District and LSGs Source: Census 2011
Occupational Structure
As stated by 2011 census, Main and Marginal workers are again subdivided in to cultivators, agricultural laborers, household industrial workers and other workers. Workers other than cultivators, agricultural labourers and H/H industrial workers constitute 96.3% of the workers in the corporation in 2011. The higher proportion of ‘Other Workers’ category indicates the growth in service sector opportunities in Kochi Corporation.
96
Kochi Municipal Corporation
EMPLOYMENT
Table 5-10 shows that only 0.4% of the total main workers are engaged in agricultural labour. Cultivators constitute 0.1% of the workforce and household industry provides work for 1.8%. All the rest, that is 97.7% are counted together as ‘other sectors’ by the Census of India. This includes all the workers in manufacturing sector, traders, and workers in service industries, business and public servants. As Kochi is a port based city, the trade and commerce sector gained predominance. The major port based developments proposed -The International Transhipment Terminal, Single Buoy Mooring, LNG Project located in Kochi Corporation boost up the development in Kochi City region.
Table 510 Workforce Categorization 2011
Local Body
Cultivators
Agricultural Workers
HH Industry Workers
Other Workers
Total Workers
Kochi Corporation
310
880
3872
215021
220083
% of Total main Workers in Kochi Corporation
0.1
0.4
1.8
97.7
100.0
Source: Census 2011
The comparison of percentage of total workers in Kochi Corporation in 2001 and 2011 (table 5-11) shows that there is decline in house hold industry workers of about 0.7% and an increase of 0.3 % in agricultural workers. It is also seen that there is an increase of .5% in other workers category too. The data shows that house hold industry is slowly declining and there is slight increase in the agricultural activities for urban population.
Table 511 Variation of different category of workers from 2001-2011
Category
% of Total Workers in Kochi Corporation
2001
2011
Cultivators
0.1
0.1
Agricultural Workers
0.1
0.4
HH Industry Workers
2.5
1.8
Other Workers
97.2
97.7
Source: Census data
Kochi Municipal Corporation
EMPLOYMENT
98
Migrant workers
Most of the large scale constructions are concentrated within or near the Kochi urban agglomeration. Kochi Metro Rail, Expansion of Kochi Refinery, Expansion of Kochi International Airport, LNG Terminal at Puthuvype and Infopark Kochi are some of the major constructions commissioned by the government. Construction of several apartments, and other buildings are also progressing in Kochi. All these major as well as minor constructions depend heavily on migrant workers. Migrant workers from Tamil Nadu have been present in the construction sector in Kochi for decades and continue to be one of the major groups at the minor construction sites in the city. There are contractors from Tamil Nadu who undertake concreting work on contract from local builders. Men and women from Tamil Nadu work in the construction sector. Dindigul, Theni, Tiruchirappalli, Salem, Madurai, Dharmapuri and Ariyalur are some of the reported source districts in Tamil Nadu. Natives of Anantapur district in Andhra Pradesh, Murshidabad, Jalpaiguri, Nadia and Malda districts in West Bengal, Patna and Muzaffarpur in Bihar, Morigaon and Nagaon districts of Assam, as well as Rayagada district in Odisha can be found working in the minor construction sector. Major constructions engage workers, predominantly from northern and eastern India. Expansion of Kochi Refinery gave employment to more than 10,000 workers during 2016-17. Workers from Ballia and Gorakhpur districts in Uttar Pradesh, and Buxar, Muzaffarpur and Purnia districts in Bihar can be found at the site. There are also workers from Assam and West Bengal. Large scale infrastructure companies engaged in the construction of Kochi Metro Rail, Kochi International Airport and Infopark Kochi have been employing workers from Jharkhand, Bihar, Uttar Pradesh, Odisha, West Bengal and several other states, recruiting them from source areas through a network of intermediaries. Workers on the minor construction sites are either recruited from the local labour nakas or have been working with the local contractors as informal employees. Hotels ranging from international brands with five-star facility to street food shops engage migrant workers. Both migrant men and women work in the sector with majority being men. Workers from northeastern Indian states and Nepal are generally engaged in the lobby, restaurants and housekeeping sections of the luxury hotels. Workers from Darjeeling district in West Bengal can also be found. Workers from other states are generally engaged in other low skilled work where there is limited customer interaction, for example cleaning the plates. One of the popular vegetarian joints in Kochi has staff members from Manipur who have been working there for several years. Several hospitals in the city also engage migrant workers as housekeeping staff and attendants. Men and women from Tripura and several north-eastern states, and men from Odisha can be found working in multi-speciality hospitals in the city (according to District Migration Profile 2016-17, CMID).