Shelter is one of the primary requirements of a human being. The term housing may be used “to cover all the socially accepted ways by which a man acquires a territory for his home, the procedures by which he retains that territory, the price he pays for it and the manner in which the stock of houses is maintained and enlarged”.
The characteristics of the shelter count in defining housing in relation to the standard of living. It is the residential use which determines the future living patterns and densities in a community.
Online building plan approval system reduced average time for approvals by nearly 50%. Census 2011 data reveals that among million plus population cities in India, Kerala has the lowest percentage of urban population (1.5%) living in slums. The Kochi urban agglomeration is the largest in the state and also its commercial capital. The Corporation area of Kochi also has very low number of households (around 1%) living in slums.
19.2 Housing Shortage
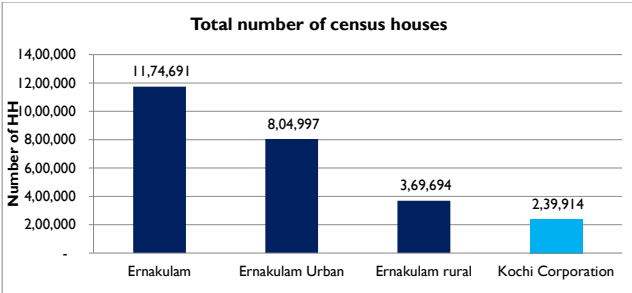
The total number of houses in the Kochi Corporation area is 2,39,914. The total number of occupied houses is 2,06,689. The vacant housing in the Corporation area is 33,225.
Kochi Municipal Corporation
HOUSING
Figure 19:1 Number of total houses, Source: Census 2011
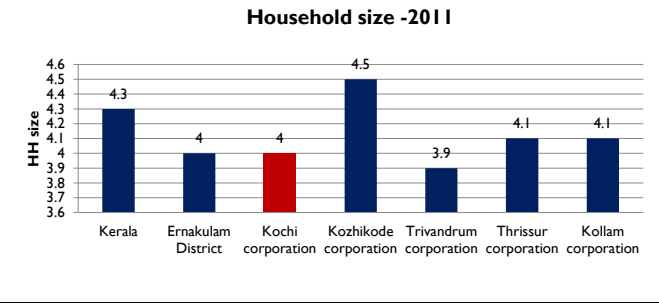
Figure 19:2 Household size in various corporations, Source: Census 2011
19.4Below Poverty Line (BPL) and Slum Housing
Total population below poverty line in Kochi Corporation is 202788 (33.68% of total population). The percentage of population below poverty line is higher in the coastal areas, where fishermen constitute a major share of the population.
508
Table 191 Ward wise population below BPL (2016-17)
dr a W
Name of Ward
No. of BPL
dr a W
Name of Ward
No. of BPL
HH
Populati on
HH
Populati on
1
Fort Kochi
959
3854
38
Devankulangara
174
661
2
Kalvathy
1619
7014
39
Karukappilli
169
779
3
Earaveli
1444
6403
40
Mamangalam
186
682
4
Karippalam
1581
6744
41
Padivattom
222
989
5
Mattancherry
1774
7698
42
Vennala
492
2151
6
Kochangadi
1056
4426
43
Palarivattom
547
2426
7
Cheralayi
1016
4148
44
Karanakodam
512
2253
8
Panayappilli
1263
5063
45
Thammanam
592
2627
9
Chakkamadam
636
2525
46
Chakkarapparambu
358
1661
10
Karuvelippady
876
3387
47
Chalikkavattom
443
2031
11
Thoppumpady
1199
4802
48
Ponnurunni East
286
1241
12
Tharebhagam
436
2614
49
Vyttila
490
2061
13
Kadebhagam
1544
6430
50
Chambakkara
209
961
14
Thazhappu
1416
5020
51
Poonithura
383
1665
15
Edakochi North
1197
4718
52
VytillaJanatha
321
1381
16
Edakochi South
1037
4311
53
Ponnurunni East
426
1777
17
Perumpadappu
1036
4170
54
Elamkulam
371
1635
18
Konam
1088
4448
55
Girinagar
82
345
Kochi Municipal Corporation
HOUSING
19
Palluruthy-Kacherippady
1596
6713
56
Panampilly Nagar
236
970
20
Nambyapuram
1537
6331
57
Kadavanthra
654
2771
21
Pullardesom
1251
5099
58
Konthuruthy
346
1524
22
Mundamveli
1009
4095
59
Thevara
393
1644
23
Manassery
1326
5229
60
Perumanoor
434
1953
24
Moolamkuzhi
721
2948
61
Ravipuram
184
796
25
Chullikkal
620
2483
62
Ernakulam South
238
1080
26
Nasrath
985
3933
63
Gandhi Nagar
526
2221
27
Fort Kochi Veli
502
1912
64
Kathrukadavu
377
1689
28
Amaravathy
664
2729
65
Kaloor South
395
1788
29
Island North
316
1249
66
Ernakulam Central
271
1169
30
Island South
59
243
67
Ernakulam North
202
868
31
Vaduthala West
593
2641
68
Ayyappankavu
287
1294
32
Vaduthala East
643
2764
69
Thrikkanarvattom
319
1505
33
Elamakkara North
654
2823
70
Kaloor North
209
949
34
Puthukkalavattom
442
1962
71
Elamakkara South
440
2030
35
Ponekkara
422
1835
72
Pottakkuzhi
191
846
Source: Civil supplies department (2016-17)
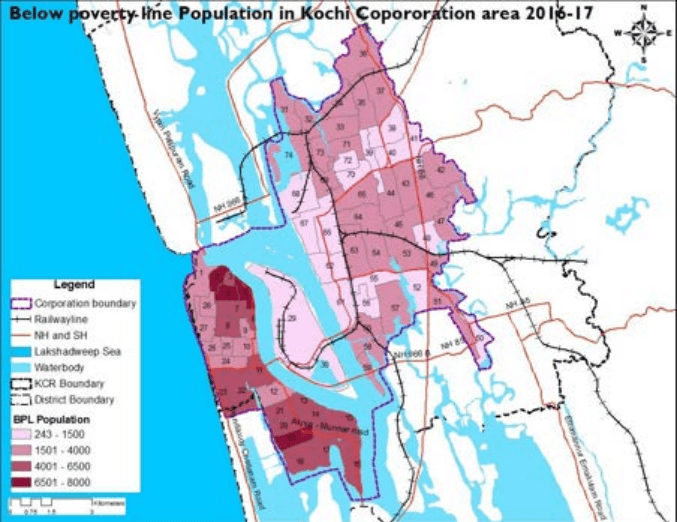
It can be observed in Figure 19:9 that the proportion of BPL is more towards the coastal areas of the Corporation. The shift of economic activities from the western part of Kochi to the east has also accelerated poverty and growth of slums in the former.
Kochi Municipal Corporation
HOUSING
Figure 19:9 Ward wise population below BPL Source: Civil supplies department (2016-17)
36
Kunnumpuram
452
1910
73
Pachalam
846
2085
37
Edappalli
394
1687
74
Thattazham
436
1919
Chapter 19Housing
Housing is an important aspect that is to be considered for making the city a liveable city, as shelter is one of the basic needs that affect the human well-being. Housing affordability is vital to the social and economic sustainability of our community. Also, Housing sector is employment intensive; it generates employment during its construction period and for its maintenance. The demand for housing increases due to growth of population, rapid pace of industrialization and urbanization. This chapter details about Housing characteristics, Housing shortage, sub-standard housing and the issues faced.
19.3Housing Characteristics
19.3.1 Condition of Houses
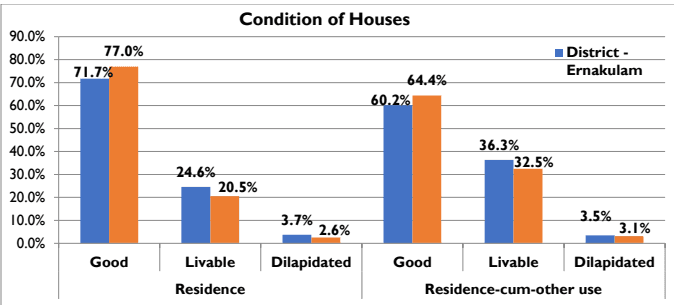
Out of total census houses 99.5 % of houses are of residential use only and 0.5 % of houses are of residence-cum other use. Out of total 99.5 % of houses 77.0 % of houses are of good condition, 20.5 % of houses are of liveable condition and 2.6 % of houses are of dilapidated condition. Out of 0.5 % of houses of residence-cum other use, 64.4 % of houses are of good condition, 32.5 % of houses are of liveable condition and 3.1% of houses are of dilapidated condition.
Kochi Municipal Corporation
HOUSING
Figure 19:3 Condition of Houses in Kochi Corporation Source: Census 2011
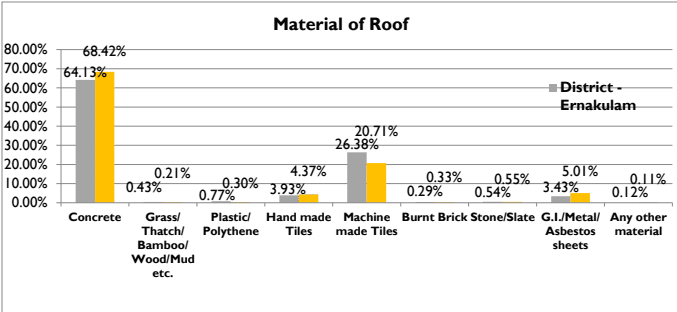
Major share of material of roof of houses within Kochi Corporation is of concrete and followed by machine made tiles, G.I/Metal sheets etc. Figure 19:4 shows detailed characteristics of material of roof of houses within the Ernakulam district and Kochi Corporation.
Figure 19:4 Material of Roof in Kochi Corporation, Source: Census 2011
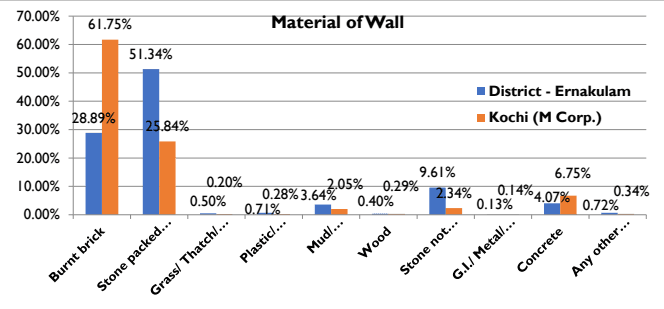
It is found that material of majority of wall used in Kochi Corporation is burnt brick whereas compared with Ernakulam district it is stone packed with mortar. Figure 19:5 shows the material of wall used in houses within Ernakulam district and Kochi Corporation.
Kochi Municipal Corporation
HOUSING
Figure 19:5 Material of Wall in Kochi Corporation, Source: Census 2011
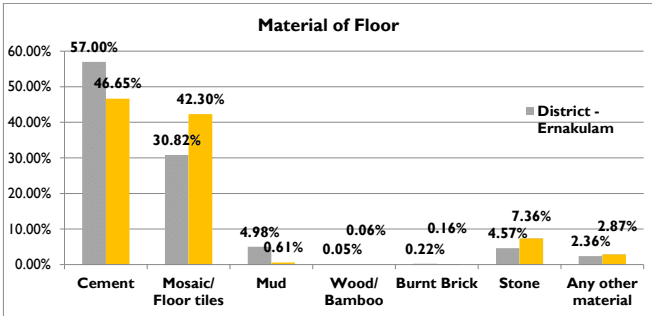
Cement and floor tiles are predominantly used for flooring in Kochi Corporation, followed by stone and other materials. Figure 19:6 shows the material of floor in Ernakulam and Kochi Corporation.
Figure 19:6 Material of Floor in Kochi Corporation, Source: Census 2011
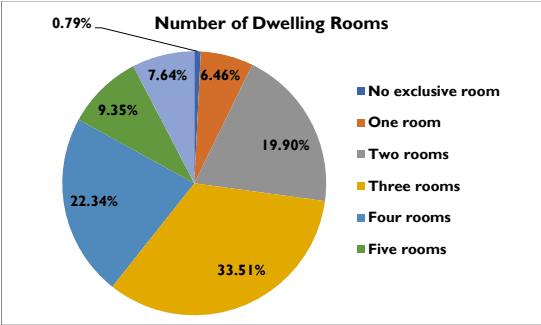
Figure 19:7 shows the number of dwelling rooms of houses in Kochi Corporation. Majority of houses in Kochi Corporation consists of 3 dwelling rooms followed by 4 and 2 dwelling rooms.
Kochi Municipal Corporation
HOUSING
Figure 19:7 Number of dwelling rooms in Kochi Corporation, Source: Census 2011
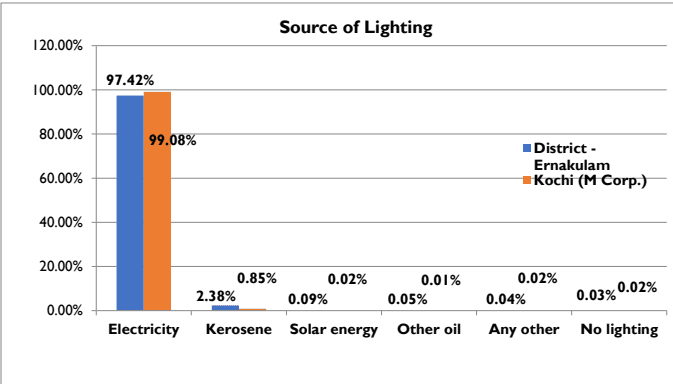
Figure 19:8 shows the sources of lighting in households as per Census 2011. The values show that 99.08% of the households are electrified.
Figure 19:8 Source of Lighting for houses in Kochi Corporation, Source: Census 2011
507
Kochi Municipal Corporation
HOUSING
19.5Slums and Other Sub-Standard Housing
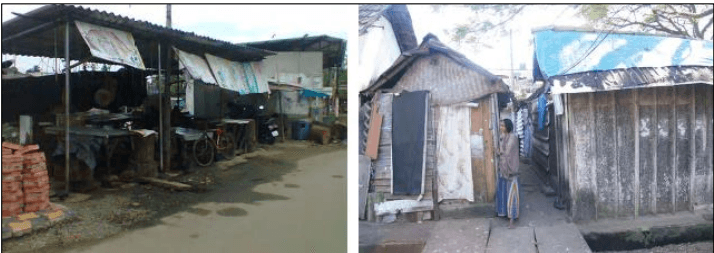
The formation of slums and squatter settlements in major urban areas in the developing world is largely attributable to the lack of resources and capability in the public sector to adequately plan for, provide, and manage the housing, infrastructure, and services needed to match demand and stimulate economic growth. In urban areas where a high rate of population growth exerts extreme development pressures, these conditions result in the rapid expansion of slum and squatter areas. UN - HABITAT defines a slum as a continuous settlement where the inhabitants are characterized as having inadequate housing and basic services. Census defines slum as a compact area of at least 300 populations or about 60-70 households of poorly built congested tenements, in unhygienic environment usually with inadequate infrastructure and lacking in proper sanitary and drinking water facilities. But even in Calicut, where the population has grown relatively slowly over the past few decades as a result of economic stagnation, slum areas have expanded and their environmental conditions have worsened because of limited government resources and capability.
Kochi Municipal Corporation
HOUSING
The economic boom of the past decade has seen Kochi soaring into one of the hottest employment hubs of the country. This has led to a large number of migrants flowing into the city, the number of such workers being the largest in Kerala. This has, however, also contributed to a growing slum-dwelling population in the city. As of 2006, there were about 349 slums in the whole of the Kochi CDP area, containing about 32,420 people. In these areas, poverty is high both in relative and in absolute terms.
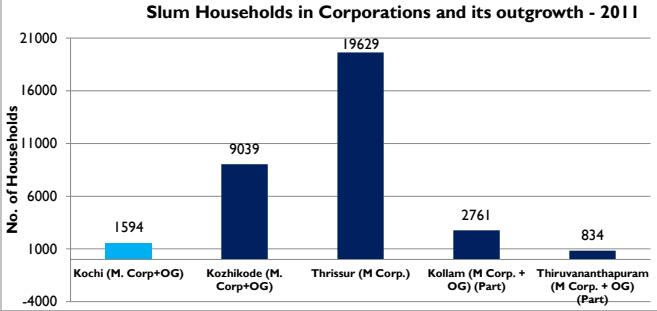
Majority of slums in the Ernakulam District are located in the corporation area. From the table below it can be observed that the proportion of slum households in Kochi Corporation including its outgrowth is less in comparison with other Corporations in the state except for Trivandrum. As per the Development plan 2031, Kochi city alone has more than 15,000 landless and homeless persons. Housing for these sections have been constructed through several scheme like VAMBAY, RAY, BSUP, DFID scheme, Janakeeya Bhavana Padhathi, credit cum subsidy under housing etc.
Figure 19:10 Slum Households in Corporations and their outgrowth-2011, Source: Census 2011 Office of the Registrar General & Census Commissioner, India
Table 192 Slum Population in Corporations of Kerala
Municipal Corporation
Total number of Slum Households
Total slum population
Male population
Female population
Kochi (M. Corp+OG)
1594
5184
2648
2536
Kozhikode (M. Corp+OG)
9039
50343
24075
26268
Kochi Municipal Corporation
HOUSING
512
Thrissur (M Corp.)
19629
79801
38545
41256
Kollam (M Corp. + OG) (Part)
2761
11659
5688
5971
Thiruvananthapuram (M Corp. + OG) (Part)
834
3320
1634
1686
Source: Census 2011
Slums in Kochi
The number of slums and their names selected for PMAY scheme in each ward in the Corporation area is given below in Table 19:3.
Table 193 Details of Slums in each ward (selected for PMAY)
Slum name
Ward No.
Popn
Name of Ward
Ward No.
Popn
Thuruthy
2
4268
Pattalathu West and South
18
747
Karingathuruthi colony
3
2387
Bangladesh parambu Colony
19
446
Paliyathparampu
3
2741
Kollasherry north colony
19
418
Adhikaravalappu colony
4
802
Tharayilparambu
20
391
BIGBEN
4
450
Federal Bank West Colony
21
473
Maliyakkalparambu colony
4
1169
SDPY West Colony
21
359
Thundiparambu colony
4
317
Venkitachalapathi Colony
21
493
Bazar Road Colony
5
1506
MundamveliSanthom Colony
22
480
Ceelattuparambu
5
511
Arayad Colony
23
242
Gelamsait colony
5
400
Athipozhi Colony
23
675
Puthukattuparambu
5
576
Fishermen Colony
23
571
Mepparambu Colony
6
229
Mukkthuparambu Colony
23
761
Kochi Municipal Corporation
HOUSING
CheraliParambu Colony
7
301
Saudi colony
23
692
Mathuttiparambu Colony
8
443
Thekkechoolezhath colony
24
1430
Ottachal colony
8
202
Kaliyathparambu Colony
25
401
Panayappilly Colony
9
1654
KurupathuParambu
25
747
Chullikkal East
10
399
Beach Colony
26
2625
EttukandamKinginikara
10
619
Kallukulam Colony
26
321
Indira Colony
10
447
Rameswaram Colony
26
1074
Karuvelipadi colony
10
936
East West Odatha
27
1038
Thakkavu colony
10
540
Holly Cross Nagar
27
1127
Achuthuthamenon enclave colony
11
438
St.JohnPattam North
27
1345
Thoppumpady Colony
11
934
Ajentha cinema colony
28
50
Valummel Colony
11
985
Alunkal Colony
28
0
Kadabagam colony
13
1690
Bhagavathiparambu Colony
28
342
Kadabhagam SD puram south colony
13
298
Kuriplavu road amravathi
28
466
Madhura Company Colony
13
1011
Palamaraparambu Colony
28
1303
Vyasapuram Colony
13
844
Palliparambu Colony
28
616
KMP Oil mill colony
14
615
SJD Colony
28
696
MangamadomPazhekkatu Colony
14
440
Vathuruthy
30
2400
Palekkattu Colony
14
575
Janakeya Road
31
674
Thangal Nagar
14
783
Mothertheresia Lane
31
549
Source: Kochi Municipal Corporation, 2018
Kochi Municipal Corporation
HOUSING
The largest slum in the Corporation area is Thuruthy slum with a population of 4268 with an area of 1 acre.
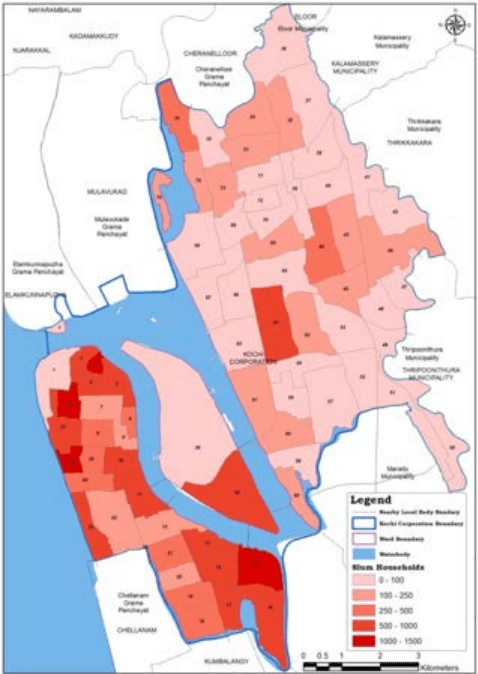
Figure 19:11 Slum Households in Each Wards Source: Kochi Corporation, 2018