Urban sanitation focuses on maintaining sanitary conditions in urban environments. The purpose of urban sanitation is to reduce risks to human health by managing factors in the urban environment which can contribute to health problems. One of the major factors is human waste, which is generated in large volumes in urban areas. Sewers which collect such waste and route it to central processing facilities are, therefore, a key aspect of urban sanitation. So are facilities like public toilets, which discourage people from using the streets as a bathroom, along with portable toilets for major events which are designed to provide attendees with a location to safely eliminate waste. Historically, urban communities gave little thought to sanitation, which turned into a major problem in some areas. A growing understanding of hygiene combined with social pressure from people tired of living in filth eventually led to the development or urban sanitation. This chapter deals with the existing on site and off site sanitation facilities in Kochi Corporation and the major constraints it faces.
Providing efficient sanitation facilities comes under 3. Good Health & Well being, 6. Clean water & Sanitation and 14. Preserving life under water of United Nations Sustainable Development Goals. The national Urban Sanitation Policy 2008 also puts forth Universal accessibility to toilets, Open defecation free cities, Elimination of manual scavenging, Ensuring safety of sanitation workers, Ensuring reuse/ recycle of treated waste water and Ensuring safe collection, treatment of all waste water in its primary agenda. The Government of India started the country wide campaign – Swach Bharat Abhiyan to eliminate open defecation and improve solid waste management.
Current Scenario
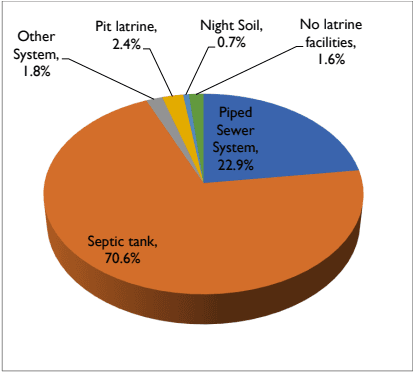
The Census of India from 2011 was the first census to include a section on household sanitation facilities. The questionnaire focused on the containment technologies present in the households. According to the Census 2011, 98.37% of all households in the Corporation area have toilet facilities within their premises with 22.9% having piped sewer system, 70.6% households having septic tanks and 4.9% with other systems including pit latrines and night soil among them. Although the Census 2011 data shows a coverage of 22.9%, the KWA estimates a coverage of 5% only - a sewer network of around 28 km and having 650 manholes. Public toilets (1.26%) and open defecation (0.36 %) play only a minor role. There is no central monitoring of onsite sanitation system and hence private parties provide the service of emptying septic tanks and pit latrines. The slum mapping exercise revealed 72% of the poor
Kochi Municipal Corporation
SANITATION
households had in-house toilet facilities, 25% depends on public toilets whereas 3% resort to open defecation (CSP Kochi, 2014).
Figure 13:1 Graph showing percentage of various methods of sanitation in Kochi Corporation Source: Census 2011
422
13.2.2Offsite sanitation
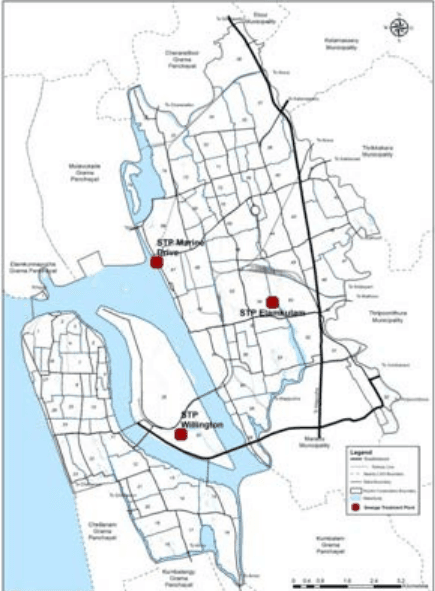
Offsite sanitation facility is done either through the sewerage system with sewage treatment plant at Elamkulam and Marine Drive or by non-networked sanitation. Sewerage deals with infrastructure encompassing components like receiving drains, pumping stations, etc. All sewer lines laid are connected to households. In Kochi, the toilet, kitchen and bathroom wastes are discharged to the sewerage system; wherever available. In non-networked sanitation, sludge from septic tanks is transported and treated at the Corporation’s two septage treatment plants, one at Brahmapuram and the other at Willingdon Island.
Sewerage System of Kochi
The sewerage system in the Corporation of Kochi is maintained by the Kerala water Authority. The scheme started in 1970. The details of the Sewage treatment and Septage treatment plants which serves the sanitation in the city are given in the table along with their capacities.
Table 132 Sewage and Septage treatment plants
STP location
Owned by
Location
Status
STP Installed capacity
Sewage treatment unit
Kerala Water Authority
Elamkulam
Operational
4.5 MLD
Sewage treatment unit
Greater Cochin Development Authority
Marine Drive
Operational
0.9 MLD
Septage Treatment Plant
Kochi Corporation
Willington Island
Operational
0.1 MLD
Septage Treatment Plant
Kochi Corporation
Brahmapuram
Operational
0.1 MLD
Source: LSGD (Planning)
Kochi Municipal Corporation
SANITATION
Figure 13:2 Location of Sewage and Septage treatment plants Source: Kochi Municipal Corporation
13.2.1Onsite sanitation
Since the network of sewers directly connected to a treatment plant is limited, septic tanks are the city’s preferred means of sewage disposal. 98.37% of households in the Corporation area have access to latrine facilities according to Census 2011.
Table 131 Household with access to toilet facilities
Indicator
Kochi Municipal Corporation
Kerala State (Urban)
% of Households with access to latrine facilities within HH
98.37
75.3
Source: Household amenities and assets, Census of India 2011
Typically, wastewater from households is routed to septic tanks; a scientifically constructed septic tank allows the waste to degenerate bacteriologically and then sends the effluent into a soak pit where it is filtered through layers of charcoal and gravel before it is released into the ground. In spite of this, most houses do not have soak pits and the liquid leaks into the ground directly which causes heavy presence of coliform bacteria in groundwater sources within the city. Combination of growth of high-rise buildings and KSPCB regulations for onsite
Kochi Municipal Corporation
SANITATION
treatment systems for high-rise and commercial establishments has increased the penetration of onsite treatment.
Regular monitoring of septic tanks is nearly impossible since they are closed and underground. Inspections are done only if visible leaks or direct disposal into drains are reported. Septic tanks attached to soak pits can have capacities between 3,000 and 15,000 litres. Residents are also unaware of when the tanks are to be cleaned out and leakage into the soil can go unnoticed. Therefore, the functioning of septic tanks is uncertain. Both residential and commercial buildings with over four floors or occupying an area of over 20,000 sq.ft are required to have STPs before the Kerala State Pollution Control Board (KSPCB) grants a permit.
13.3.1Elamkulam Sewage Treatment Plant
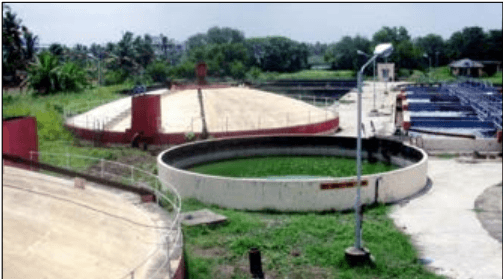
Currently, the KWA maintains one sewage treatment plant (STP) located on Fathima Road in Elamkulam, which has a capacity of only 4.5 MLD but is operating at an average of 3 MLD, although this can be expanded up to 10 MLD. The underutilisation is attributed to limited connections to the KWA’s sewerage network — 1,184 connections, including the General Hospital, St. Teresa’s College and buildings in the M.G. Road vicinity. The plant works in the activated sludge process of treatment. The plant was commissioned in 1955. Treated effluent is discharged into the Elamkulam Thodu and is not reused or recycled for irrigational and industries purposes. The Elamkulam plant does not have the facility to receive waste from septic tank cleaning vehicles. The facility can be installed and the plant’s capacity can be also expanded according to officials. Out of 100 MLD sewage generated, the STP treats only 3%. BOD (Biological oxygen demand) of the incoming sewage is 317 and that of effluent is 18.
Kochi Municipal Corporation
SANITATION
Table 133 Characteristics of STP at Elamkulam
Location
Capacity (MLD)
Inflow in the STP (MLD)
Efficiency in %
Elamkulam
4.5
3.00
67
Source: Kochi Municipal Corporation
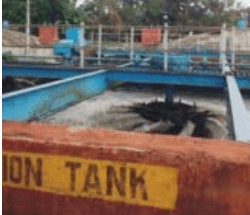
Figure 13:3 View of STP at Elamkulam Source: CDP 2006
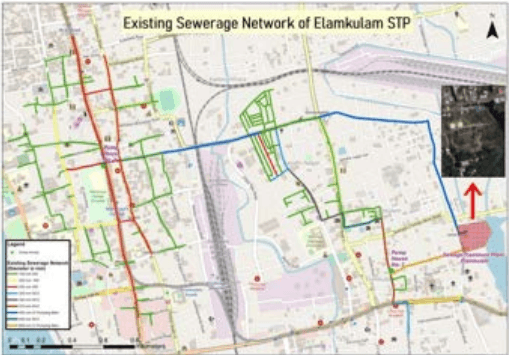
Figure 13:4 Figure showing the existing sewerage network of Elamkulam STP Source: KWA,2021
Kochi Municipal Corporation
SANITATION
13.4.113.4.1 Demand Supply Gap Assessment
Assessing the demand-supply gap in terms of provision of sewerage, it can be observed that there is a gap in provision of sewerage network, coverage of households for sanitation and facility of STP in the Corporation area. The supply in terms of on-going projects and existing facilities is very less in proportion when compared with the demand of the population. Nearly 104.28 MLD sewage is left untreated due to the low capacity of existing STP. Also, only 28 km of sewerage network is laid in the city whilst 955 km of sewerage network is required to cover the entire Corporation area.
Initiatives for improvement of Sewerage System
KSUDP, KWA, CSML, KMRL and AMRUT have proposed various initiatives to address parts of the sewerage management for Kochi
13.5.1 Proposed Sewerage Component under KSUDP
The KSUDP proposal aimed at extension of the sewerage networks in South Ernakulam and North Kochi, extending the existing STP at South Ernakulam for additional 10 MLD capacity, construction of a 20 MLD STP, procurement of sewer cleaning equipment, in order to collect and treat approximately 30 MLD of sewage from 160,000 users in the urban areas of Kochi Corporation. Total component beneficiaries at EOP (2011) are expected to be 573,300 of which 40,800 are poor.
13.3.3Septage Treatment Plant at Willington Island
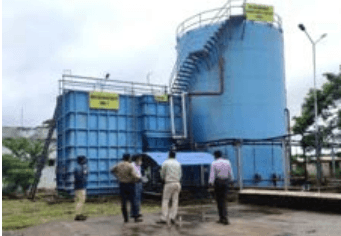
Kerala Sustainable Urban Development Project (KSUDP), under state government of MoUD, has constructed two septage treatment facilities (each 100 m3) at Brahmapuram and Willingdon island. The treatment consists of upflow anaerobic sludge blanket followed by moving bed bioreactor and dewatering in sludge drying bed. The plant at Willingdon Island
tanker loads, began operations since November 2017. Septage is bought to the facility by desludging trucks operated by private contractors. Treated water from the facility is used for agricultural purposes and dewatered sludge is used as manure in agricultural fields. The facility treats septage from ships, port area, and also admits waste from the city.
Septage Treatment Plant at Willingdon Island, Kochi 13.3.4 Septage Treatment Plant at Brahmapuram
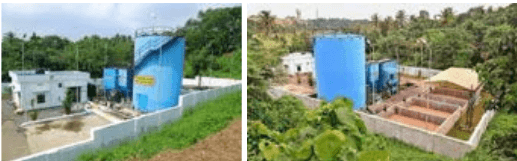
The Septage Treatment Plant situated at Brahmapuram plant is in an area of 35 cents has an average receiving capacity of 20 truck loads with a tipping fee of Rs.400 per truck; it can currently handle only 12 loads. The plant began functioning since 2016.The plant uses anaerobic digestion of septage followed by aerobic treatment. The plant is designed with Up Flow Sludge Blanket Type Anaerobic Reactor. UASB uses an anaerobic process whilst forming a blanket of granular sludge which suspends in the tank. Wastewater flows upwards through
Kochi Municipal Corporation
SANITATION
the blanket and is processed (degraded) by the anaerobic microorganisms. The FSTP at Brahmapuram sometimes faces issues getting septage as there is opposition from locals.
Septage Treatment Plant at Brahmapuram
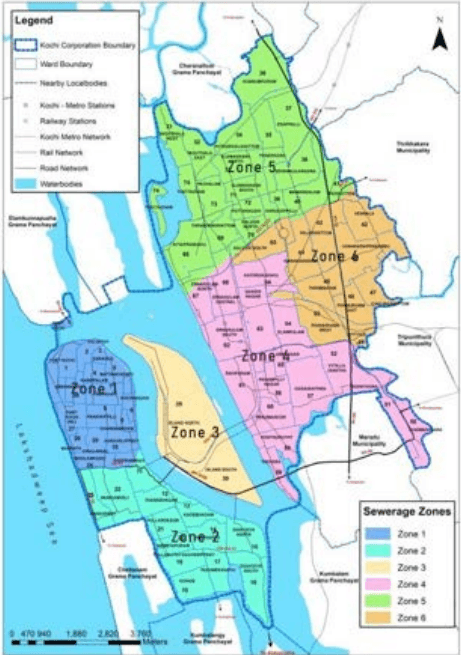
Figure 13:5 Zones covered under sewerage system Source: SFD Report, 2016
427
Kochi Municipal Corporation
SANITATION
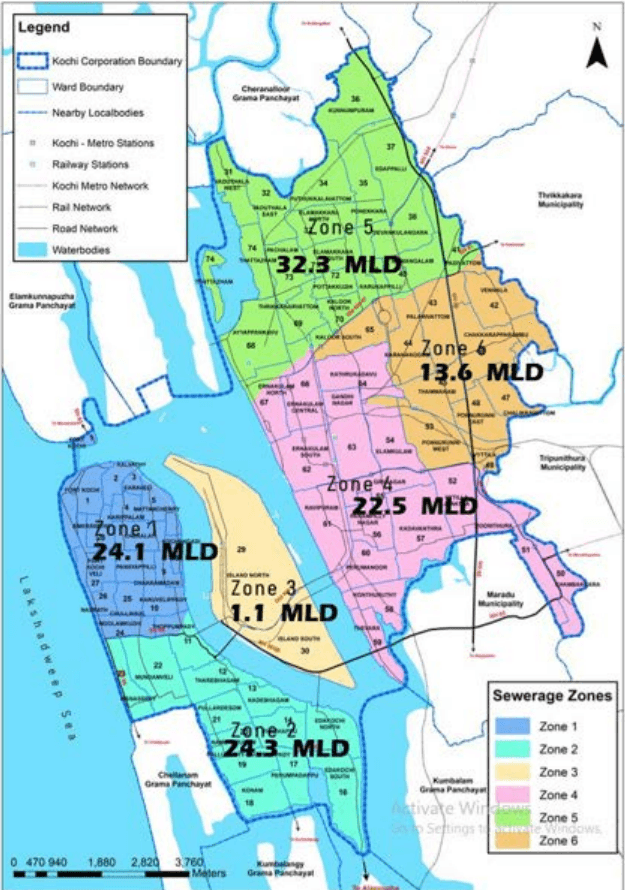
The figure above shows the Kochi Corporation area divided into 6 Sewage Zones which were identified based on topography, slope, demographic parameters and physical characteristics with due weightage to the practical considerations. Zone 1 and Zone 2 covers the north and south sides of West Kochi area while Zone 3 covers the Willingdon island. Zone 4 and Zone 5 includes the southern and northern sides of the mainland while the eastern side of the mainland is included in Zone 6.
Since the network of sewers directly connected to a treatment plant is limited, septic tanks are the city’s preferred means of sewage disposal. In non-sewered system, emptying of septic tank is also done by private service providers. The sector is not properly regulated or monitored. Illegal dumping of this septage and the pollution of surface waters are the consequence. Illegal manual scavenging is also reported. Disposal of wastewater and sludge has become a major problem in the city. The sewage treatment plants (STP) that serve the city are ill-equipped to deal with the enormous volume of waste that the city generates.
As per Service Level Improvement Plan (SLIP 2017 – 18), the city is divided into 19 zones. The zone wise sanitation coverage of households as per SLIP 17- 18 is shown in the table below. It shows that households with sewerage network are only included in Zones 1 and 2.
Table 134 Zone Wise Sanitation Facilities Coverage of Households as per SLIP 17 -18
Zone No
Total No of Households
Households with Sewerage Network
Households with Septic Tank
Households without any outlets for toilets
1
4960
2600
2147
213
2
3663
1900
1604
159
3
4783
0
4352
431
4
19461
0
17602
1859
5
10531
0
9853
678
6
9602
0
8738
864
7
9504
0
8648
856
8
4989
0
4540
449
9
17806
0
16203
1603
10
5121
0
4660
461
11
5312
0
4833
479
12
7141
0
6498
643
13
8325
0
7576
749
Kochi Municipal Corporation
SANITATION
14
7164
0
6519
645
15
5819
0
5295
524
16
3952
0
3596
356
17
11825
0
10761
653
18
7255
0
6602
653
19
4199
0
3821
378
Total
151412
4500
133848
13069
Source: Service Level Improvement Plan (Slip), Kochi Corporation
From the above table, 3% of the households are connected to the existing sewerage system, 88% of the households are with septic tank, and the remaining 8% of the households are not connected to either sewerage or septic tanks. This amounts to sewer network of around 28 km and having 650 manholes which cover about 5% of the city area.
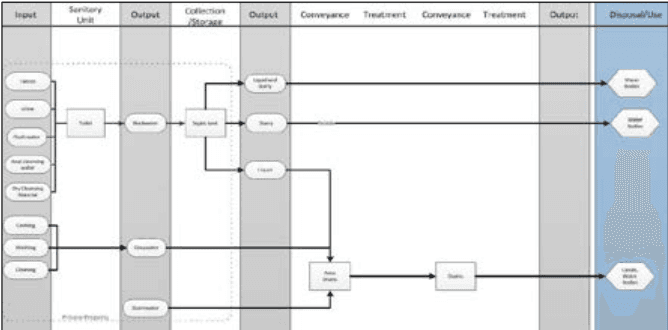
Figure 13:6 Schematic of typical wastewater flows in Kochi, Source: CSP 2011
The schematic layout showing wastewater flow in Corporation of Kochi is given in Figure 13:6. It can be observed that the wastewater (grey water and Black water) is discharged along with storm water to the water bodies. City has a separate drainage system which is designed to carry storm water. But sewage is also disposed to these drains in many places. Though intermixing of sewage with storm water reduces sewage concentration; disposal of the same into the water bodies causes a serious threat to the pollution of water bodies. Also, there is no mechanism for the reuse or recycle of waste water prior before entering the water bodies. This necessitates the need for the reuse of wastewater for required purposes.
KWA, KMC, Cochin Port Trust (for Willingdon Island), and other local bodies
KWA
KWA
KWA, KMC, Cochin Port Trust (for Willingdon Island), and other local bodies, KSPCB
On-site Sanitation
KWA, KMC
KWA, CoC, Cochin Port Trust (for Willingdon Island), and other local bodies
KWA, KMC
KWA, KMC, Cochin Port Trust (for Willingdon Island), and other local bodies
Faecal sludge Management
KMC, KSUDP
KSUDP, Suchitwa Mission
KMC
KMC
KMC, KSPCB
Source: SFD Report, 2016
The sewerage system in the city is at primitive stage and hence falls below the service level norms. Coverage of sewerage network is only 5% and needs a substantial improvement to satisfy the MoUD Benchmark and do not keep pace with the growth of the city.
Waste Water Calculation
The waste water calculation is done based on the institutional waste water generation and domestic waste water generation. The institutional waste water generation is based on the number of various institutions in the corporation area. The institutional waste water generation is taken as 60% of the total consumption. The domestic water consumption is calculated based on 150 LPCD. The domestic waste water generation is assumed to be 65% of the total water consumption. The domestic and institutional waste water generation is
430
Kochi Municipal Corporation
SANITATION
added and projected for horizon year which is then compared with the existing capacity to assess the gap.
431
Table 136 Tabulation of institutional waste water generated in the city
No. of establishm ents (approx)
LPCD
No. of seats/beds/users(approx)
Total water consumptio n / day (L/day)
Quantity of waste water generated/day(L/day)
1
Hotels
97
180/ bed
10000
1800000
1080000
2
Restaurants
98
70/ seat
6500
455000
273000
3
Hospitals with number of beds exceeding100
17
450/ bed
6800
3060000
1836000
4
Hospitals with number of beds less than 100
146
340/ bed
1400
476000
285600
5
Nurse Homes
8
135/head
1200
162000
97200
6
Hostels
15
135/head
1500
202500
121500
7
Boarding schools and colleges
4
135/user
1350
182250
109350
8
Day schools and colleges
383
45/ user
100000
5728500
3437100
9
Offices
900
45/ head
18650
839250
503550
10
Factories
67
30-45/head
5000
200000
120000
11
Cinema halls/concer t halls
5
15/ seat
13.3.2Marine Drive Sewage Treatment Plant
To service the sewer network in the Marine Drive area, the GCDA maintains a small STP, located at Marine Drive — Shanmugham Road area that treats waste from a 2-km sewerage network in the Marine Drive. The overall capacity of the STP is 900 m3and has been
operational since 1984, but does not treat waste from tankers. The plant has a collection tank, aeration chamber (diffused type), clarifloculator, and a filter bed. Treated effluent is discharged into the sea nearby. A report from the KSPCB analysing the effluent from the GCDA STP shows that the effluent discharged from the STP are within desirable limits for pH, suspended solids (SS), biochemical oxygen demand (BOD) and oil and grease. GCDA is also operating an STP of 750 KLD in JLN Stadium. This is operating for JLN Stadium and shops around it.
GCDA STP at Marine Drive
13.5.3KMRL Projects
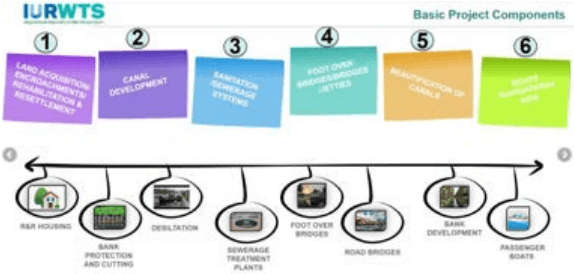
The Kochi Metro Rail Ltd (KMRL) under Integrated Urban Regeneration and Water Transport System Project (IURWTS) have taken over the project to renew and regenerate major canals in the city of Kochi. Canals take up in this project include Edappally Canal, Chilavannoor canal, Perandoor canal, Thevara canal, Market canal and Konthuruthy Canal havinga a total length of 34.98 km. Major activities included in the project are Canal
Kochi Municipal Corporation
SANITATION
436
development, Canal Bank Infrastructure development and other ancillary infrastructure development. Under the above project KMRL has proposed setting up of 4 Sewage Treatment Plants at Vennala, Muttar, Perandoor and Elamkulam. The details of KMRL sanitation projects are given in Table 13:8.
Figure 13:9 Major project components of IURWTS Project under KMRL Source: Official website of KMRL
Table 138. Details of KMRL sanitation projects under IURWTS
Sl No
STP
Capacity (MLD)
Expected Start
Expected Finish
1
Vennala
10
September 2022
March 2026
2
Muttar
7
September 2022
March 2026
3
Perandoor
4
September 2022
March 2026
4
Elamkulam
10
September 2022
March 2026
Source: KMRL, 2021
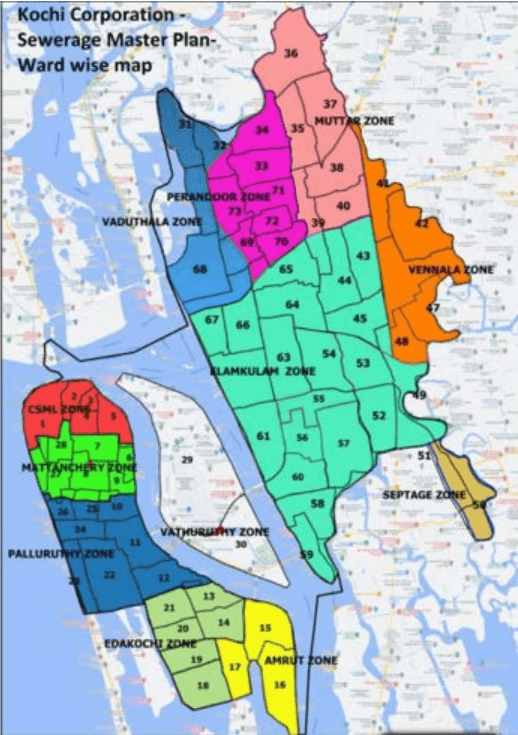
13.5.2Master Plan of Sewerage for Kochi Corporation prepared by Kerala Water Authority
To cope with the emerging need of waste water management, a sewerage vertical wing has been created in KWA for investigation, planning, design and DPR preparation of Sewerage projects. The KWA has prepared a Master plan of Sewerage for Kochi Corporation. The horizon year for this master plan is 2053 with an expected sewer load of 146.46 MLD in the horizon year. For this, the whole of Kochi Corporation is divided into 12 zones based on topography, population density etc. and proposals are formulated based on this.
434
Kochi Municipal Corporation
SANITATION
Figure 13:8 Sewerage Zones identified by KWA Source: KWA,2020
1800
27000
16200
Kochi Municipal Corporation
SANITATION
12
Apartments
600
135/head
240000
32400000
19440000
13
Other Establishments
a
Shopping mall/shopping centers/markets
58
35/user
40000
1400000
840000
b
MSME's
1899
35/ user
13500
472500
283500
c
Town hall/ public hall/ auditorium
22
40/ user
37200
1488000
892800
d
Metro terminals
13
45/ user
47603
2142135
1285281
e
Railway Terminals
3
45/ user
74016
3330720
1998432
f
Boat Jetty
60
45/ user
15000
675000
405000
g
Kochi Port
1
70/ user
900
63000
37800
Total
55.1 MLD
33.06 MLD
Source: LSGD (Planning)
Adding up the institutional and domestic demand, the total grey water is calculated. With this, the total septage is also added to get the Total Liquid Waste. The present total liquid waste generation is 110 MLD and the projected liquid waste generation by the horizon year is 118 MLD.
Table 137 Computation of total liquid waste
Present(2020)
Horizon Year(2040)
Institutional Grey Water
33.06 MLD
36.30 MLD
Domestic Grey Water
75.92 MLD
79.95 MLD
Total Grey Water
108.98
116.25
Total Septage
0.9 MLD
1 MLD
Total Liquid Waste
109.88 ~ 110 MLD
117.25 MLD ~ 118 MLD
Source: LSGD (Planning)
432
The total projected waste water generation is distributed among the 6 sewerage zones in Kochi Corporation earlier mentioned which were identified based on topography, slope and physical characteristics with due weightage to the practical considerations. The zonal wise distribution of waste water in the horizon year is shown in Figure 13:7.
Kochi Municipal Corporation
SANITATION
Figure 13:7 Zonal wise distribution of waste water in Kochi Municipal Corporation area Source: LSGD (Planning)
Kochi Municipal Corporation
SANITATION
At the time of such high water scarcity, the water, which can be used for purposes other than drinking, is being wasted. This can be minimised if this water can be recycled to fit for purposes like gardening, industries, and flushing requirements which need lesser quality water. This recycling can be done at HH level, Cluster level or at city level. This also reduces the raw wastewater entering the water bodies through storm water drains.