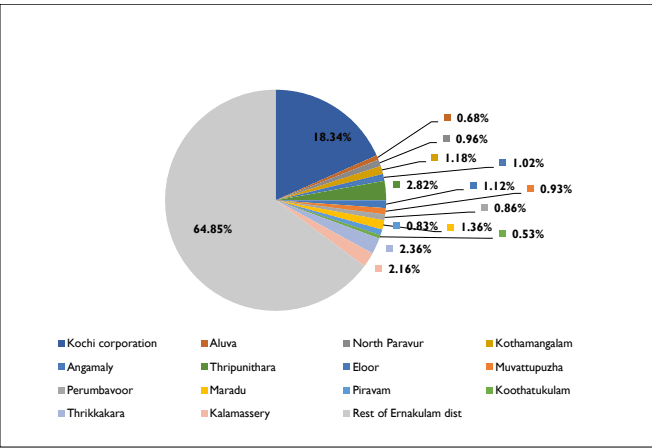
The Demographic parameters help in understanding the pattern of population within a city. This chapter gives a brief account on the Population size, Population density and other demographic aspects.Ernakulam district has the credit of being the economic nerve centre of the state. It is the industrially advanced and flourishing district of Kerala. According to 2011 Census, Ernakulam district has a population of 3,282,388 persons with an average density of 1,072 persons per sq. km. Out of the total Ernakulam population as per 2011 census, 35.15% lives in urban regions of district. Figure below shows percentage share of population in Kochi and other urban local bodies, Ernakulam district.
Figure 4:1 Percentage share of population in Kochi and other urban local bodies, Ernakulam district. Source : Census 2011
As per census 2011, the population of Kochi Municipal Corporation is 602046 which amounts to 18.34% of the total population in the district. Area wise, Kochi Corporatiom amounts to just over 3% of the total area of the district. When compared to the other urban local bodies
Kochi Municipal Corporation
DEMOGRAPHY
in the district, Kochi has the highest share of urban population in the District, even higher than the total share of population of other urban local bodies in the district. Percentage share of population of Kochi Municipal Corporation and that of Eranakulam District is shown in figure 4.2.
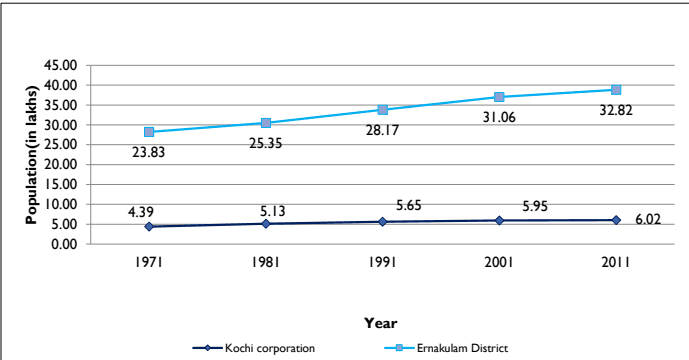
The municipal population is also growing in a very slow pace. It is evident that the growth within the municipal limits is witnessing saturation .The variation of the population from 1971 onwards, in comparison with the District is shown in figure below.The population for Kochi Municipal Corporation had increased from 4.39 lakh in 1971 to 5.95 lakh in 2001 and eventually reached 6.02 lakh in 2011. Table 4-1 shows population growth trend of Eranakulam District and Kochi Municipal Corporation.
Figure 4:2 Temporal variation of population of Kochi and Ernakulam district 1971-2011 Source: Census data
Table 41 Population growth trend of Ernakulam District and Kochi Corporation (1971-2011)
Name / Year
Population per year
1971
1981
1991
2001
2011
Kochi corporation
439066
513249
564589
595575
6,02,046
Ernakulam District
2383178
2535294
28,17,236
31,05,798
32,82,388
Source: Census data
Kochi Municipal Corporation
DEMOGRAPHY
Population Size
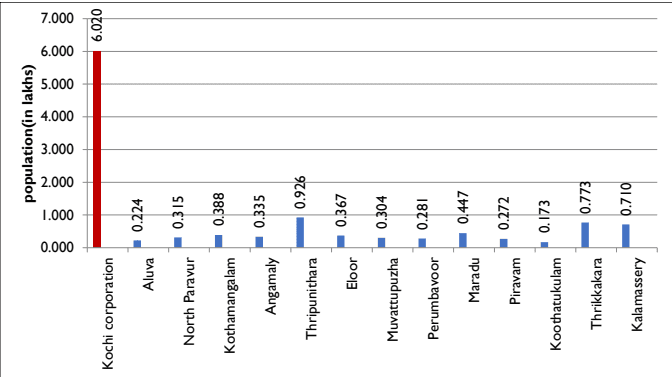
Kochi Municipal Corporation being the only first order settlement in the district is the most highly populated urban local body in the district as shown in the figure below. It has a geographical area of 94.88 Sq.km. Its population is more than 6 folds the highest populated Thripunitura and 35 times the least populated Koothattukulam among the other urban local bodies in the district. Figure 4-3 shows the comparison and Table 4-2 shows population of Kochi Corporation area and other urban local bodies in Eranakulam District
Figure 4:3 Comparison of the population of Kochi Municipal Corporation with other Urban Local Bodies in the district Source: Census 2011
Table 42 Population of Kochi corporation area and other urban local bodies in Ernakulam District
LSG's
2001
2011
Kochi corporation
595575
602046
Aluva
24110
22428
North Paravur
30059
31503
Kothamangalam
37173
38837
Kochi Municipal Corporation
DEMOGRAPHY
Angamaly
33409
33465
Thripunithara
59884
92550
Eloor
35573
36722
Muvattupuzha
29246
30397
Perumbavoor
26547
28110
Maradu
41012
44704
Piravam
27263
27229
Koothatukulam
17253
17253
Thrikkakara
65984
77319
Kalamassery
63116
71038
Source: Census data
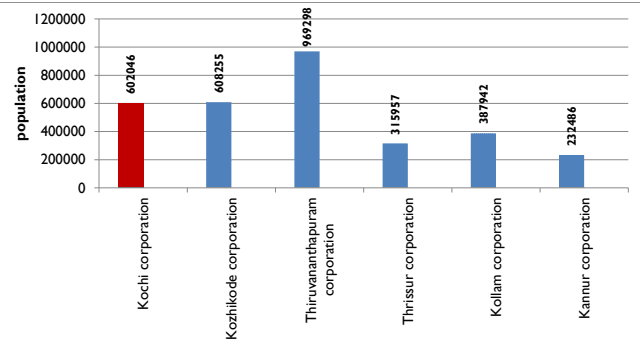
It is the third highly populated municipal corporation in the state after Thiruvananthapuram corporation (969298) and Kozhikode corporation (608255) as shown in figure below. Kannur being the recently formed municipal corporation has the least population among the municipal corporations.
Figure 4:4 Comparison of Population of Kochi with other municipal corporations in the state-2011 Source: Census -2011
Kochi Municipal Corporation
DEMOGRAPHY
Population Growth Rate
Kerala started showing a constant decline in population growth rate since 1981 census. The net addition to the population has also been continuously less ever since. The population growth rate of the state in the last decade (2001-2011) is 4.86, less than the growth rate of 1991-2001. The growth of population during 2001-2011 has declined in all the districts of the State including Ernakulam, when compared to the growth rate in 1991-2001. Even so, Ernakulam district is among those districts having population growth rate of 5.69, higher than the State average during 2001-2011, together with Kasaragod, Malappuram, Palakkad and Kozhikode, all of which fall in the middle and North Kerala. (Source: Census 2011).
In the recent years due to many large scale development projects, especially in the construction sector and information technology, substantial employment opportunities are generated in Kochi and this is a positive factor for migration. However, sharp increase in land values and scarcity of developable land prevent lower and middle income group families from buying land within the city for residential purposes. This has made a good percentage of people to opt for residences in the outskirts of the city. Though the trend reduces migration, it increases floating population in the city.
The contributing factors of population growth in the area are mainly the natural increase and the migration from nearby rural areas for trade and employment. Even though the natural growth rate of population does not show exorbitant increase, floating population and migration in Kochi are to be considered while proposing infrastructure requirements. Facility for daily commutation from the region around adds to the increased number of floating population in the city.
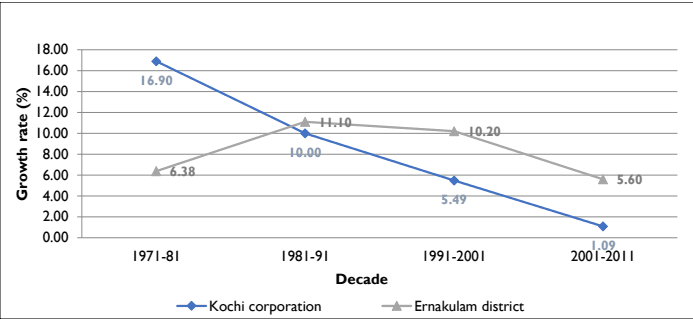
Population growth from 1971 to 2001 shows a gradual decreasing trend in the corporation in tune with the Urban Local bodies. Declassification of some of the urban settlements of 1991 and the resultant reduction in urban areas is a major factor leading to this situation. This is a pattern of urban growth contrary to the popular belief that there is in migration of people into the urban area. Table 4.6 shows the temporal variation of decadal population growth rates of Kochi Municipal Corporation with that of Ernakulam district.
The comparison of decadal growth rate with other local bodies in the district is shown in Figure 4-7. The growth rate of Kochi Municipal Corporation decreased from 10% in 1981-91 to 1.09% in 2001-11. The present decadal population growth rate of Kochi city is 1.09 %, which is very low when compared to the decadal growth rate of the district and state being 5.6% and 4.87%.
Kochi Municipal Corporation
DEMOGRAPHY
Figure 4:5 Temporal variation of Decadal population growth rates of Kochi Municipal Corporation and Ernakulam District 1971-2011 Source: Census -2011
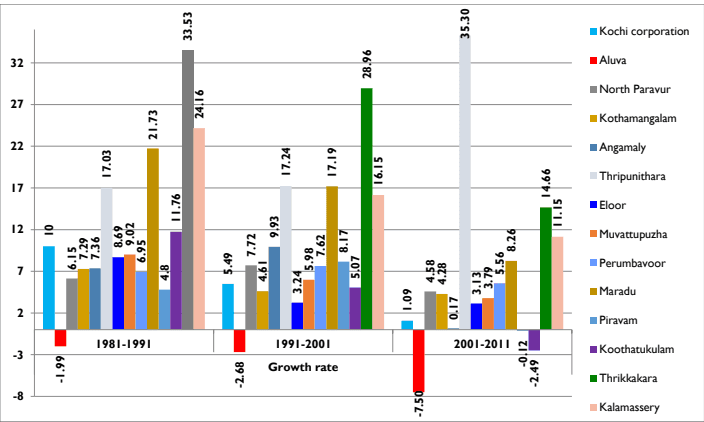
When compared to the other urban local bodies in the district, Kochi has a very low decadal population growth rate. Neighbouring towns like Thripunithura, Thrikkakkara and Kalamassery are the fastest growing urban local bodies in terms of population with growth rates of 54.55%, 17.18% and 12.55%.The high growth rate of Thripunitura is associated with the change in its administrative area after adding Thiruvamkulam to it. However the growth rates of all these urban local bodies show a declining trend with Aluva, Piravom and Koothattukulam showing negative growth rates. Table 4-3 shows the population growth rates of other urban local bodies in the district for the past three decades. This is graphically represented in Figure below. The lower growth rate in Kochi Corporation area can be attributed to the increasing land value, thereby forcing people to settle in the suburbs. Since the urban spread has extended far beyond the limits of the corporation area and availability of better transportation facilities to connect with the corporation area have increased, more and more people are attracted to settle in the neighbouring local bodies also. This can also be a rationale behind lower growth rate of Kochi Corporation.
Table 43 Population Growth rates of urban local bodies in Ernakulam District 1981-2011
LSGs
Population
Growth rate
1981
1991
2001
2011
1981-1991
1991-2001
2001-2011
Kochi corporation
513249
564589
595575
602046
10
5.49
1.09
Aluva
25278
24774
24110
22428
-1.99
-2.68
-7.50
Kochi Municipal Corporation
DEMOGRAPHY
North Paravur
26288
27906
30059
31503
6.15
7.72
4.58
Kothamangalam
33122
35535
37173
38837
7.29
4.61
4.28
Angamaly
28307
30391
33409
33465
7.36
9.93
0.17
Thripunithara
43646
51078
59884
92550
17.03
17.24
35.30
Eloor
31701
34455
35573
36722
8.69
3.24
3.13
Muvattupuzha
25313
27595
29246
30397
9.02
5.98
3.79
Perumbavoor
23064
24667
26547
28110
6.95
7.62
5.56
Maradu
28749
34995
41012
44704
21.73
17.19
8.26
Piravam
24048
25203
27263
27229
4.8
8.15
-0.12
Koothatukulam
15057
16828
17682
17253
11.76
5.07
-2.49
Thrikkakara
38318
51166
65984
77319
33.53
28.96
14.66
Kalamassery
43767
54342
63116
71038
24.16
16.15
11.15
Source: Census -2011
Figure 4:6 Comparison of population growth rates with other urban local bodies in the district 1981-2011 Source: Census -2011
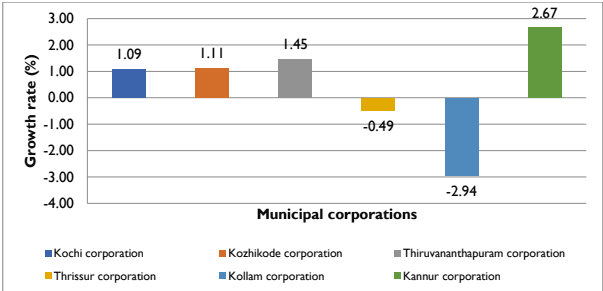
When compared with other municipal corporations,Thiruvanathapuram, Kozhikode and Kannur corporations have slightly higher population growth rates while Thrissur and Kollam exhibits negative population growth rates as shown in figure below.
Kochi Municipal Corporation
DEMOGRAPHY
Figure 4:7 Comparison of Population growth rates with other municipal corporations in the state- 2011 Source: Census -2011
Population Density
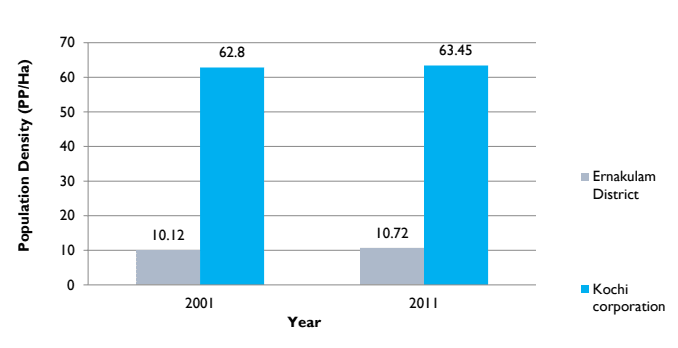
The Corporation of Kochi has a very high density as compared to the surrounding area and it is also the most densely populated city in the state. It has a geographical area of 94.88 Sq.km, which is 1/4th of the total area of KCR, but more than 50% of the total population of the region resides here. The gross, net and residential density was computed from Census 2011 and Land Use survey 2020. The gross density is obtained by dividing number of persons to the net area. The Net area is obtained by deducting the water bodies from the gross area. The density of Kochi Corporation area is 6345 persons per Sq. km which is almost double of the density in Kochi City Region (3190). Population density of Kochi Corporation was 6280 persons/sq.km in 2001 which increased to 6345 persons/sq.km in 2011.The net density of Kochi Corporation is 7857 persons per sq.km while the net density is highest in the state being 16802 persons per sq.km as shown in Table 4-4. The decadal variation of population density of Kochi Municipal Corporation and the district is shown below.
Table 4:4 Gross , Net and Residential Density of Kochi from in 2011
54
Gross area (sq.km)
Gross density (persons/sq.km)
Net area* (sq.km)
Net density (persons/sq.km)
Residential area (sq.km)
Net Residential density(persons/sq.km)
94.88
6345
76.63
7857
35.83
16802.85
Source: LSGD (Planning)
Kochi Municipal Corporation
DEMOGRAPHY
Figure 4:8 Comparison of Population density with Ernakulam district and Kochi Municipal Corporation 2001 - 2011 Source: Census -2011
Table 45 Temporal change of Population Density in Kochi from 2001-2011
Administrative divisions
Area (Ha)
Population in Lakh
Population Density (P/Ha)
4.5Sex ratio
Sex Ratio is a major indicator of the social wellbeing and women-friendliness of a society. In 2011, Kerala’s sex ratio of the general population, 1084, was the highest among the states of India. The urban Kerala exhibited a higher sex ratio of 1091 when compared to rural areas (1077). The sex ratio has increased by 26 females per 1000 males than the last decade, in the state. All the districts of Kerala have a positive sex ratio in 2011.
63
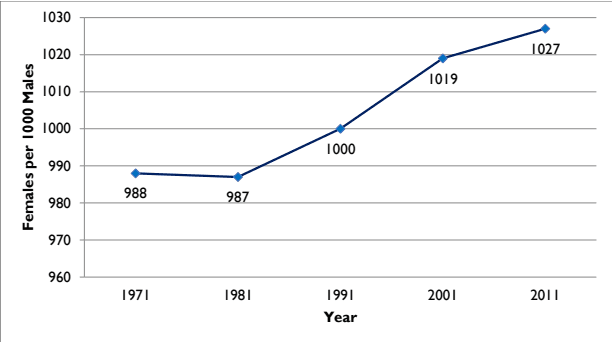
In 2011, the city had a population of 6, 02,046 of which male and female population was 296,949 and 305,097 respectively. The sex ratio within the Kochi Municipal area stood at 1027 females per 1000 males (2011). It is observed that the sex-ratio is higher than the national average of 940 in 2011. But the sex ratio of Kochi Corporation is below the average sex ratio of the state. The urban (1029) and rural (1021) areas of the district also exhibit sex ratios lower than the state average (1091, 1077).
Kochi has improved by 40 points in sex ratio between 1981 and 2011, much lower than the 52 points improvement in the state in this time period. The increase in the sex ratio from the last two decades indicates the improvement in health and education of the women in the district. It has an urban sex ratio higher than the rural sex ratio, in line with the trend in the state.
The significant change in the work pattern of women between 1981 and 2011, and the associated increase in women residing in the urban areas due to employment opportunities, would have also contributed positively to divisions the higher change in urban sex ratio. While the sex ratio analysis presents an overall pleasing picture of in the Corporation and the planning area, it also puts forth challenges in terms of creating more employment opportunities, especially women friendly ones, to reduce the economic dependency. It also reminds the necessity of women friendly measures in all sectors and services, like education, health, water supply, sanitation, transportation, and particularly in safety and security. Figure below gives the decadal variation of sex ratio in Kochi Corporation. It shows the sex ratio is steadily increasing in Kochi
Kochi Municipal Corporation
DEMOGRAPHY
Figure 4:15 Decadal variation of sex ratio of Kochi Corporation: 1971-2011 Source: Census 2011
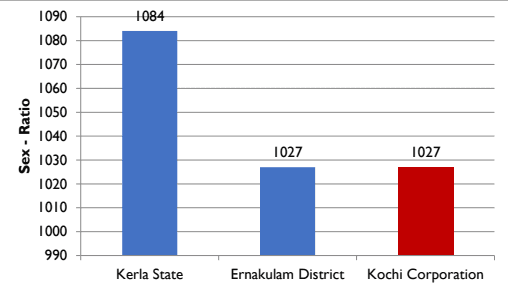
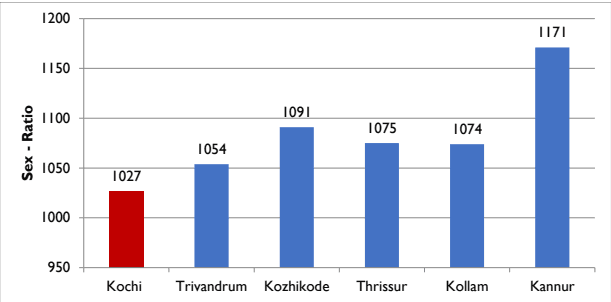
The sex ratio of Kochi is same as the district figure of 1027. It is lower than that of the state and lowest among all other municipal corporations of the state. Comparison of sex ratio with state and the district is shown in Figure 4-16.
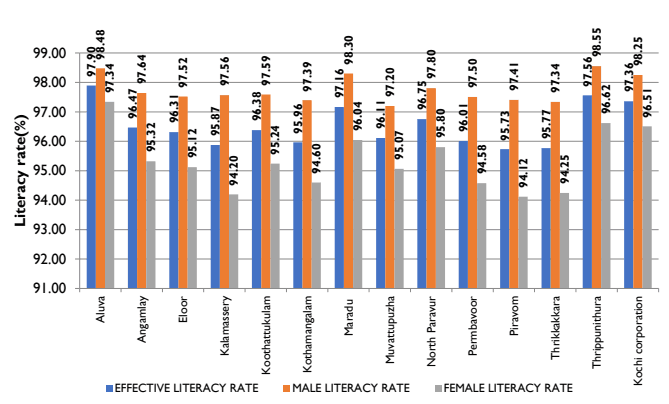
4.8Literacy rate
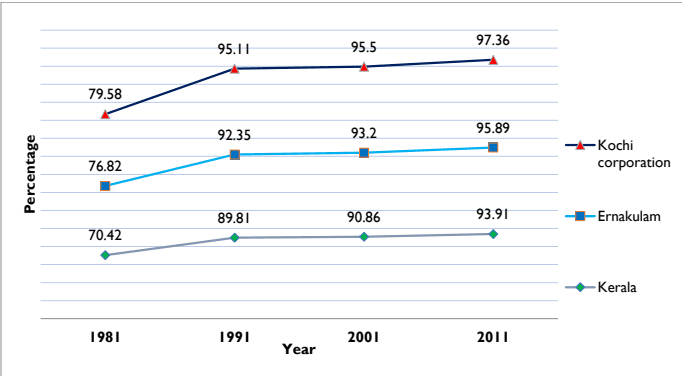
Kerala has been the most literate state of the Nation and in 2011; the effective literacy rate is 93.91% against 74.04% of India. The male literacy is 96.02% while that of females is 91.98%. Male literacy rates are higher than the female literacy rate, both in urban and rural areas. Ernakulam District has an effective literacy rate higher than the state average, of 95.89%. In tune with the general scenario in the state, Ernakulam district’s male literacy rate (97.36%) is higher than the female literacy rate (94.46%). Also, the urban literacy rate (96.22%) is slightly higher than the rural counterpart (95.18%). The temporal variation in effective literacy rate is presented in Figure 4-25. It can be seen that the literacy rates are constantly increasing and followed an almost similar pattern. Kochi Corporation (97.36%) has higher literacy rates than the District (95.89%) wherein male literacy rate (98.25%) is higher than the female literacy rate (96.51%).
Figure 4:25 Effective literacy rate –temporal variation of Kochi Corporation, Ernakulam District and Kerala State from 1981-2011 Source: District census handbook 1981-2011
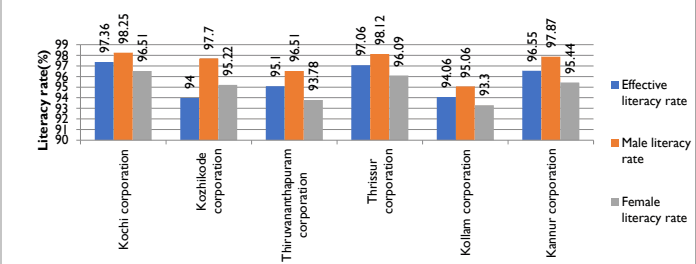
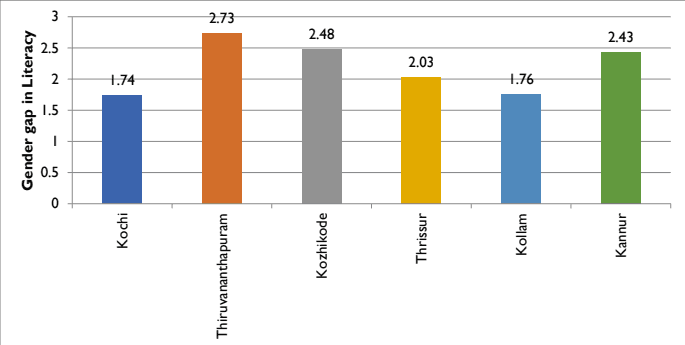
Comparison of literacy rate with other municipal corporations as in Figure 4-26 shows that Kochi has the highest effective literacy rate, male literacy rate and female literacy rate followed by Thrissur. The rates are lowest in Kozhikode and Kollam corporations. Among the municipal corporations, the gender gap in literacy is least in Kochi (1.75) while highest in Thiruvananthapuram followed by Kozhikode and Kannur.
Kochi Municipal Corporation
DEMOGRAPHY
Figure 4:26 Comparison of literacy rate with other municipal corporations-2011 Source: Source: Census 2011
While comparing the literacy rates with other urban local bodies in the district as shown in Figure 4-27, Aluva has the highest effective literacy rate (97.90), followed by Thripunitura (97.56). Kochi stands third in effective literacy rate. Least effective literacy rate is for Piravom (95.73) and Thrikkakkara (95.77).
4.2Household Size
Household size is the number of persons (irrespective of age) living as an economic unit in each household. Table 4-9 gives the decadal variation of the household size of the State, Ernakulam district and Kochi Corporation. As it is evident, the shift of the households from
Kochi Municipal Corporation
DEMOGRAPHY
joint family to micro family system, the household size is showing a decreasing trend in the state, district and corporation levels.
Table 49 Temporal change in Household size State, District and Corporation area
State/District/LocalGovernment
1981
1991
2001
2011
Kerala
5.75
5.28
4.7
4.3
Ernakulam District
5.75
5.07
4.5
4
Kochi corporation
5.9
5.3
4.5
4
Source: Census data
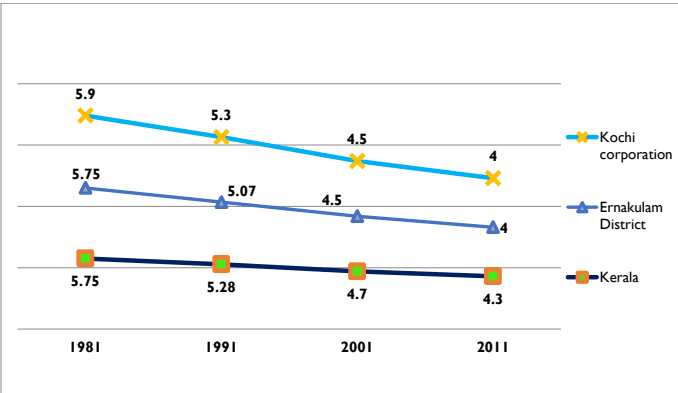
The average household size observed in Kochi Corporation for years 1981, 1991, 2001 and 2011 are 5.9, 5.3, 4.5 and 4 respectively. The trend is graphically represented in Figure 4-29.
Figure 4:29 Decadal Variation of Household size of the State, District and Kochi Corporation from 1981-2011 Source: Census data
Kochi Municipal Corporation
DEMOGRAPHY
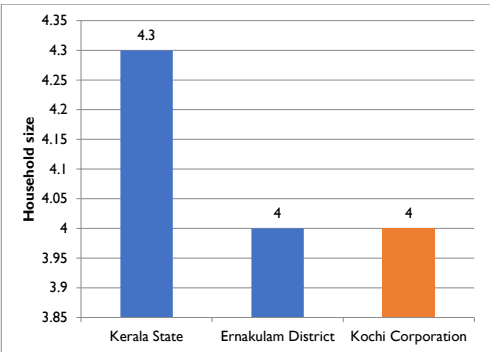
Figure 4-30 gives the comparison of Household size of Kochi Municipal Corporation with Ernakulam district and the state. Analysis shows that the average household size of 4 in Kochi Corporation is same as the district and lesser than the state average.
Figure 4:30 Comparison of Household size of Kochi Corporation with district and the state Source: Census data
2001
2011
2001
2011
Ernakulam District
306300
31.05
32.82
10.12
10.72
Kochi Corporation
9486
5.95
6.02
62.8
63.45
Kochi city region
36972
11.6
11.8
31.5
31.9
Source: Development Plan of Kochi City Region-2031 (draft), Census data
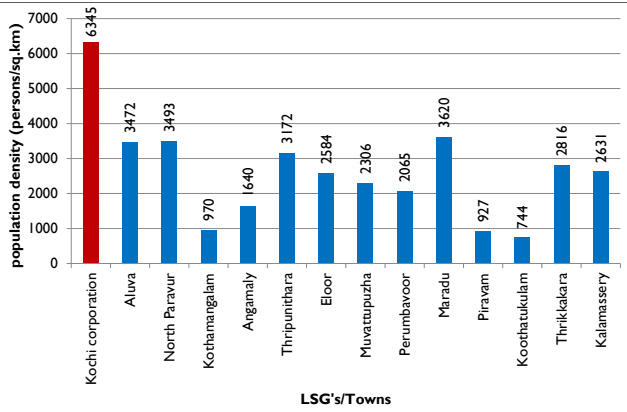
The comparison of population density with other urban local bodies in the District is shown in Table 4:6 and Figure 4:9 . When compared with other Towns, Kochi Corporation has the highest population density. Maradu, North Parvur and Aluva are the next densely populated urban local bodies in the district. Koothatukulam has the least population density of 744 persons per Sq.km.
Kochi Municipal Corporation
DEMOGRAPHY
Figure 4:9 Comparison of population density of Kochi with other urban local bodies in the District Source: Census 2011
Table 46 Comparison of population density of Kochi Corporation with LSGs in the District
District/LSG
Density (Persons per Sq. Km)
Ernakulam District
1072
Kochi corporation
6345
Aluva
3472
North Paravur
3493
Kothamangalam
970
Angamaly
1640
Thripunithara
3172
Eloor
2584
Muvattupuzha
2306
Perumbavoor
2065
Maradu
3620
Piravam
927
Koothatukulam
744
Thrikkakara
2816
Kalamassery
2631
Source: Census 2011
Kochi Municipal Corporation
DEMOGRAPHY
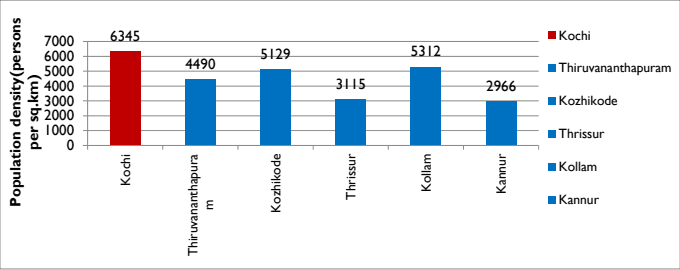
The comparison of population density with other municipal corporations in the state in Figure 4-10 shows that Kochi has the highest gross population density of 6345 among them followed by Kollam and Kozhikode. The density of Thrissur is almost half that of Kochi while Kannur has the least density.
Figure 4:10 Population size comparison Source: Census 2011
Division wise population distribution of Kochi Municipal Corporation is shown in Table below.
Table 47 Division wise population and Area in Kochi Corporation
Division No:
Name
Population
Division Area (sq.km)
1
Fort Kochi
10025
1.23
2
Kalvathy
7825
0.39
3
Earaveli
6455
0.22
4
Karippalam
8917
0.4
5
Mattancherry
10172
0.55
6
Kochangadi
7132
0.25
7
Cheralayi
7721
0.69
8
Panayappilli
11467
0.58
9
Chakkamadam
5066
0.33
10
Karuvelippady
7714
0.41
11
Thoppumpady
9307
1.04
12
Tharebhagam
8829
0.85
13
Kadebhagam
10248
0.54
14
Thazhappu
10753
1.01
15
Edakochi North
9619
1.1
16
Edakochi South
7836
1.99
17
Perumpadappu
9480
0.74
18
Konam
9949
1.26
Kochi Municipal Corporation
DEMOGRAPHY
19
Palluruthy-Kacherippady
11196
0.67
20
Nambyapuram
8782
0.51
21
Pullardesom
11086
0.71
22
Mundamveli
10949
1.15
23
Manassery
8443
0.84
24
Moolamkuzhi
8151
0.71
25
Chullikkal
6644
0.47
26
Nasrath
7310
0.47
27
Fort Kochi Veli
6295
0.67
28
Amaravathy
9487
0.67
29
Island North
3133
5.38
30
Island South
2382
2.27
31
Vaduthala West
7835
1.03
32
Vaduthala East
8996
0.62
33
Elamakkara North
9053
0.91
34
Puthukkalavattom
8592
1.04
35
Ponekkara
9018
1.19
36
Kunnumpuram
8787
1.12
37
Edappalli
7631
2.06
38
Devankulangara
9215
1.62
39
Karukappilli
8647
1.44
40
Mamangalam
7645
0.71
41
Padivattom
5795
1.01
42
Vennala
4420
1
43
Palarivattom
11782
1.54
44
Karanakodam
9756
1.22
45
Thammanam
9394
1.21
46
Chakkarapparambu
8619
1.12
47
Chalikkavattom
9984
1.89
48
Ponnurunni East
6559
0.98
49
Vyttila
4974
1.02
50
Chambakkara
8630
0.83
51
Poonithura
4186
0.86
52
Vytilla Janatha
7553
1.27
53
Ponnurunni West
8073
1.26
54
Elamkulam
8871
1.54
55
Girinagar
10397
1.25
56
Panampilly Nagar
5063
0.91
57
Kadavanthra
6306
0.83
58
Konthuruthy
11313
2.03
59
Thevara
7967
1.04
60
Perumanoor
5548
0.72
61
Ravipuram
9383
1.01
Kochi Municipal Corporation
DEMOGRAPHY
62
Ernakulam South
4378
1.49
63
Gandhi Nagar
5971
1.35
64
Kathrukadavu
8764
1.59
65
Kaloor South
9900
1.34
66
Ernakulam Central
8099
1.29
67
Ernakulam North
8774
0.91
68
Ayyappankavu
4113
1.1
69
Thrikkanarvattom
5998
1.98
70
Kaloor North
9049
1.4
71
Elamakkara South
10215
0.74
72
Pottakkuzhi
10542
0.82
73
Pachalam
5965
0.61
74
Thattazham
7911
1.23
Source: Kochi Municipal Corporation and LSGD (Planning)
Figure 4:11 Division wise distribution of population of Kochi Corporation 2011 Source: Census 2011
Kochi Municipal Corporation
DEMOGRAPHY
Palarivattom division (Dn 43) is having the maximum population of 11782 persons and Island South (Dn 30) is having the minimum population with 2382 persons. More populated divisions are located in the eastern sides of the mainland and Fort Kochi –Mattancherry area. Divisions in the central city area are less populated.
4.4.1 Net population density
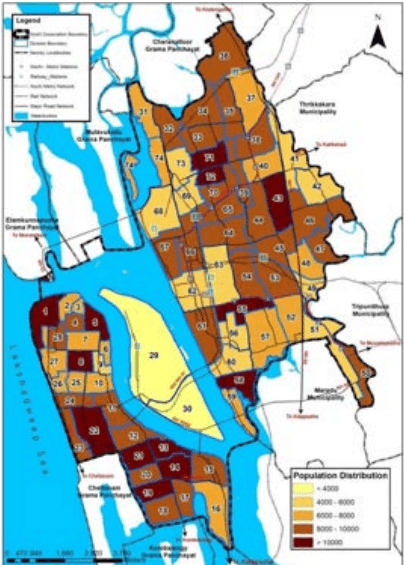
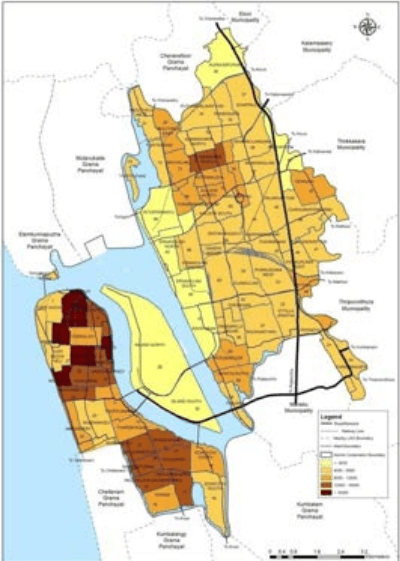
Net population density is highest in Earaveli Dn (3), 35608 pp/sq.km followed by Kochangadi Dn (6) with 27370 pp/sq.km. This is followed by Amaravathy Dn (28), Nasrath Dn (26) and Kalvathy Dn (2) which is almost equal to 20000 pp/sq.km. The division wise net population density of Kochi Municipal Corporation is shownin Figure below.Island North division (30) in Willingdon has the least population density of 581 pp/sq.km.
Figure 4:12 Division wise net population density of Kochi Corporation (2011census) Source: Census 2011
60
Kochi Municipal Corporation
DEMOGRAPHY
Highest population density is seen in the Fort Kochi –Mattancherry area and southern divisions of West Kochi. Northern and southern divisions of the mainland also show relatively high population density while the least in seen in the Island area. Central city area has very low population density compared to the other areas. (Below 4000 pp/sq.km)
4.4.2 Population concentration pattern
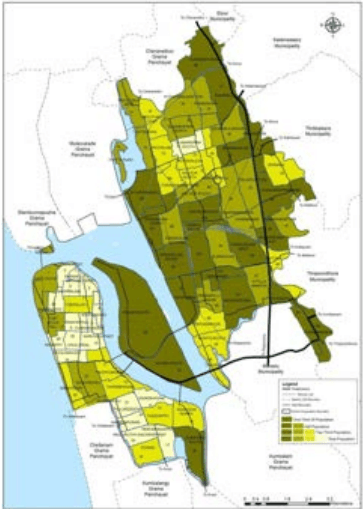
The population concentration pattern within the town, derived by mapping the cumulative population in the order of their gross densities, is presented in Figure below. Comparing with the slope of the terrain, it can be seen that population is concentrated in the low-lying and well-connected areas. While 1 / 3 r d of the total population in the town is concentrated in 43% of the municipal area, half the population is concentrated in less than 65% and 2 / 3 r d of the population is concentrated in less than 77% of the total area.While this reveals the areas where infrastructure and service provisions need more focus, it also suggests the presence of vast tracts of less-developed land in the peri-urban areas of the town.
Figure 4:13 Division wise population Concentration pattern of Kochi Corporation (2011census) Source: Census 2011
Kochi Municipal Corporation
DEMOGRAPHY
4.4.3 Net Residential Population density
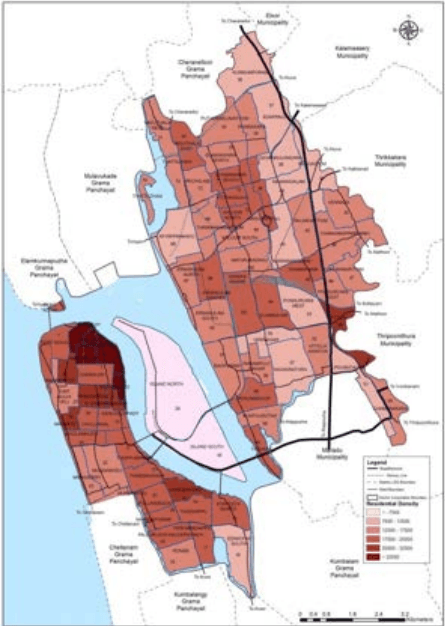
Net residential population density of 20 divisions in the city is more than 20000pp/sq.km. It is highest in Earaveli Dn (3), 59617 pp/Sq.km Kochangadi Dn (6), 54259 pp/sq.km followed by divisions Mattancherry (5), Karipalam (26) and Kalvathy (2) as shown in Figure below. Island North division (30) in Willingdon has the least net residential population density of 5073 pp/sq.km. Highest population density is seen in the Fort Kochi –Mattancherry area and southern divisions of West Kochi. Northern divisions of the mainland also show relatively high population density while the least in seen in the Island. Central city area and Island has very low population density compared to the other areas.
Figure 4:14 Division wise Net Residential Density of Kochi Corporation (2011 census) Source: Generated from Census 2011, Landuse survey 2020
Kochi Municipal Corporation
DEMOGRAPHY
Figure 4:16 Comparison of sex ratio of Kochi Corporation with the state & district Source: Census 2011
When the sex-ratio of Kochi Municipal Corporation is compared with other Municipal Corporations in the state as shown in figure 4-17, it can be seen that Kochi Corporation is having the least sex ratio
Kochi Municipal Corporation
DEMOGRAPHY
Figure 4:17 Comparison of sex ratio of Kochi Corporation with other Municipal Corporations in the state Source: Census 2011
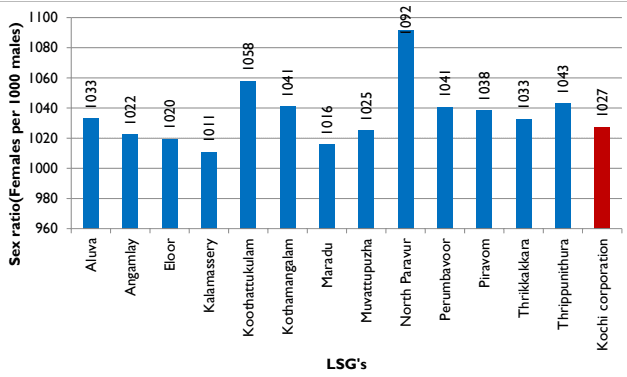
While comparing the sex ratio with other urban local bodies in the district as per Figure below, it is seen that North Paravur has the highest sex ratio of 1092 followed by Koothattukulam 1058. Kalamasserry has the least sex ratio of 1011.
Figure 4:18 Comparison of sex ratio of Kochi Corporation with other urban local bodies in the district Source: Census 2011
Kochi Municipal Corporation
DEMOGRAPHY
Child population
4.6.1 Population in 0-6 Age group
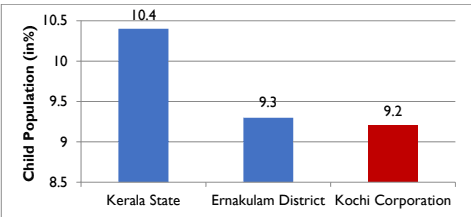
The percentage of child population in 0-6 age- group is indicative of the birth rate prevailed during the last six years and has a positive relationship with the decadal growth rate and hence the study of this is important. The child population in this age-group which stood at 37.93lakhs in Kerala as per 2001 Census has declined to 33.22 lakhs during 2001- 2011. That is, there is a net decline of about 4.71 lakhs at the rate of about 50 thousand per year on an average, in the state. The State has thus registered a decline of-12.41% during 2001-2011 in child population in 0-6 age-group. Corresponding decline in 1991- 2001 was only 0.43 Lakhs, which shows a reduction of more than 10 times, indicating a drastic fall in fertility. In all the districts, except Malappuram district which shows a very negligible growth (0.23%), the child population has reduced in 2001-2011. Ernakulam District registers a decrease of 10.23% in 0-6 age group population, from 338,924 to 304,242, between 2001 and 2011. However, this is very low, compared to the decline in the state, indicating the relatively low proportions of the age group, and thus low fertility, in the district. According to 2011 Census, the child population in 0-6 group in Kochi corporation area is 55,138; out of which male child population and female child population includes 28,185 and 26,953 respectively. Comparison of percentage of child population with the state and district is shown in Figure below. The percentage of Child population in the corporation of 9.2% is much lower than the state figure of 10.4% and slightly lower than the district figure of 9.3 %.
Figure 4:19 Comparison of child population of Kochi Corporation with state and district Source: Census 2011
The comparison in Child population of Kochi Municipal Corporation and other municipal corporations are given in Figure 4-20. It shows that Thiruvananthapuram city has the highest share of child population followed by Kannur and Kozhikode which may indicate higher birth rates in these areas. The lower percentage of child population may be attributed to the
Kochi Municipal Corporation
DEMOGRAPHY
decreasing fertility rate and families opting for a single child in the busy life. This may cause a flattening of the age sex pyramid and larger percentage of older population to be supported by lesser percentage of younger population in the future.
Figure 4:20 Comparison of child population of Kochi Corporation and other corporations in the sate Source: Census 2011
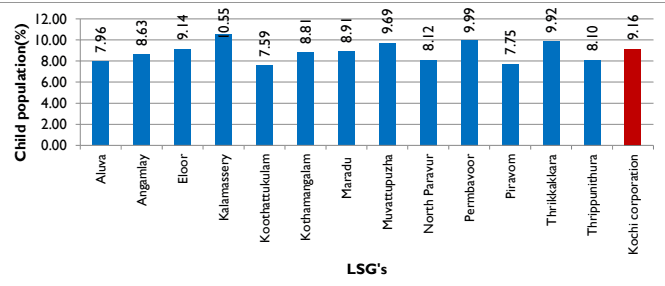
The percentage of child population of Kochi is in similar lines with that of district. The comparison of Child population of Kochi Corporation with other local bodies in Ernakulam district is given in Figure 4-21.
Figure 4:21 Comparison of child population of Kochi Corporation with other urban local bodies in the district. Source: Census 2011
Among the various urban local bodies in the district, Kalamasserry has the highest share of child population of 10.55% followed by Perumbavoor 9.99%. Aluva, Koothattukulam and
Kochi Municipal Corporation
DEMOGRAPHY
Piravom having a negative population growth rate in the last decade also have the least percentage of child population as shown in Figure 4-21.
4.1.1 Sex ratio of 0-6 Age group
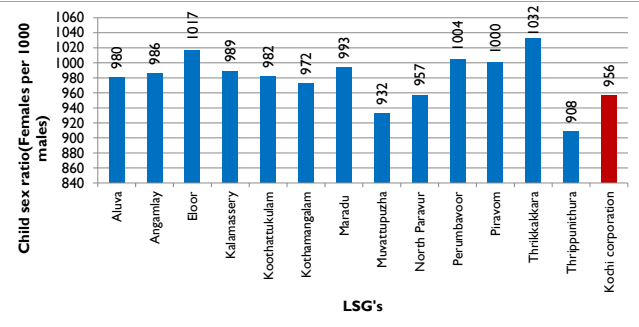
The sex ratio of population of 0-6 years of age has high relevance from social as well as demographic angle. An adverse child sex ratio shows that fewer girls are being born compared to boys and indicates chances of pre-birth sex selection measures and pre and post birth discrimination against the female child. A negative 0-6 sex ratio also exposes the possibility of socio-cultural factors which determines the survival chances of the female children. It’s a nation – wide concern that the States that have recorded the steepest declines are from among the most economically developed ones, and even those states which are high on other social and economic development indicators show a low child sex ratio. When the trends in general sex ratio of the state favour women, the child sex ratio generally presents a reverse scenario. The child sex ratio of the state is negative since 1991, and constantly decreasing. The child sex ratio in the state is 959 as per 2011 Census and has reduced by a point when compared to that in 2001. It’s worth reflection that the state which fare well on social and human development indicators has a low 0-6 sex ratio.The Ernakulam district had a lowerchild sex ratio in 2001, which further increased to 961 in 2011. The corporation area shows a child sex ratio of 956 females per 1000 males in 2011 contradicting the trend of general sex ratio in the area. Among the other urban local bodies in the district Thrikkakkara and Eloor has the highest child sex ratio while Thripunithura has the least as shown in Figure 4-22.
Figure 4:22 Comparison of child sex ratio of Kochi Corporation with other urban local bodies in the district Source: Census 2011
Kochi Municipal Corporation
DEMOGRAPHY
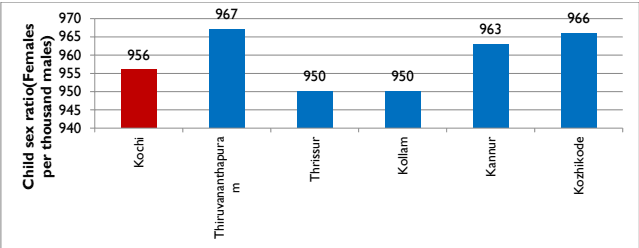
Figure 4-23 shows that child sex ratio of Kochi is lower than that of Thiruvananthapuram, Kozhikode and Kannur and higher than that of Thrissur and Kollam.
Figure 4:23 Comparison of child sex ratio of Kochi Corporation with other municipal corporations Source: Census 2011
Age-Sex Pyramid
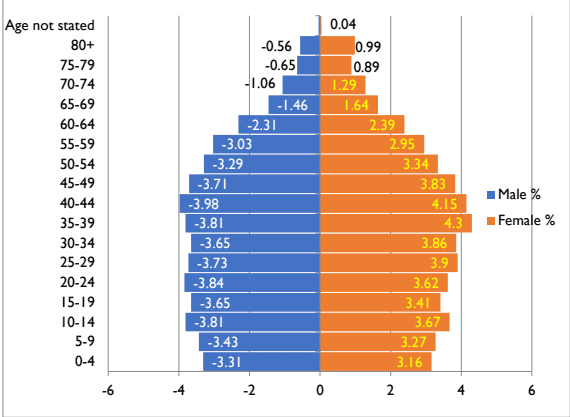
The age-sex pyramid graphically represents the distribution of a population by age and sex. In many ways, an age-sex pyramid is a summation of a population's history, reflecting long-term trends in birth and death rates and even short-term changes resulting from baby booms and busts, wars, and epidemics. The age sex structure of Kochi Corporation is shown in Figure 4-25. It can be seen that the corporation exhibit a slow growth with the age-sex pyramids progressing towards constrictive nature, with low proportions of 0-10 and 50+ age groups and high proportion of youth and middle-aged.
This indicates declining fertility and mortality rates prevailing here, in tune with the general picture of the State. With lower fertility, fewer people have been added to the lowest bars of the pyramid, and as life expectancy has increased, a higher percentage of the population lived until old age. Thus, it is understood that the population has been aging, as the proportion of older persons in the population has been growing. This indicates a greater demand for medical and other geriatric services in these corporations, in the coming decades. However, it can be seen that the proportion of population in 50+ age group are higher in Kochi Corporation, indicating the relatively higher life expectancy rates prevailing in the corporation, when compared to other major urban centres of the state.
Kochi Municipal Corporation
DEMOGRAPHY
Figure 4:24 Age sex pyramid of Kochi Municipal Corporation Source: Socio – Economic Survey, 2019
It can be seen that Kochi Corporation exhibits the lowest dependency ratio of 0.41 along with Thiruvananthapuram Municipal Corporation. This is shown in Table 4-8.The urban inmigration of workers might have resulted in the higher proportion of working age group and hence relatively less dependency ratio. Here the values are taken based on the ratio of non – working population (Age group below 15 and above 65) to the working population (Age group between 15 and 65).
Table 4:8 Age Dependency ratioof Municipal Corporations
70
Municipal Corporation
Age Dependency
1
Kochi
Ratio 0.41
2
Thiruvananthapuram
0.41
3
Kozhikode
0.45
4
Thrissur
0.42
5
Kollam
0.43
6
Kannur
0.46
Source: Census 2011
Kochi Municipal Corporation
DEMOGRAPHY
Figure 4:27 Comparison of literacy rate with other urban local bodies in the district -2011 Source: Source: Census 2011
Kochi Municipal Corporation
DEMOGRAPHY
Male literacy rate is highest for Thripunitura (98.55) followed by Aluva (98.48), Maradu(98.30) and Kochi(98.25). Least male literacy rate is seen in Muvattupuzha (97.20). Female literacy rate is highest in Aluva (97.34) followed by Thripunitura (96.62) and Kochi(96.51).The female literacy rate is low in all other urban local bodies especially in Kalamassery (94.20), Kothamangalam (94.60), Perumbavoor (94.58),Piravom (94.12) and Thrikkakkara (94.52).
The gender gap in literacy indicates any gender based preferential treatments prevalent in the community in providing basic education. Low gender gap indicates a relatively favourable situation of basic education of females in the town. Figure 4-28 shows the gender gap in literacy rate of Kochi Municipal Corporation with other urban local bodies in the district. The comparative analysis shows that among the urban local bodies in the district, the gender gap in literacy rate is least in Aluva (1.14) followed by Kochi and Thripunitura(1.94) in Ernakulamdistrict.Gender gap in literacy rate is highest in Kalamassery (3.37) followed by Piravom (3.29) and Thrikkakara (3.09).
Figure 4:28 Comparison of gender gap in literacy rate with other municipal corporations -2011 Source: Source: Census 2011
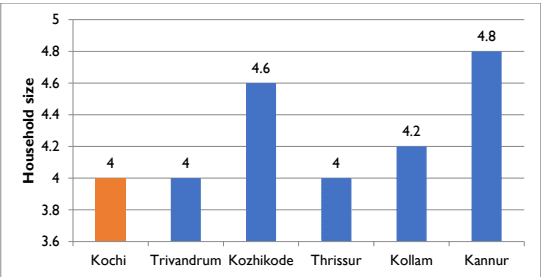
The comparison of Kochi Municipal Corporation with other corporations in the state is given in Figure 4-31. Household size of Kochi Corporation is lesser when compared to the state and other corporations like Kozhikode (4.6),Kannur (4.8)and Kollam (4.2).
Figure 4:31 Comparison of Household size of Kochi Corporation withother corporation in the state Source: Census data
Kochi Municipal Corporation
DEMOGRAPHY
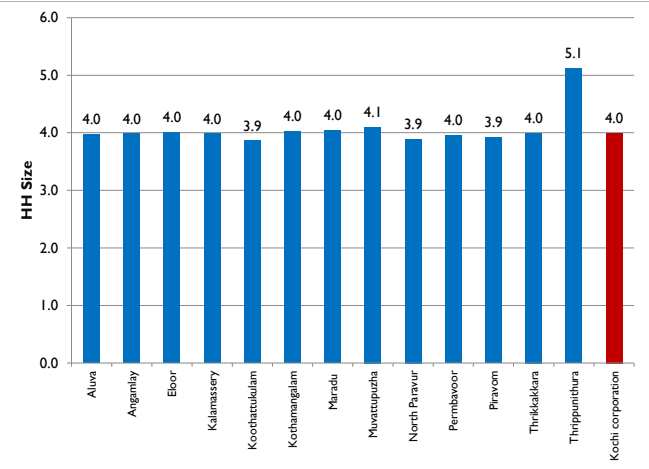
Comparison of household size with other urban local bodies in the district as in Figure 4-32 shows that all local bodies have similar household sizes varying between 3.9 and 4.2 except for Thripunithura showing a very high household size of 5.1.
Figure 4:32 Comparison of Household size of Kochi Corporation with other urban local bodies in the district Source: Census 2011
SC/ST Population
The presence of ethnic groups in a region indicates the cultural diversity and heritage of the region. It also indicates the necessity of special attention required in the region, for the welfare of socially and economically backward ethnic groups.
Kochi Municipal Corporation
DEMOGRAPHY
4.9.1 SC Population
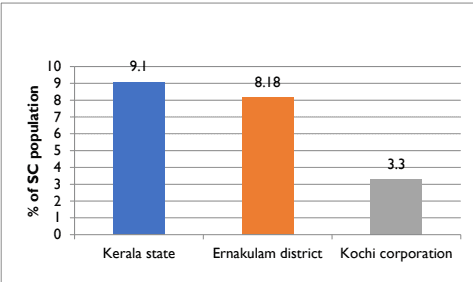
Ernakulam district has a lower share of scheduled caste population, 8.18%, when compared to that of the state, 9.10%. Kochi city has a lower share of SC Population (3.30%) when compared to the district. Figure 4-33 shows the comparison of SC population with the state and the district.
Figure 4:33 Comparison of SC Population of Kochi Corporation with the district and the state Source: Census 2011
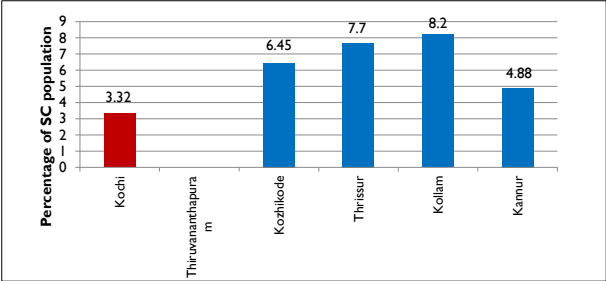
Comparison of SC population with other municipal corporations as in Figure 4-34 shows that Kochi has the least share of SC population among them. Kollam has the highest share of SC population followed by Thrissur.
Figure 4:34 Comparison of SC Population of Kochi Corporation with other municipal corporations -2011 Source: Census 2011
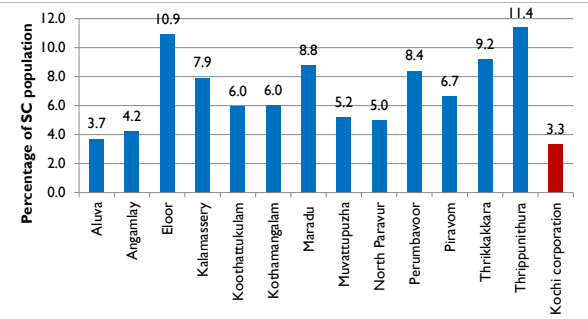
Kochi Municipal Corporation has the least share of SC population among all the urban local bodies in the district. Highest share of SC population is seen in Thripunitura (11.4%) followed by Eloor (10.9%) and Thrikkakkara (9.2%) as in Figure 4-35.
Kochi Municipal Corporation
DEMOGRAPHY
Figure 4:35 Comparison of SC Population of Kochi Corporation with other urban local bodies in the district -2011 Source: Census 2011
4.9.2 ST Population
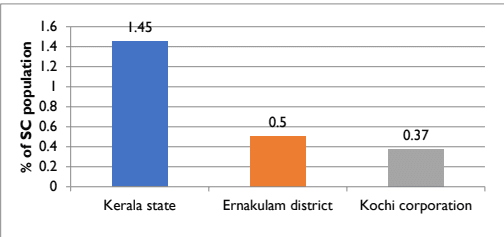
Ernakulam district has a lower share of scheduled tribe’s population, 0.5%, when compared to that of the state, 1.45%. Kochi Corporation has still lower share of ST Population (.37%) when compared to the district. Figure 4-36 shows the comparison of SC population with the state, and the district.
Figure 4:36 Comparison of ST Population of Kochi Corporation with the district and the state Source: Census 2011
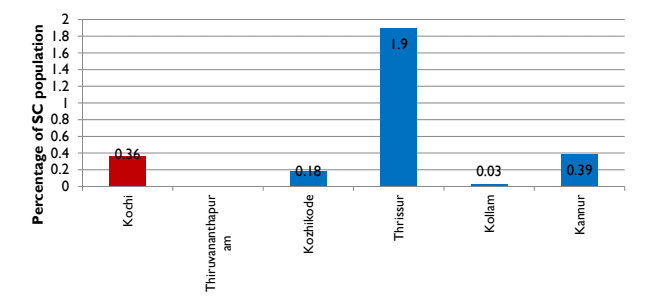
On comparing the percentage share of ST population of Kochi with other municipal corporations as in Figure 4-37, it is seen that the ST population in Kochi Corporation is comparatively low. The SC population of Thrissur is more than 5 times that of Kochi.
Kochi Municipal Corporation
DEMOGRAPHY
Figure 4:37 Comparison of ST Population of Kochi Corporation with other municipal corporations -2011 Source: Census 2011
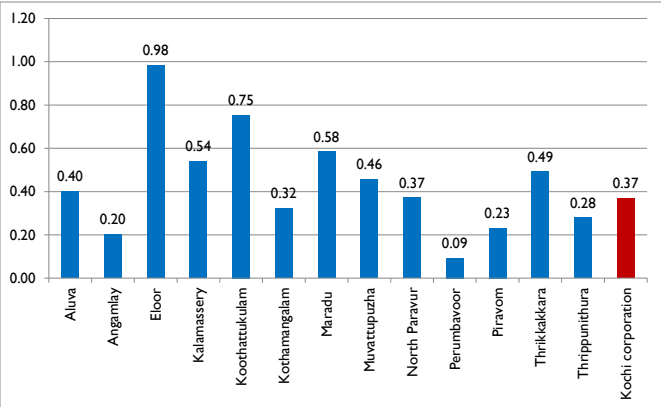
Comparison of ST population with other urban local bodies as in Figure 4-38 shows that local bodies like Eloor and Koothattukulam has more than two times the share of Kochi as high as 0 .98% and 0.75%. Perumbavoor has the lowest ST population.
Figure 4:38 Comparison of ST Population of Kochi Corporation with other urban local bodies in the district -2011 Source: Census 2011
Kochi Municipal Corporation
DEMOGRAPHY
BPL Population
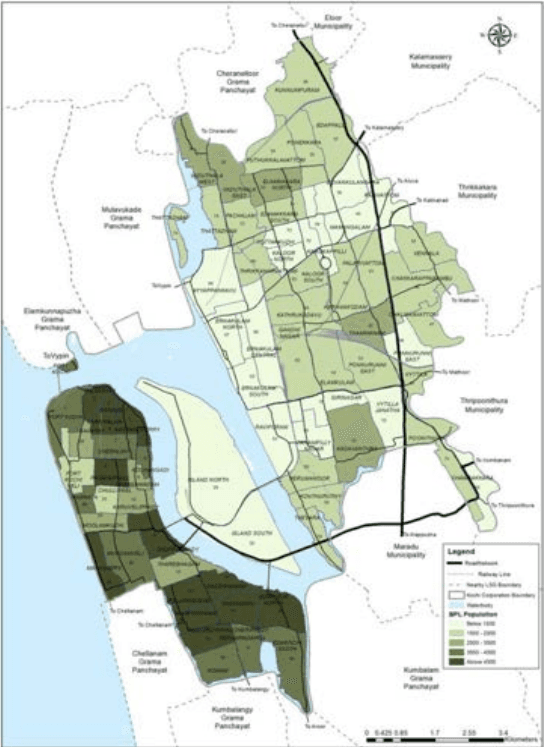
Figure 4-39 shows the division wise BPL population of Kochi Corporation in 2016-2017.All the divisions in West Kochi area have high BPL population when compared to the other divisions in the mainland while the island divisions have least BPL population.
Figure 4:39 Division wise BPL Population of Kochi Corporation Source: Civil supplies department, 2016-2017.
Kochi Municipal Corporation
DEMOGRAPHY
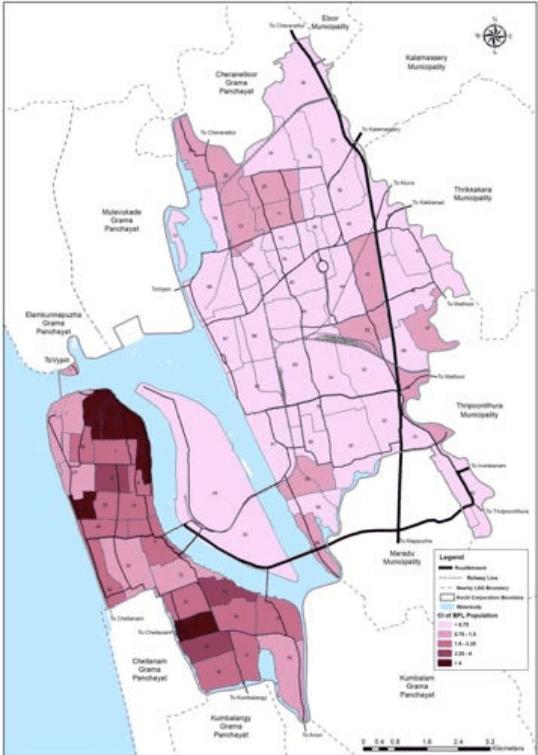
Figure 4-40 gives the division wise concentration index of BPL population in Kochi Municipal Corporation. Highest BPL population concentration is seen in divisions 2,3,4,5,6,26 and 20. Low BPL population concentration is seen in the island divisions and almost all divisions in the mainland.
Figure 4:40 Division wise Concentration index of BPL Population of Kochi Corporation Source: Generated from data from Civil supplies department, 2016-2017.
Kochi Municipal Corporation
DEMOGRAPHY
Community structure
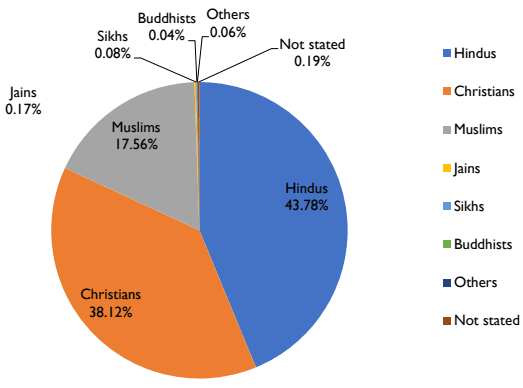
The social profile of Kochi is a microcosm of very intensive mix. Besides the various castes of Hindus, several early sects of Muslims, diverse communities of Christians (since 52 A D), Black and White Jews(since 72 A.D.), Buddhist and Jains , a large assortment of people from other parts of the Indian subcontinent also lived in Kochi in the pre-independence period.The community structure of Kochi as in Figure below shows that more than 43 % are Hindus, 38% are Christians and 17% are Muslims. A very small percentage of Jains, Sikhs and Buddhists also live in the area.
Community structure of Kochi city -2011
Figure 4:41 Community Characteristics of Kochi city -2011 Source: Census 2011
From the analysis of temporal changes and spatial distribution of population, urban content and population growth rate, it can be inferred that the urban extent of the district is increasing due to the population accumulation in smaller towns, than due to the growth in the already established urban local governments. The lower growth rate seen inside the corporation area
Kochi Municipal Corporation
DEMOGRAPHY
can be attributed to the increasing land prices and urbanisation in the suburbs attracting people to settle in neighbouring local bodies outside the corporation area. Net residential population density of 20 divisions mainly in West Kochi area have density more than 20000 pp/sq.km which is a major area of concern for planning of these areas. Analysis of the trends in demographic parameters like proportion of 0-6 age group and age-sex pyramid indicates an aging population in the Corporation, pointing towards a lesser working population and a greater demand for medical and other geriatric services in near future. When the trends in general sex ratio of the state favour women, the child sex ratio generally presents a reverse scenario. The declining trend in average household size indicates the change from joint family system to nuclear family system. Increasing literacy rates, decreasing gender gap in literacy in general, represents a society on the path of achieving high social development.