Issues they faced are lacks of infrastructural facilities such as safe drinking water, Hygienic latrines, Street Lights etc.
Geriatric Care
The elderly population (60+) in India is a fast-growing phenomenon. In 2002, of the total 1018 old age homes in India registered with the Help Age India, 186 are from Kerala. The old age population in 1961 was 25.6 million while after 30 years i.e., in 1991 it was more than double which comes to 56.7 million. In percentage terms it was 5.83% in 1961, 8.82% in 1991 and 9.79% in 2001 which is much higher than in other states. It is also to be noted that majority of old age people in Kerala are widows. In 1991, among the old age people in the range of 60-69, 53.8% are widows and among those above 70 years it comes to 69.20 percentage. Age group distribution of Kerala is shown in the graph below:
Kochi Municipal Corporation
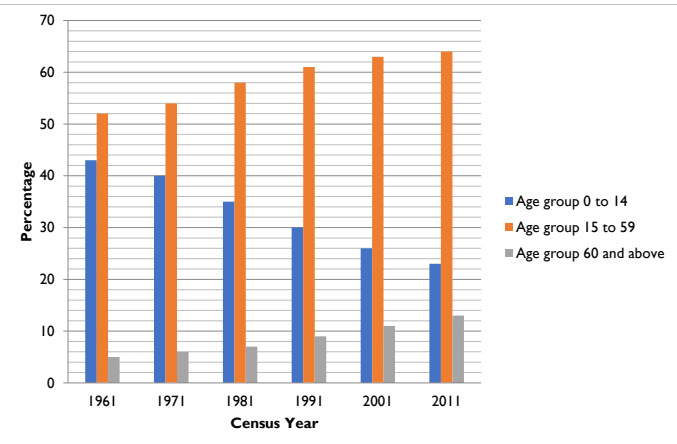
Figure 20:5 Age Group Distribution (%) Kerala 1961-2011 Source:Census 1961-2011
| Age Composition | Total | Men | Women |
|---|---|---|---|
| Total Population | 33,406,061 | 16,027,412 | 17,378,649 |
| Total Old Age Population | 4,193,393 | 1,853,595 | 2,309,798 |
| 60-69 | 2,416,805 (58%) | 1,114,368 (60%) | 1,272,437 (55%) |
| 70-79 | 1,234,739 (29%) | 534,879 (29%) | 699,860 (30%) |
| 80+ | 541,849 (13%) | 204,348 (11%) | 337,501 (15%) |
Source: Census 2011
From 1991-2011 the population in the age group between 15-59 has increased from 61- 64%. Presently this age group would have added to the percentage of elderly population. Going by the trend in the above chart, the percentage of elderly population (age group above 60) would be around 16-20 by the year 2021 and the demand on the social security system would be enormous. Figure 20-7 shows the age-sex pyramid of Kerala in the year 2036.
Kochi Municipal Corporation
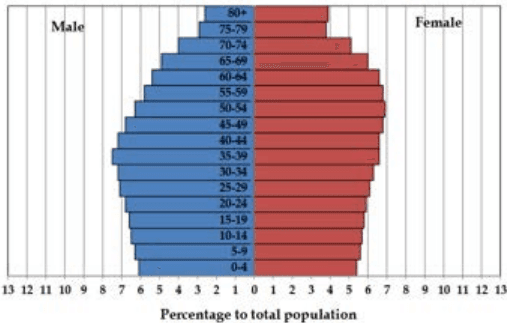
Figure 20:6 Age Sex Pyramid, Kerala 2036
Source: Census of India 2011 – Population projection of India & States
From the graph it is clear that the aged population is going to occupy a significant percentage of population in future. In the coming years this percentage is only going to increase and hence it is the right time to act upon providing the necessary measures for their inclusion in every facet. The analysis of age-sex structure reveals ageing population in the Corporation area, which is indeed similar to the trend through which the state is going. Figure below shows the age – sex pyramid of Kochi Municipal Corporation.
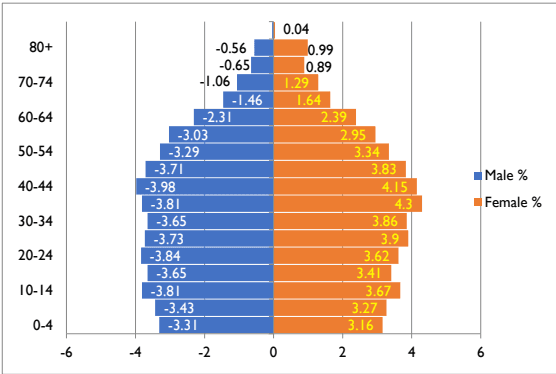
Figure 20:7 Age-sex pyramid of Kochi Municipal Corporation Source: Socio – Economic Survey, 2019
Kochi Municipal Corporation
The age – sex pyramid calls for an elderly-friendly infrastructure in the city. The social and infrastructural needs of the elderly are barely addressed at present. The various statistics on aged population of Kochi, computed by interpolation with the secondary data on district are discussed below:
20.3.1 Demography of Elderly population
The district - wise average number of elderly persons per household is shown below.
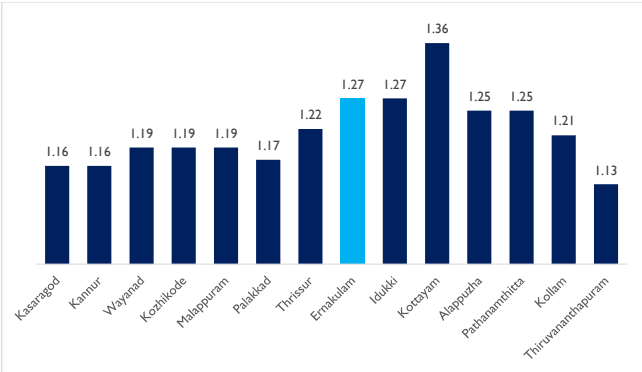
Figure 20:8 Average number of elderly persons per household Source: Socio economic survey,2019
Analysis shows that only Kottayam with 1.36 has a higher number of average elderly persons per household than Ernakulam’s 1.27 per household. Elderly population in Kochi City in the year 2011 by taking 1.27 as average number of elderly persons per households is 192293 persons.
20.3.2 Elderly population among backward classes
Average number of elderly populations in every house holds among backward classes is around 1.22 which is almost same as the average of the city. Elderly people among backward classes have to deal with lack of social inclusion to go along with their old age problems.
Kochi Municipal Corporation
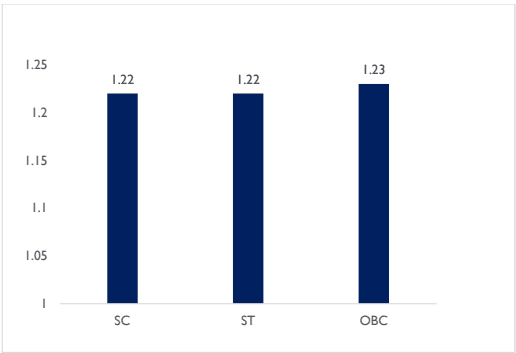
Figure 20:9 Average no. of elderly Persons among Backward HH Source: Census 2011