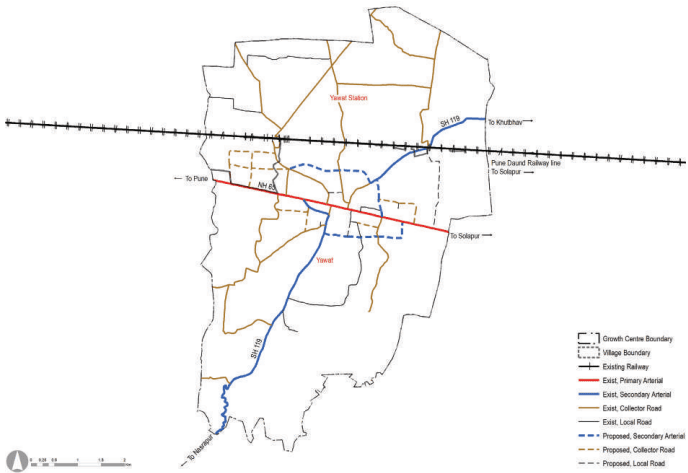
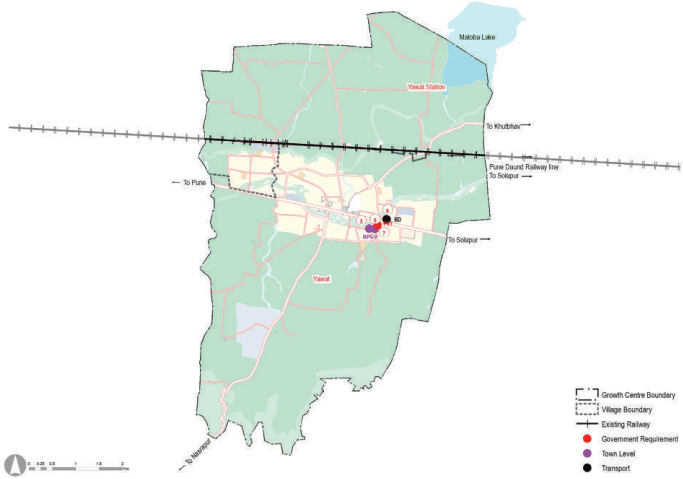
Yawat is located between Pune-Solapur Highway and the Pune-Daund Railway route. This provides a perfect setting for developing it into a “Commuter Town”, leveraging its potential for a railhead town. The strategy is to capture the residential development potential along the railway corridor.
Promoting commercial development along the railway station to maximise the economic potential of railway land.
Develop a bypass to connect SH-119 with NH-65 for a smoother transition compared to the existing staggered system of state highways
Increase residential zone with amenities at Yawat to promote the work-live concept
Promote consolidated industrial clusters along the Pune- Solapur Highway.
Establish green-blue links by connecting forest and streams
A cluster of trauma care centre, police station and helipad
Bus Depot/ terminal
Multipurpose ground at Palakhi Sthal
36.2Existing Situation Analysis
Yawat Growth Centre consists of two villages - Yawat and Yawat Station - both falling under Daund Taluka. The total area of Yawat GC is 41.48 sq km. According to Census 2011, Yawat Growth Centre population was 18,038 in 2011, and the estimated population for 2018 is 24,060 with 11,417 employment.
Kedgaon Growth Centre’s key strength is it being a rail-head town along the Pune-Daund rail route, and it has good regional connectivity via NH-65 and SH-119.
Yawat GC is situated on the eastern side of PMR, 35 km from Pune city. Yawat is surrounded by Daund Taluka and Kedgaon GC on the east, Shirur Taluka on the north, Haveli Taluka and Uruli Kanchan on the west.
Three major roads passing through the GC are Pune-Solapur Highway (NH-65), State Highway (SH-119), MDR-119 (to Rahu) and ODR-162,
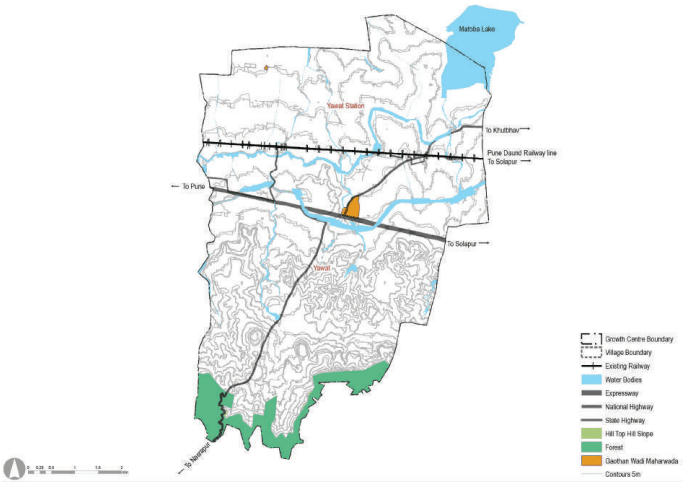
Yawat has plain topography with a minimal area under the hilltop hillslope on the southern part of Yawat village. No village in Kedgaon falls under the category of the Western Ghats. Most of the settlements in Yawat are situated along the railway line and highways with linear development.
Figure 36.1: Location and Physiography
Regional Plan 1997 Analysis
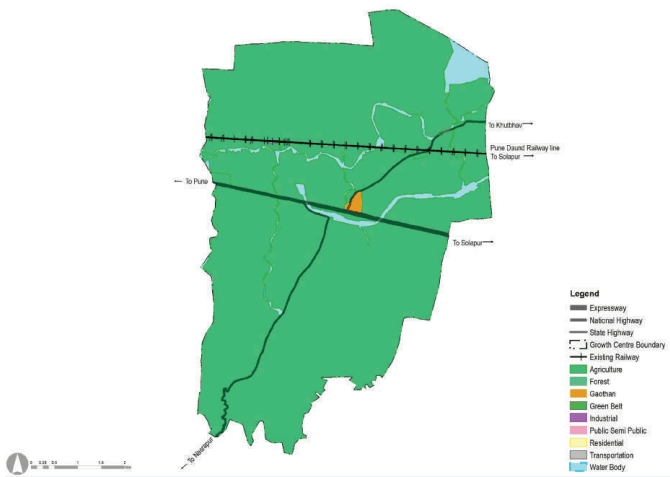
This Growth Centre was not part of any urban sector of RP 1997. The entire area was proposed for agricultural activities.
Table 36.1Regional Plan 1997 Zone Area Statement
Land use category
Area (ha)
Proportion of Total Developed Area (%)
Proportion of Total Area (%)
Residential
12.12
49.2
0.3
Commercial
0
0.0
0.0
Industrial
0
0.0
0.0
Public and semi public
0
0.0
0.0
Garden, Playground and Recreation
0
0.0
0.0
Public Utility
0
0.0
0.0
Transportation
12.51
50.8
0.3
Chapter 36: Growth Centre: Yawat
Defense
0.0
0.0
Total Developed Area
24.63
0.6
Agriculture
3932.72
94.8
Water bodies
191.58
4.6
Green Belt
0.0
Hill_Top_Hill_Slope
0.0
Forest
0.0
Total Undeveloped Area
4124.3
99.4
Total Area
4148.93
100.0
Existing Land Use
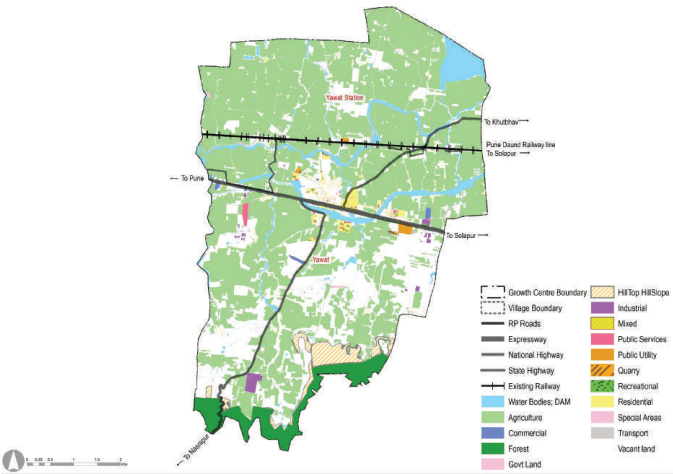
The most dominant land use in Yawat Growth Centre is Agriculture, which covers 2507.15 hectares (60.43%). There is minimal residential development (52.97 ha) currently in this Growth Centre. It accounts for 1.3% of the current land use in the GC, mostly stretching along the national highway. It has a low population density with no ITP or TPS projects.
Figure 36.2: RP 1997 Zoning Map
Figure 36.3: Existing Land Use Map
Table 36.2Existing Land Use Area Statement
Land use category
Area (ha)
Proportion of Total Devel-oped Area (%)
Proportion of Total Area (%)
Residential
52.97
37.14
1.28
Commercial
3.28
2.30
0.08
Industrial
27.79
19.49
0.67
Public and semi public
21.57
15.13
0.52
Garden, Playground and Recreation
3.1
2.17
0.07
Special Areas
1.22
0.86
0.03
Public Utility
7.19
5.04
0.17
Transportation
25.49
17.87
0.61
Total Developed Area
142.61
100.00
3.44
Agriculture
2507.15
60.43
Water bodies
220.96
5.33
Vacant Land*
799.51
19.27
Hill top Hill Slope
294.34
7.09
QUARRY
0
0.00
Forest
184.36
4.44
Total Undeveloped Area
4006.32
96.56
Total Area
4148.93
100.00
Chapter 36: Growth Centre: Yawat
Staggering of state highway SH-119 at NH-65
Traffic congestions along the NH-65 adjoining Yawat gaothan
Scattered development within gaothan expansion
Absence of sewerage, stormwater drainage and solid waste management sites
36.3Proposed Role and Strategies
Yawat is envisioned to be developed into a ‘Commuter Hub’, and the key reasons for this are as follows:
Strong regional connectivity realised through its location between Pune-Solapur Highway and Pune-Daund Railway Route
Leverage upon its potential of a railhead town
Potential for residential development along the railway corridor, improving the railway ridership and cross-subsidise railway station development
Development of amenities, serving not only the GC but surrounding rural area, arresting the urban-rural migration.
Protection of irrigation command area through compact development
Promote self-sufficient town by proposing required amenities and utilities for the projected population
Understanding the above, a new town is proposed at Yawat with a balanced distribution of amenities and infrastructure. A good quality living with accessibility to social infrastructure will enable its transformation into a ‘Commuter Town.’
Socio Economic Projections
Based on the URGD method, the projected population for the Growth Center is presented in Table 36.3.
Table 36.3Population Projections
Villages
2011
2018
2031
2041
Yawat
13,983
19632
24,586
27,115
Yawat Station
4,055
4427
5,040
5,496
Total
18,038
24060
29,626
32,611
The projected resident workforce based on the projected population through the URGD method is 52,032. Considering the proposed economic activities of all the growth centres, employment distribution was proposed based on the envisaged sectoral split for that Growth Centres. Accordingly, the employment to be generated for the Growth Centre for the year 2041 is estimated to be 38957. The proposed residential density is about 125 PPH (12,500 persons/sq km).
Yawat Growth Center is proposed with only one sector as the projected population for the year 2041 is only 32,611.
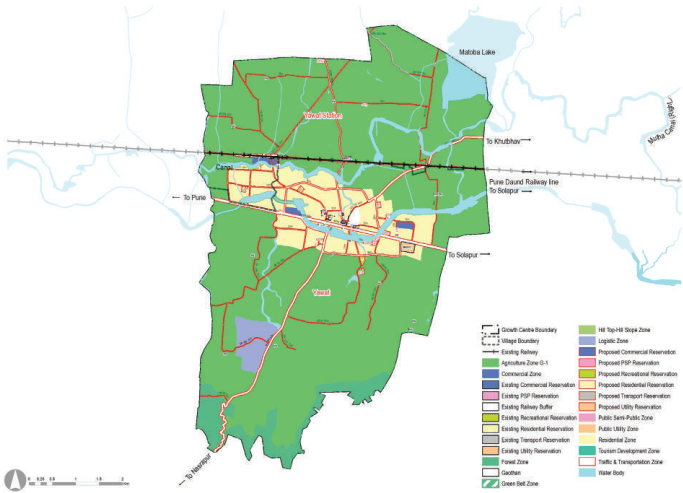
The proposed zoning would guide and determine the optimal and efficient land use for the next 20 years. The proposed zoning plan is an output of existing land use and physical conditions analysis, understanding of most pressing issues of the Growth Center, local knowledge of the place and deployment of five planning goals and allied physical planning strategies. The proposed zoning area statement is presented in Table 36.4.
Figure 36.4: Proposed Zoning Map
Table 36.4Proposed Zoning Area Statement
Land use category
Area (ha)
Proportion of Total De-veloped Area (%)
Proportion of Total Area (%)
Residential
396.69
57.20
9.56
Gaothan
9.76
1.41
0.24
Commercial
17.08
2.46
0.41
Industrial
0
0
0
Logistics
67.37
9.71
1.62
Tourism Development
0
0
0
Public and semi public
4.97
0.72
0.12
Public Utility
10.91
1.57
0.26
Traffic & Transportation
186.78
26.93
4.50
Defense
0
0.0
0
MIDC
0
0
0
Total Developed Area
763.56
100
Agriculture (G1)
3020.08
72.49
Water bodies
141.42
3.41
Green Belt
83.03
2
Chapter 36: Growth Centre: Yawat
Forest
202.83
4.89
Hilltop Hillslope
0
0
Regional Park
0
0
Recreational
8
0.19
Quarry
0
0
Afforestation
0
0
Total Non-Developable Area
3455.39
83.28
Total
4148.94
100
Proposed zoning ensures that the sectoral development goals are clearly conveyed through it. Proposed sectoral goals and their corresponding physical planning strategies are mentioned in Table 36.5.
Table 36.5Goals and Physical Planning Strategies
Goals
Development Sector Addressed
Physical Planning Strategies
Prudent
Employment and housing
Work- Live Hubs
Convenient
Roads and mass transport
Movement Lattice
Resilient
Environment protection
Green- Blue connectors
Efficient
Infrastructure and utilities
Decentralized resource management
Self- sufficient
Social facilities
Walkable Neighbourhoods
For Yawat Growth Center, the Work-Live concept is applied by:
Designating residential zones within 500 m along the NH-65 to minimize work-related trips for at least 30% of the resident workforce
Commercial zone is proposed at Yawat Station, at a central location within the Growth Centre.
No new industrial zone is proposed considering it being a ‘Commuter town’. However, existing industrial development along the NH-65 is acknowledged.
Land requirement for residential use is estimated based on a net residential density of 150 PPH. Considering 45% top-up (15% amenity, 10% open spaces and 20% roads), the gross area required for the projected population of 32,611 in Yawat Growth Centre is estimated to be 3.2 sq km.
Considering existing mature settlements at Yawat, this residential node is expanded to accommodate the future population. With the above mentioned projected higher density, around 390.11 ha is proposed around Yawat.
Two commercial nodes are proposed at Yawat Station and adjoining Gaothan area along the highway. Land requirement for the commercial zone is estimated based on URDPFI guidelines, i.e. 0.4 ha per 1,000 population and topping up 30% (15% road, 10% open space, 5% amenity). The total commercial zone works out to be 3.28 Ha, while the proposed 17.15 ha commercial zone area aligns with the guidelines.
The movement lattice concept also includes a mass transit corridor running through the Growth Center, highspeed rail crossing the Centre and Ring Road to encourage >50% of the residents to use mass transport for their daily commute.
A parallel system (24 m road) to NH-65 is proposed on its northern side, bypassing the Yawat Gaothan, providing better connectivity with SH-119 and NH_65.
A radial grid of collector roads (15-24 m wide) is proposed at Yawat.
Collector roads (15-24 m wide) follow spacing of 300-500 m, while Secondary arterial (30-45 m wide) follow a grid of 1 to 2 km.
Secondary arterials have the flexibility to run a dedicated bus service for faster transport and support the feeder system and last-mile connectivity.
All existing roads to be redeveloped and proposed roads are to be designated with at least 3m wide footpath on either side of the road, as the ‘pedestrian right of way’ and ‘hawker-free zone.’
Figure 36.5: Proposed Transport Network Map
Chapter 36: Growth Centre: Yawat
Table 36.6Proposed Transport Network Statement
Road Category
Road names/ ROWs
Proposed ROWs
Authority
Total Length (km)
Cost of Road Development
Primary
NH65
60
NHAI
5.15
Secondary
SH119
45
PWD
10.44
Tertiary
MDR119
24
PWD
1.62
ODR162
18
ZP
5.12
Local
VR (Total)
15
ZP
5.01
DP Roads
Primary
MSRDC Ring Road
110
MSRDC
0
0
Expressway
90
MSRTC
0
0
PMRDA Ring Road
65
PMRDA
0
0
Secondary
45
PMRDA
0
0
30
PMRDA
4.74
80.3707882
Tertiary
24
PMRDA
0
0
18
PMRDA
6.98
54.4277829
15
PMRDA
2.62
16.4687942
Local
12
PMRDA
5.37
34.1103806
Total Road Length
Existing forest area at 184.36 Ha is designated as a protected area.
All existing streams to be protected
These protected Green-Blue features are recommended to be connected by a 30-45m wide secondary arterial road that would be upgraded as a tree-lined avenue by developing NMT corridors (>3 m each) on both sides of the road and segregated from footpaths.
Green lungs are proposed within 500 m walkable distance covering an area of 91.63 ha. These green lungs include active and passive recreational spaces. The total active recreational space works out to be 5.4 ha that include playgrounds, sport complex, stadium and multi-purpose ground. And the total passive recreational space works out to be 86.15 ha that include gardens, town park/ regional park, bio diversity park and green belt.
This concept is applied as follow:
2 Sewerage Treatment Plants are proposed at Yawat and Yawat Station
Renewable energy sites could be proposed and are recommended in areas with high elevation. However, they would be finalised after a detailed study.
Fire brigade station is proposed at Yawat villages
Currently, 2 cremation grounds are present in the Growth Centre. Thus no new additions are proposed.
Table 37.7Proposed Infrastructure Demand
Infrastructure Sys-tem
Demand (2041)
Unit
Utility Sites
Total Area
Water Supply
2.36
MLD
0 WTP
0
Sewerage
2.93
MLD
2 STPs
1.37
Solid Waste
9.78
Tones/Day
0 SWM
0
Electric Substation
This goal is set to increase the liability index of the Growth Centre. To do that, amenities are proposed within 500 m distance, leveraging the concept of Walkable Neighbourhoods. The concept entails providing basic infrastructure and services for education, health, sports, and recreation within the neighbourhood to have easy access to them by foot.
Amenity provision is made for the projected population by 2031 (29,626 people)
Neighbourhood level amenities are located within a 500 m radius from residential zones and are connected by collector/local roads to improve their accessibility from other neighbourhoods.
The projected population for Yawat Growth Centre is 29,626 for the year 2031. Thus, there is not enough catchment for the development of town level amenities. Proposed amenities are distributed as follow:
Education: The existing number of schools in the Growth Centre is more than sufficient to serve the projected population. Thus, no new schools are proposed. Wherever possible, expansion to the existing ZP schools is proposed with proper road access to each amenity.
Health: One health centre is provided considering walking radius within a Neighbourhood at Yawat. A hospital/ trauma care centre adjacent to the proposed helipad and police station is proposed along the NH-65
• Socio-Cultural: 1 community hall is provided at Yawat village considering walking distance within a neighbourhood.
Open Space: 5 playgrounds are located at Yawat within walking radius. Two neighbourhood gardens are
Chapter 36: Growth Centre: Yawat
proposed, one at Yawat and another at Yawat Station. A multipurpose ground is proposed at Yawat adjacent to the highway aligning canal.
• Commercial: Existing market is located near Yawat Gaothan along NH-65
• Transport: A bus terminal/depot is proposed along the NH-65.
• Logistic Zone Proposed in Yawat Growt
Table 36.8Summary of Land Ownership of Proposed Amenities
Land Ownership
No of Amenity
Total Area (ha)
Government Land
5
5.06
Private Land
9
6.29
Amenity Space
2
0.30
Other
2
1.77
Total
18
13.42
Figure 36.6: Strategic Projects
36.4Proposed Reservation Statement, Costing and Phasing
Table 36.10Proposed Reservation Statement
No
Purpose of Reservation
Planning Standard
Total Re-quirement
Existing/Avail-able
Proposed Reservations
Total Reser-vations
Area (Ha.)
Min unit re-quired
No of sites
Area in Ha
No of sites
Area in Ha
No of sites
Area in Ha
No of sites
Area in Ha
1
Primary School (I-V)*
0.4
1/5000 ppl, 1/500 stu-dents,
6
2.4
0
0
0
0
0
0
2
Secondary School (VI-XII)*
1
1/7500 ppl, 1/1000 students
4
4
0
0
0
0
0
0
3
Health Centre
0.08-0.12
1/15000 ppl
2
0.24
0
0
1
0.1
1
0.09
4
Community Hall
0.2
1/15000 ppl
2
0.4
0
0
1
0.2
1
0.2
5
Garden
1
1/15000 ppl
2
2
0
0
2
3.1
2
3.1
6
Play ground
1.5
1/15000 ppl
2
2.96
0
0
5
4.71
5
4.71
7
Shopping Centre/Market
0.3-0.45
1/15000 ppl
2
0.89
1
0.3
0
0
0
0
8
Parking
as per req.
0
0
0
0
9
Bus Depot
As per Government Authority requirement
1
1.27
1
1.27
Town Level
1
College
5
1/1.25 lac ppl,
0
0
0
0
0
0
0
0
2
Hospital
1
1/1 Lac
0
0
1
0.67
1
1.04
1
1.04
3
Residential
0
0
0
0
0
0
0
0
4
Socio-Cultural Centre
0.6-1
1/1 Lac
0
0
0
0
0
0
0
0
5
Town Park
3-5
1/1 Lac
0
0
0
0
0
0
0
0
6
Sports Complex
3-5
1/1 Lac
0
0
0
0
0
0
0
0
7
Burial Ground
4
1/5 lac
0
0
0
0
0
0
0
0
8
Cremation Ground
2.5
1/5 lac
0
0
0
0
0
0
0
0
9
Fire Brigade Station
0.4
As per requirement of Fire depart-ment of PMRDA. 1 Fire station / growth centre
0
0
0
0
1
0.37
1
0.37
10
Multipurpose Ground
As per land availability
0
0
1
0.72
1
0.72
11
Solid Waste Management Site
-
-
0
0
0
0
1
0.95
1
0.95
Chapter 36: Growth Centre: Yawat
12
Sewerage Treatment Plant
-
-
2
2
1.37
2
1.37
13
Water Works (Water Treatment Plant, Tanks and Pipes)
Land area requirement is as per URDPFI i.e.1) 5MLD-0.10 Ha 2) 10MLD-0.19Ha 3) 50MLD-0.93 Ha 4) 100MLD-1.87Ha 5) 200MLD-3.73Ha
Water requirement of PMR is 72 lpcd as per Report 'Integrated Master Plan Of Water Supply, Sewerage, Storm Water and Solid Waste Management in the PMR'. It is distributed to each Growth center.
0
0
0
1
0.7
1
0.7
14
Effluent Treatment Plant
15
Police Station
As per Government Authority requirement
1
0.49
1
0.49
18
Regional level
1
Town Centre
2
Regional Centre
14 Ha. (As per concept plan)
Table 36.11Cost and Acquisition Statement for Proposed Reservations
Reser-va-tion_No
Purpose of Reservation
Taluka
Village Name
S. No/ Gut No./ CTS No./F.P. No
Area (ha)
Area Sq.m.
Land Owner-ship (Govt/GP/ PMRDA/Private)
Total Cost of Ac-qui-sition (IN Cr.)
Total Cost of Devel-opment (Const.) (INR Cr)
Total Cost (INR Cr.)
Appro-priate Author-ity
1
Sewage Treatment Plant
Daund
Yawat Station
188
0.30
Government
0.06
5.61
5.67
PMRDA
2
Garden
Daund
Yawat Station
450P,445P
1.40
Private
0.27
4.07
4.34
PMRDA
3
Play ground
Daund
Yawat
QUARRY, 839
1.25
Government (1.12) + Private (0.3)
0.24
2.53
2.77
PMRDA
4
Play ground
Daund
Yawat
484
1.25
Private
0.24
2.53
2.77
PMRDA
5
Fire Brigade Station
Daund
Yawat
828P
0.38
Private
0.07
7.12
7.19
PMRDA
6
Play ground
Daund
Yawat
923P, 917P, 916P
0.55
Government (0.19) + Private (0.3)
0.00
1.12
1.12
PMRDA
7
Community Hall
Daund
Yawat
178P
0.21
AS
0.04
5.49
5.53
PMRDA
8
Bus Depot
Daund
Yawat
227P,226P
1.28
Trust (NHAI) 1.18 + P(0.34)
2.16
24.06
26.21
PMRDA
9
Police Station
Daund
Yawat
242,227P
0.50
Trust
0.84
9.39
10.23
PMRDA
10
Hospital
Daund
Yawat
Table 36.12Phase-wise Programme
Purpose of Reservation
Phase I (Reservation No)
Phase II (Reservation No)
Phase III (Reservation No)
Phase IV (Reservation No)
Neighbourhood level
1
Primary School (I-V)*
2
Secondary School (VI-XII)*
3
Health Centre
12
4
Community Hall
7
5
Garden
14
2
6
Playground
3,4,18
6,13
7
Shopping Centre/ Market
Town Level
1
College
2
Hospital
10
3
Residential
4
Socio-Cultural Centre
Chapter 36: Growth Centre: Yawat
5
Town Park
6
Sports Complex
7
Burial Ground
8
Cremation Ground
9
Fire Brigade Station
5
10
Solid Waste Management Site
16
11
Sewerage Treatment Plant
1,15
12
Water Works (Water Treatment Plant, Tanks and Pipes)
17
13
Effluent Treatment Plant
14
Police Station
9
15
Bus Depot
8
16
Multipurpose Ground
11
Regional level
1
Regional Centre
2
Regional Park
Total Cost of development of Reservations of UGC : Yawat
Total Acquisition cost of Reserva-tions ( in Rs.CR.)
Total Con-struction cost of Res-ervations ( in Rs.CR.)
Total Cost of development of Reservations( in Rs.CR.)
Road con-struc-tion cost
Total De-velopment Cost
Reservation on Amenity Space/TP scheme/Government (A)
0.00
22.10
22.10
169.27
622.96
Reservations on Private land
5.51
857.67
863.18
50% of the total cost of reservations on private land with an assumption that 50% of reservations will be developed through TDR/AR & In-situ FSI (B)