-
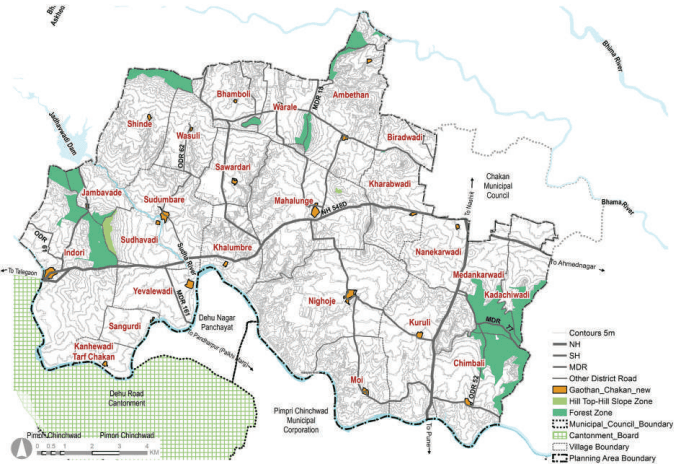
Figure 20.1: Location and Physiography 3 Figure 27.1: Location and Physiography 186
-
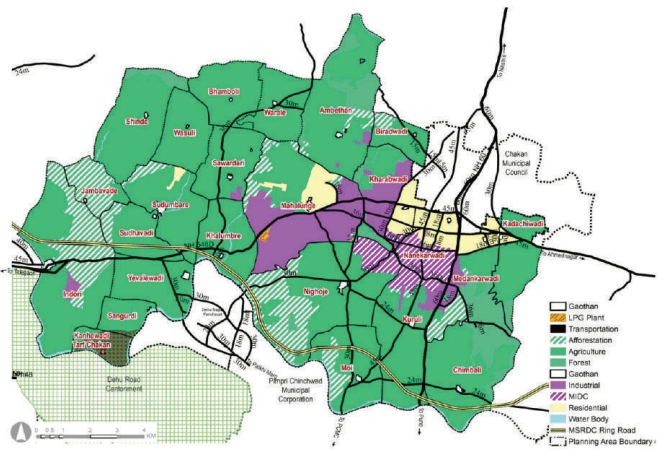
Figure 20.2: RP 1997 Zoning Map 4 Figure 27.2: RP 1997 Zoning Map 187
-
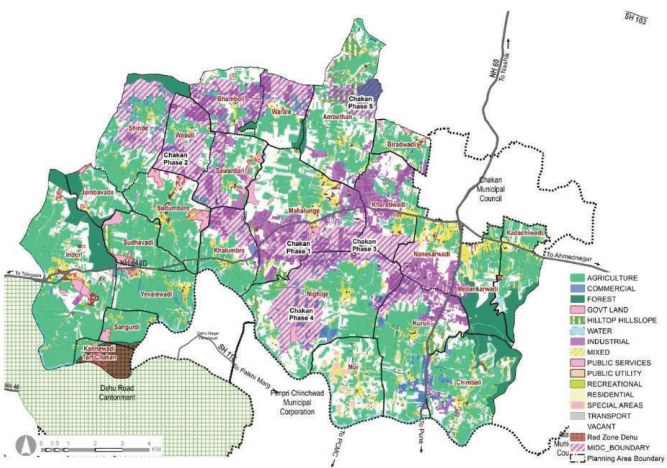
Figure 20.3: Existing Land Use Map 5 Figure 27.3: Existing Land Use Map 188
-
Figure 20.4: Proposed Zoning Map 8 Figure 27.4: Proposed Zoning Map 192
-
Figure 20.5: Proposed Transport Network Map 11 Figure 27.5: Proposed Transport Network Map 196
-
Figure 20.6: Strategic Projects 15 Figure 27.6: Strategic Projects 199
-
Table 20.12: Phase-wise Programme 27 Figure 28.1: Location and Physiography 216
-
Figure 21.1: Natural Feature and Physiography 33 Figure 28.2: RP 1997 Zoning Map 217
-
Figure 21.2: RP 1997 Zoning map 34 Figure 28.3: Existing Land Use Map 218
-
Figure 21.3: Existing land use map 35 Figure 28.4: Proposed Zoning Map 221
-
Figure 21.4: Proposed Zoning map 38 Figure 28.5: Proposed Transport Network Map 224
-
Figure 21.5: Proposed transport network map 41 Figure 28.6: Strategic Projects 228
-
Figure 21.6: Strategic Projects 44 Figure 29.1: Location & physiographic 240
-
Figure 22.1: Location and Physiography 57 Figure 29.2: RP 1997 Zoning Map 241
-
Figure 22.2: RP 1997 Zoning Map 58 Figure 29.3: Existing land use map 242
-
Figure 22.3: Existing Land Use Map 59 Figure 29.4: Proposed zoning map 245
-
Figure 22.4: Proposed Zoning Map 62 Figure 29.5: Proposed transport network map 248
-
Figure 22.5: Proposed Transport Network Map 65 Figure 29.6: Strategic Projects 251
-
Figure 22.6: Strategic Projects 69 Figure 30.1: Location and Physiography 260
-
Figure 23.1: Location and Physiography 83 Figure 30.2: RP 1997 Zoning Map 261
-
Figure 23.2: RP 1997 Zoning Map 84 Figure 30.3: Existing Land Use Map 262
-
Figure 23.3: Existing Land use Map 85 Figure 30.4: Proposed Zoning Map 265
-
Figure 23.4: Proposed Zoning Map 88 Figure 30.5: Proposed Transport Network Map 268
-
Figure 23.5: Proposed Transport Network Map 92 Figure 30.6: Strategic Projects 272
-
Figure 23.6: Strategic Projects 96 Figure 31.1: Location and Physiography 282
-
Figure 24.1: Location and Physiography 112 Figure 31.2: RP 1997 Zoning Map 283
-
Figure 24.2: RP 1997 Zoning map 113 Figure 31.3: Existing Land Use Area Statement 284
-
Figure 24.3: Existing land use map 114 Figure 31.4: Proposed Zoning Map 287
-
Figure 24.4: Proposed Zoning map 117 Figure 31.5: Proposed Transport Network Map 290
-
Figure 24.5: Proposed transport network map 120 Figure 31.6: Strategic projects 294
-
Figure 24.6: Strategic Project 123 Figure 32.1: Location and Physiography 306
-
Figure 25.1: Location and Physiography 132 Figure 32.2: RP 1997 Zoning Map 307
-
Figure 25.2: RP 1997 Zoning Map 133 Figure 32.3: Existing Land Use Map 309
-
Figure 25.3: Existing Land Use Map 134 Figure 32.4: Proposed Zoning Map 311
-
Figure 25.4: Proposed Zoning Map 137 Figure 32.5: Proposed Transport Network Map 314
-
Figure 25.5: Proposed Transport Network Map 140 Figure 33.6: Strategic projects 318
-
Figure 25.7: Strategic Project 144 Figure 33.1: Location and Physiography 328
-
Figure 26.1: Location and Physiography 161 Figure 33.2: RP 1997 Zoning Map 329
-
Figure 26.2: RP 1997 Zoning Map 162 Figure 33.3: Existing Land Use Map 330
-
Figure 26.3: Existing Land Use Map 163 Figure 33.4: Proposed Zoning Map 333
-
Figure 26.4: Proposed Zoning Map 166 Figure 33.5: Proposed Transport Network Map 336
-
Figure 26.5: Proposed Transport Network Map 169 Figure 33.6: strategic projects 339
-
Figure 26.6: Strategic Projects 173 Figure 34.1: Location & physiographic 348
-
Figure 34.2: RP 1997 Zoning Map 349 Figure 38.8: Proposed Zoning Map 432
-
Figure 34.3: Existing land use map 350 Figure 38.9: Physiography 434
-
Figure 34.4: Proposed zoning map 353 Figure 38.10: Existing Land Use Map 435
-
Figure 34.5: Proposed transport network map 356 Figure 38.11: Demographic projections
-
Figure 34.6: strategic projects 359 and the rural catchment 436
-
Figure 35.1: Location and Physiography 368 Figure 38.12: Proposed Zoning Map 437
-
Figure 35.2: RP 1997 Zoning Map 369 Figure 38.13: Physiography 438
-
Figure 35.3: Existing Land Use Map 370 Figure 38.14: Existing Land Use Map 439
-
Figure 35.4: Proposed Zoning Map 372 Figure 38.15: Demographic projections
-
Figure 35.5: Proposed Transport Network Map 375 and the rural catchment 440
-
Figure 35.6: Strategic Projects 379 Figure 38.16: Proposed Zoning Map 441
-
Figure 36.1: Location and Physiography 390 Figure 38.17: Physiography 442
-
Figure 36.2: RP 1997 Zoning Map 391 Figure 38.18: Existing Land Use Map 443
-
Figure 36.3: Existing Land Use Map 392 Figure 38.19: Demographic projections
-
Figure 36.4: Proposed Zoning Map 394 and the rural catchment 444
-
Figure 36.5: Proposed Transport Network Map 396 Figure 38.20: Proposed Zoning Map 445
-
Figure 36.6: Strategic Projects 399 Figure 38.21: Physiography 446
-
Reservations 401 Figure 38.22: Existing Land Use Map 447
-
Figure 37.1: Location and Physiography 406 Figure 38.23: Demographic projections
-
Figure 37.2: RP 1997 Zoning Map 407 and the rural catchment 448
-
Figure 37.3: Existing Land Use Map 408 Figure 38.24: Proposed Zoning Map 449
-
Figure 37.4: Proposed Zoning Map 410 Figure 38.25: Physiography 450
-
Figure 37.5: Proposed Transport Network Map 413 Figure 38.26: Existing Land Use Map 451
-
Figure 37.6: Strategic Projects 416 Figure 38.27: Demographic projections
-
Figure 38.1: Physiography 424 and the rural catchment 452
-
Figure 38.2: Existing Land Use Map 425 Figure 38.28: Proposed Zoning Map 453
-
Figure 38.9: Proposed Zoning Map 427 Figure 38.29: Physiography 455
-
Figure 38.5: Physiography 429 Figure 38.30: Existing Land Use Map 455
-
Figure 38.6: Existing Land Use Map 430 Figure 38.31: Demographic projections
-
Figure 38.7: Demographic projections and the rural catchment 457
-
the rural catchment 431 Figure 38.32: Proposed Zoning Map 458
Loading…