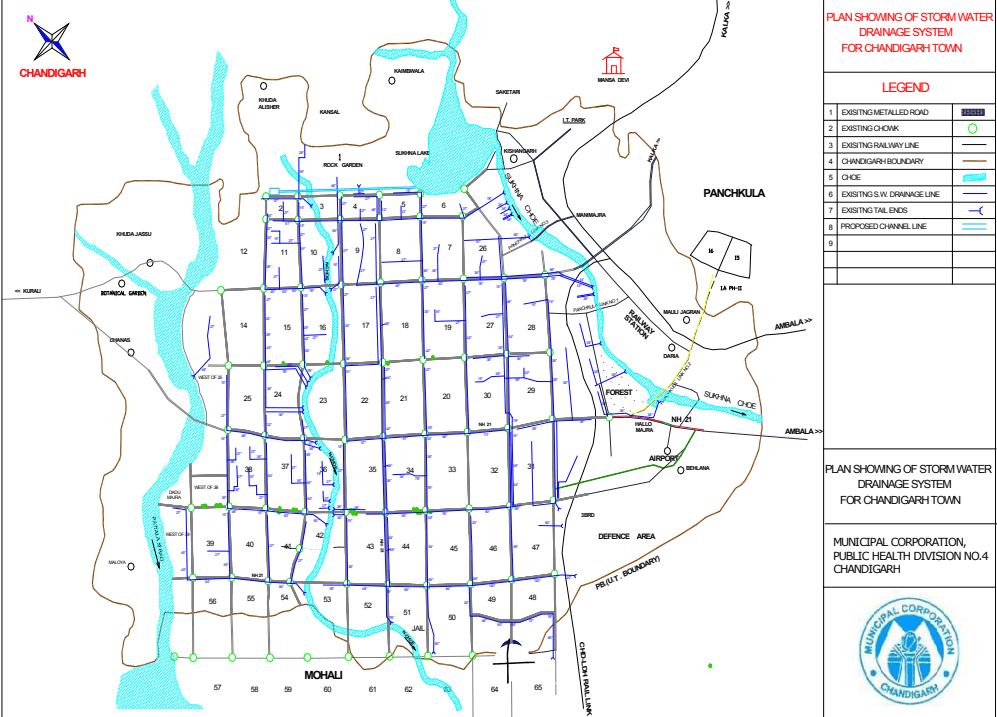
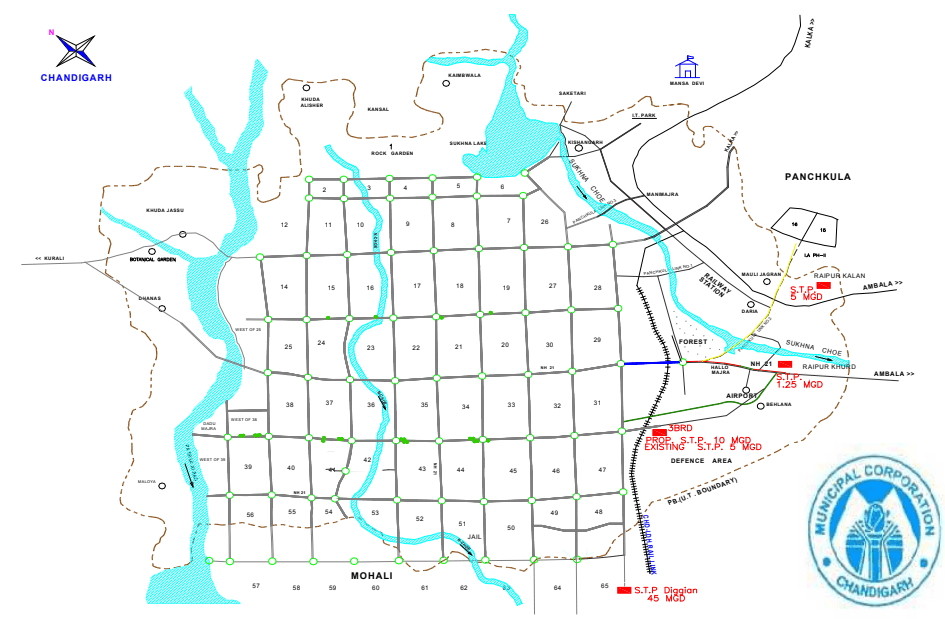
Sewerage Network
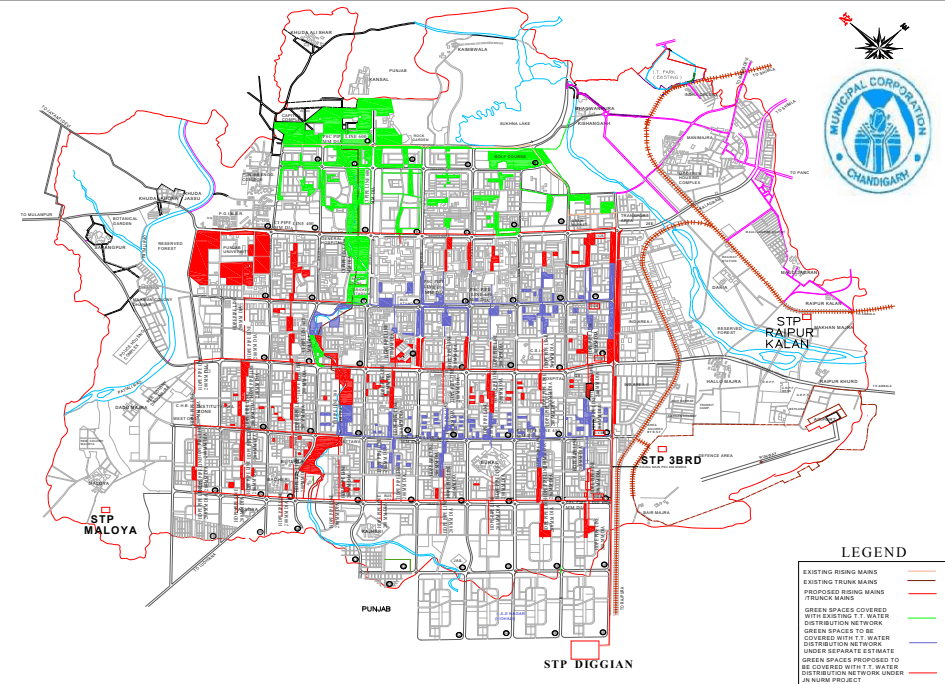
The first phase (sector 1-30) of Chandigarh’s sewerage system was laid during 1952 to 1965, the second phase (sector 31 to 47) from 1965 to 1976 and the third phase from 1976 onwards. There are separate sewer and storm water drainage systems in Chandigarh. The sewerage and storm water is discharged by gravity flow due to good natural slope from north east to south west. The slope also helps the sewers to be naturally cleaned due to the good self cleansing velocities. There is a well organized network of main and branch sewerage drains. The egg shaped brick trunk sewers offshoot into 18 inches dia stoneware pipe branch sewers of each sector at major junctions of V3 roads. The main sewage runs from west to east with inter connection of sewer line from south to north. No pumping is involved because of the city’s topography. The length of stoneware sewage pipe network is 742 km. The population catered to by the sewerage system is 95%.
Quantum of sewage generation
At present 65.25 million gallons of sewage is generated per day in Chandigarh. Out of this, 45 MGD is treated at sewage treatment plant (STP) at Diggian, Phase X1 Mohali and the remaining at Raipur Khurd (1.25 MGD), Raipur Kalan (5 MGD), 3 BRD (5MGD), Sector 47, Chandigarh. Another I0 MGD STP is under construction at 3 BRD. After commission of this STP, total sewerage generated will be treated upto required standards.
10.4 POWER SUPPLY POSITION
土
Union Territory of Chandigarh came into existence with effect from 01.11.1966 after re-organization of erstwhile state of Punjab. The Local distribution of electricity in Chandigarh was taken over by the Chandigarh Administration, from the PSEB on 2nd May, 1967 and is responsible for distribution of power supply up to consumer’s door-step for making quality and continuous power supply available to each and every resident.
The UT of Chandigarh has no power generation of its own and the power requirement is met through firm share as well as unallocated quota from the Central Generating Stations. At present, UT Chandigarh has availability of power of approximately 200-270 MW of power from Central Generating Stations during different hours against the present summer demand of 275-350 MW. Accordingly, to meet with the demand gap, the Electricity Department is purchasing additional power from open market/ banking arrangement/ power exchanges.
UT Chandigarh has been working towards expanding and strengthening its power infrastructure to meet the increasing consumer demand in various sectors of the economy and presently it has one 220 KV Sub Station,13 -66 KV Sub Station, 5- 33 KV Sub Station, 1813- 11 KV indoor and pole mounted Sub Station, 54 Kms. of double ckt. 220 KV lines, 103 Km. of 66 KV line, 28 Km of 33 KV line, 860 Km of 11 KV lines and 1234 Km of LT lines.
Per capita consumption of electricity in the UT Chandigarh has increased from 253 Kwh in 1967-68 to 1068 Kwh in 2009-10 against the national figure of 700 Kwh and accordingly electricity consumption has increased from 1.38 LU per day to 66 LU on a particular day.
The total transformation capacity in 1967-68 was 15.6 MVA which has increased to 636 MVA.
The number of consumers in 1967-68 was 27821 which have been increased to approximately 2 Lakhs.
The present connected load is 1136 MW.
The peak power demand in 1967-68 was approximately 14 MW which has been touched to 350 MW during this year i.e. on dated 21.06.2012. The T&D loss in 1967-68 was 25 % which has been reduced to approximately 17%.
The number of employees in 1990-91 was 1540 which has been presently decreased to 1085 against the sectioned post of 1790 numbers. The units purchased in 1967-68 were 57 MUs which has been increased to approximately 1682 MU. The units billed in 1967-68 were 43 MUs which has been increased to approximately 1300 MU. The revenue realization in 1967-68 was Rs 0.84 Cr which has been increased to approximately Rs 530 Cr.
To meet with the growing demand of power, the power purchase agreements have been tied up with future upcoming thermal/ hydro power plants. Load flow studies are being got conducted to strengthen the distribution infrastructure and two 220 kV sub-stations and six 66 kV sub stations are under planning.
To reduce the T&D loss further, R-APDRP programme of Government of India/Ministry of Power is being implemented and the work will start shortly.
Further, the working of the Electricity Department is being regulated by JERC. The first two ARR for the FY 2011-12 and
FY 2012-13 have been filed and the same have been approved by the JERC and stands implemented.
Gas based energy source to be tapped in view of land / space constraints
SCADA based power monitoring of street lights .
11 KV and 66 KV lines to be laid underground in future and existing overhead lines to be made underground .
PLAN P3 - EXISTING POWER MAP OF CHANDIGARH
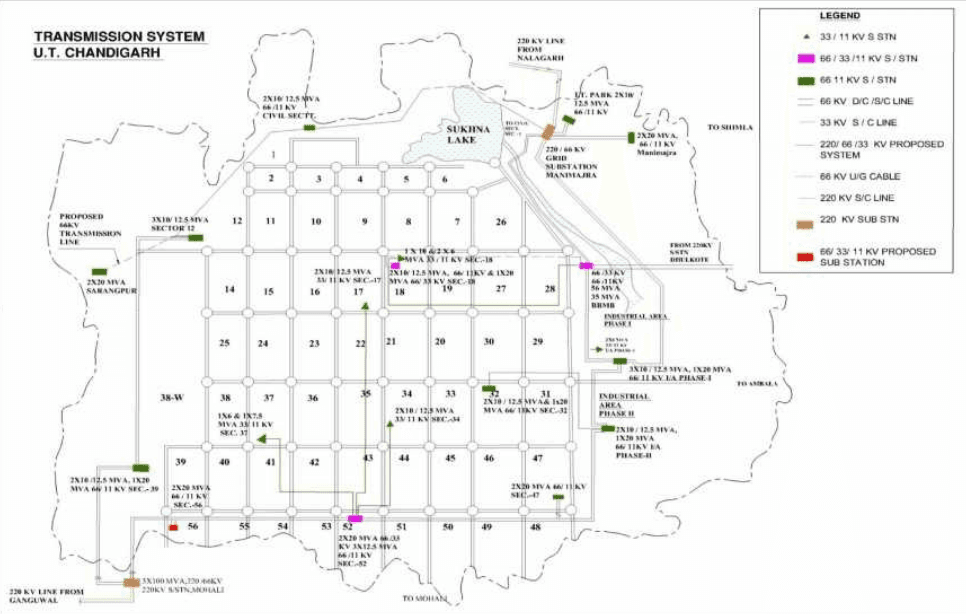
Chandigarh Electricity Department
TABLE T1 - NETWORK SUMMARY
土
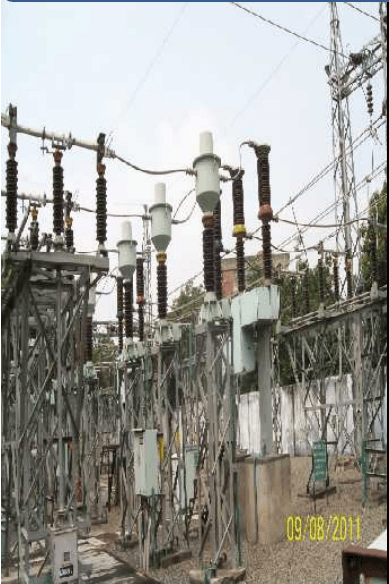
POWER SYSTEM INFRASTRUCTURE
| Sr.No. | Equipment Particulars | 1990-91 | 2001-02 | 2011-12 | Anticipated requirement2029-30 |
|---|---|---|---|---|---|
| 1 | 220 KVS/Stn.(Nos.) | 0 | 1 | 1 | 3 |
| Transformation capacity(MVA) | 0 | 100 | 200 | 800 | |
| 2 | 66 kVS/Stn. (Nos.) | 5 | 8 | 13 | 20 |
| Transformation capacity(MVA) | 218.5 | 318.5 | 616 | 916 | |
| 3 | 33 kVS/Stns(Nos) | 5 | 6 | 5 | 0 |
| Transformation capacity (MVA) | 71 | 112 | 120 | 0 |
Chandigarh Electricity Department
TABLE T2 - 18th ELECTRIC POWER SURVEY FORECAST (as per CEA)
土
| ENERGY CONSUMPTION, ENERGY REQUIREMENT AND PEAK LOAD | |||||||||||||
| Consumption Categories | 2009-10 | 2010-11 | 2011-12 | 2012-13 | 2013-14 | 2014-15 | 2015-16 | 2016-17 | 2017-18 | 2018-19 | 2019-20 | 2020-21 | 2021-22 |
| Domestic | 472 | 506 | 539 | 571 | 606 | 643 | 682 | 723 | 767 | 813 | 862 | 914 | 970 |
| Commercial & Misc | 382 | 401 | 426 | 452 | 479 | 508 | 539 | 572 | 607 | 643 | 683 | 724 | 768 |
| Public Lighting | 15 | 15 | 15 | 15 | 16 | 16 | 16 | 17 | 17 | 17 | 18 | 18 | 18 |
| Public Water Works | 0 | 0 | 0 | 0 | 0 | 0 | 0 | 0 | 0 | 0 | 0 | 0 | 0 |
| Irrigation | 1 | 1 | 1 | 1 | 1 | 1 | 1 | 1 | 2 | 2 | 2 | 2 | 2 |
| Industries LT | 137 | 146 | 153 | 161 | 169 | 177 | 186 | 195 | 205 | 215 | 226 | 237 | 249 |
| Industries HT | 141 | 146 | 155 | 164 | 174 | 184 | 195 | 207 | 219 | 233 | 246 | 261 | 277 |
| Bulk Supply | 89 | 94 | 98 | 103 | 108 | 114 | 120 | 125 | 132 | 138 | 145 | 153 | 160 |
| Total (Energy | 1238 | 1309 | 1387 | 1468 | 1553 | 1643 | 1739 | 1841 | 1948 | 2062 | 2182 | 2309 | 2444 |
| Consumption) | |||||||||||||
Chandigarh Electricity Department