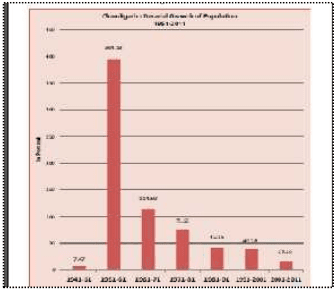
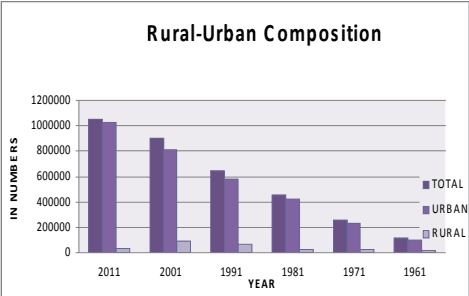
The population density during the last 5 decades (1961-2011) has increased 9 fold, from 1051 to 9252 persons per sq. km.
The density of the city doubled during 1961-71, when it increased from 1051 persons per sq. km to 2257 persons per sq. km. It went on increasing rapidly in subsequent decades with 3961 persons per sq. km in 1981, 5632 persons per sq. km in 1991 and 7900 persons per sq. km in 2001. With the latest census data becoming available, the density recorded for the Chandigarh UT is now placed at 9252 persons per sq. km in 2011.
Chandigarh shall continue to record higher densities with further population growth , which poses a challenge for maintaining the quality of life and providing basic & essential services even to its poorest residents as visioned by the city’s planners.
5.3.1 Sector Wise Distribution of Population & Density & the UT’S Holding Capacity
Detailed analysis of the holding capacity of each sector based on the number of existing or planned dwelling units and their population as per the 2001 census has been done. This is shown in Table D1.3 (see Annexure Page 7).
Further assessment of population density has also been done for different phases of the city’s development i.e. Phase I comprising of Sectors 1-30, Phase II comprising of Sectors 31-47, and Phase III with sectors 48-56, 61 and 63.
5.3.2 Densities AS Per Original Plan
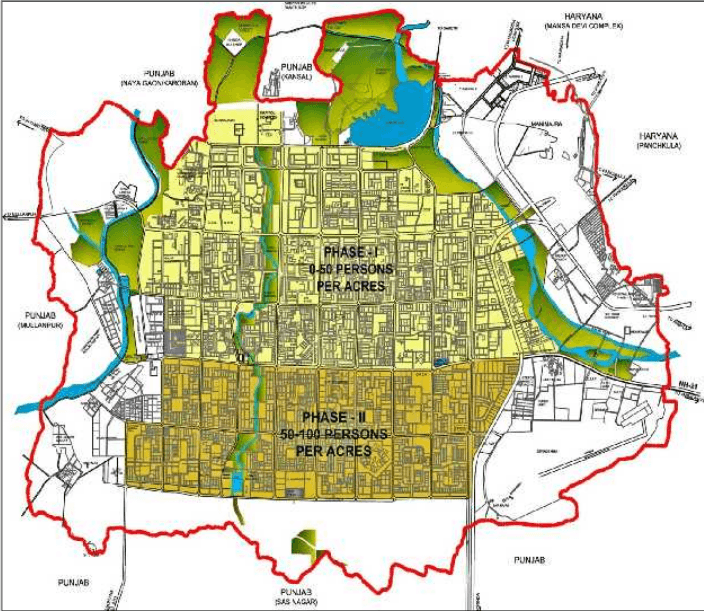
The capital city of Chandigarh was planned for a differential pattern of density to accommodate a total population of 5 lakhs. Phase I was planned to be low density development with 9000 acres of land housing 150000 population.
Phase II was planned for higher density with 6000 acres of land accommodating 350000 people.
5.3.3 Prevailing Densities AS Per 2001 Census
The prevailing density of Phase I of the city as per the 2001 census was 26, whereas for Phase II, it was 60 persons per acre. The density of Phase III (which was added subsequently), has been proposed as approx. 100 persons/acre.
Thus, by 2001, the density of Phase-I had already exceeded the design density when that of Phase-II sectors was the same as was designed. The city however, still has reasonable capacity to accommodate additional population.
5.3.4 Density AS Per Holding Capacity / Projections
As per the population worked out for the city on the basis of its holding capacity, the density of Phase I is estimated to be 34 persons per acre (more than double the planned density), 83 persons per acre for Phase II and 100 persons per acre for Phase-III sectors.
It can be seen that as against the planned population of a sector varying from 15000 – 25000, large variations in population at the sector level have been observed with the highest population of 41,077 being recorded in Sector 45, and the lowest population of only 1 being recorded in Sector 63.
The highest population in Phase I sectors was recorded in Sector 20 was 22,138, whereas in Phase II (31-47), the position is occupied by Sector 45, with a population of 41,077.
| Phase | Planned Density(persons/acre) | Density as per Census 2001 (persons/acre) | Density as per Holding Capacity(persons/acre) |
|---|---|---|---|
| I-Sector1to30 | 16 | 26 | 34 |
| II-Sector31to47 | 59 | 60 | 83 |
| III-Sector48t056, 61,63 | - | Under process of development | 100 |
The density pattern is likely to undergo considerable change in the years to come with the city recording higher growth and development. As per existing trends, the sectors falling in Phase I shall continue to have lower density as compared to the sectors falling in Phase II.
The highest population density will be in the sectors falling in Phase III due to group housing and large scale rehabilitation of the population of unauthorized settlements in these sectors. As per the density calculated according to the holding capacity it can be mentioned that the higher densities will be in Manimajra (161 PPA), Sector 38 West (211PPA), Sector 63(195 PPA) and in Rehabilitation colonies at Ram Darbar (157 PPA). The detail of area and densities for Rehabilitation Colonies is at Table 1.3 (a)
PLAN D1 – DENSITY PATTERN IN SECTORS (AS PER ORIGINAL PLAN)

PLAN D2 - DENSITY PLAN OF CHANDIGARH (AS PER CENSUS -2001)
土
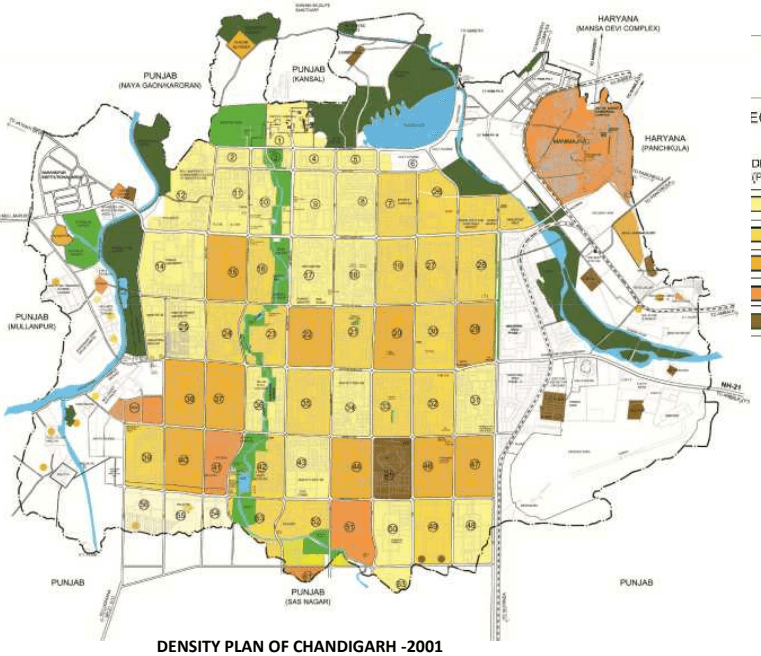
EGEND:
| DENSITY(PERSONS PER ACRES) | NO. OF SECTORS |
|---|---|
| 0-25 | 26 |
| 25-50 | 18 |
| 50-100 | 10 |
| 100-150 | 3 |
| ABOVE 150 | 1 |
DENSITY PLAN OF CHANDIGARH -2001
PLAN D3 - DENSITY PLAN OF CHANDIGARH (AS PER HOLDING CAPACITY)
土
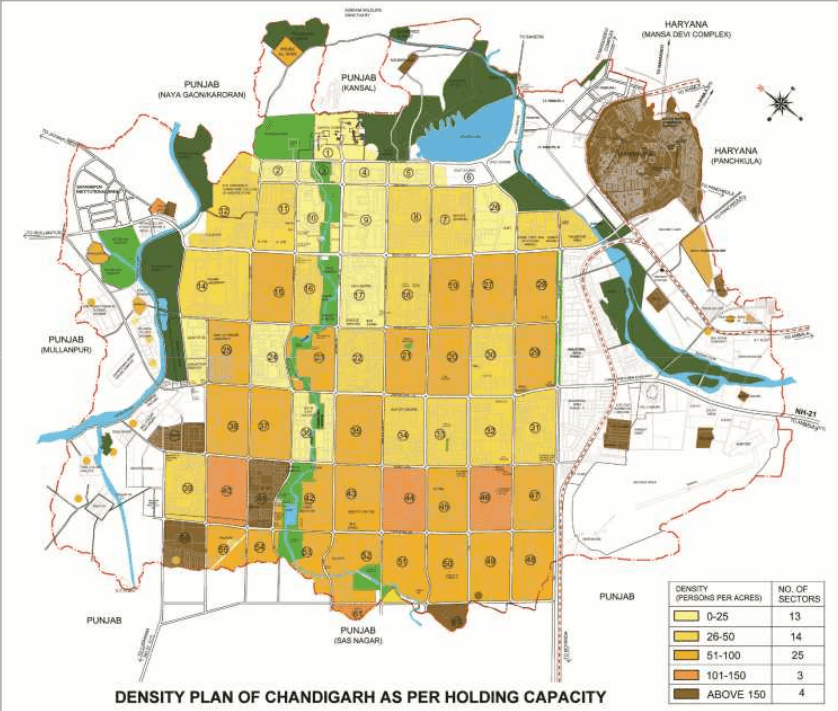
| DENSITY (PERSONS PER ACRES) | NO. OF SECTORS |
|---|---|
| 0-25 | 13 |
| 26-50 | 14 |
| 51-100 | 25 |
| 101-150 | 3 |
| ABOVE 150 | 4 |