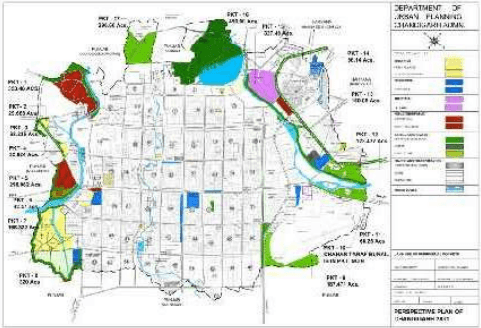
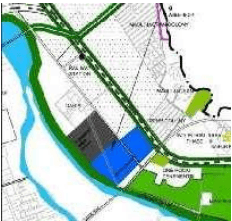
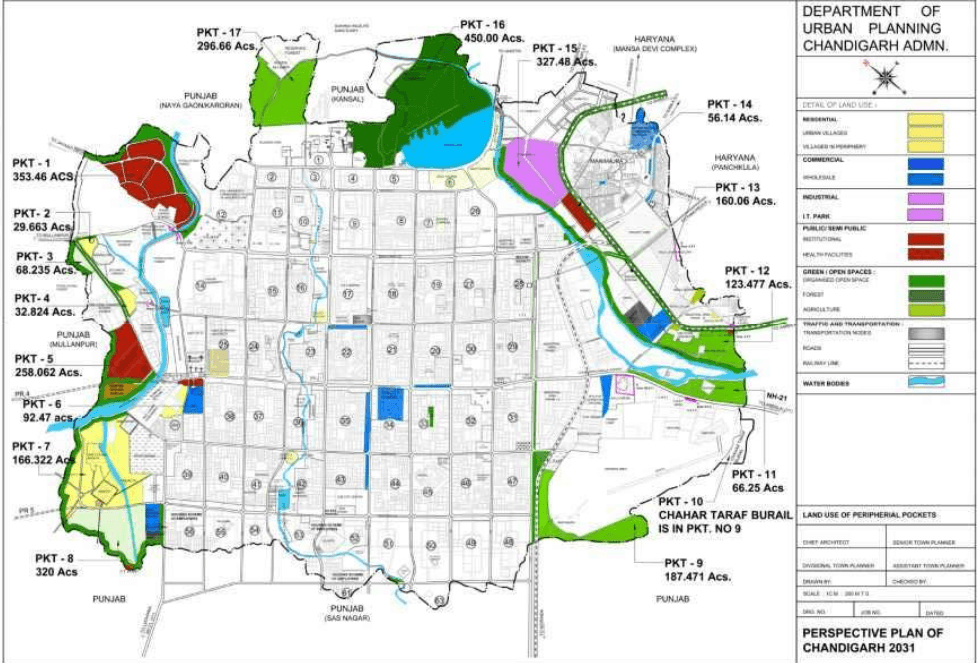
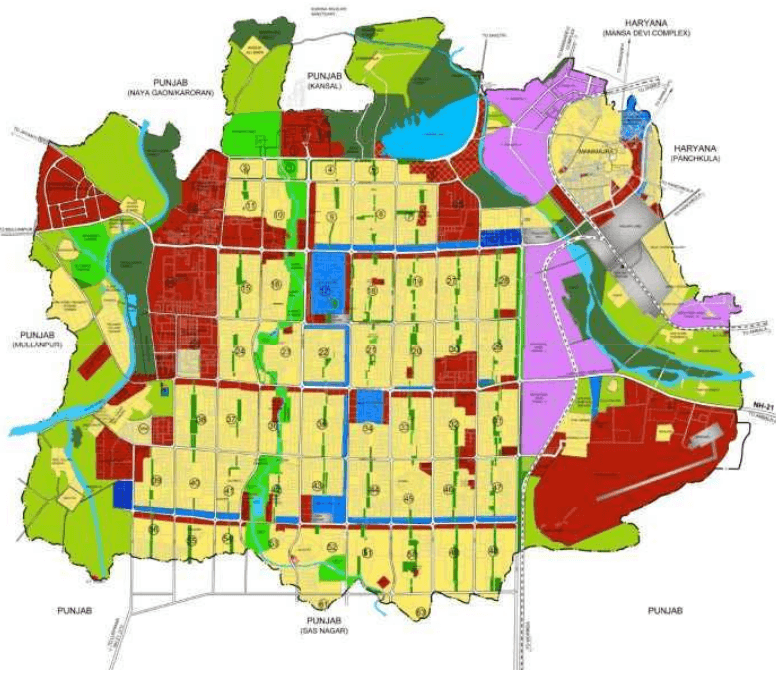
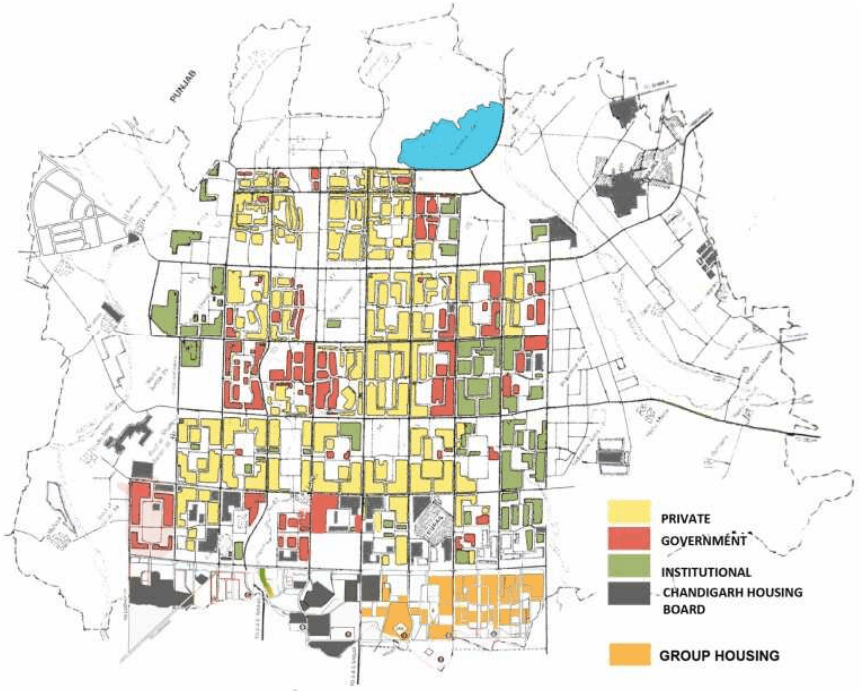
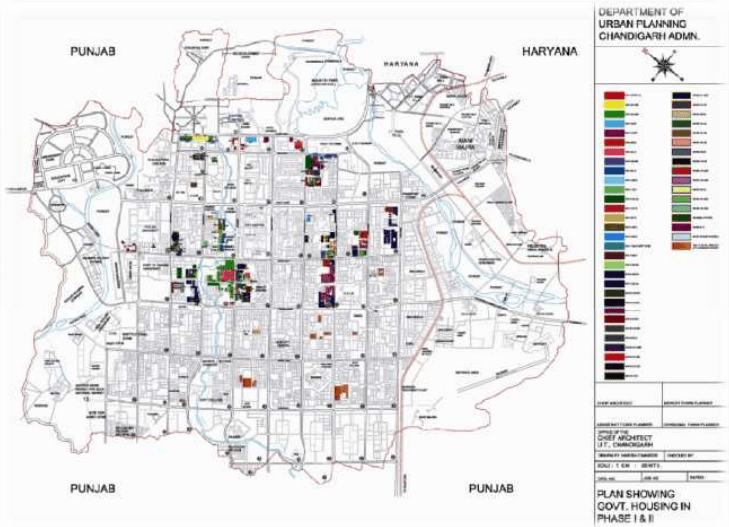
Landuse for the city of Chandigarh was defined by the Plan prepared by Le Corbusier. Based on the CIAM (Congress International de Architecture Modern) principles of the Functional City which focused on segregation of four major functions i.e. Living (the residential sectors), Working (the Capitol Complex, commercial/institutional buildings along Madhya Marg, Jan Marg, City Centre), Care of Body and Spirit (the Leisure Valley, open spaces and sector greens) and Circulation (the network of roads, the 7Vs).
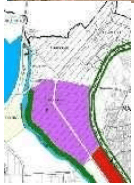
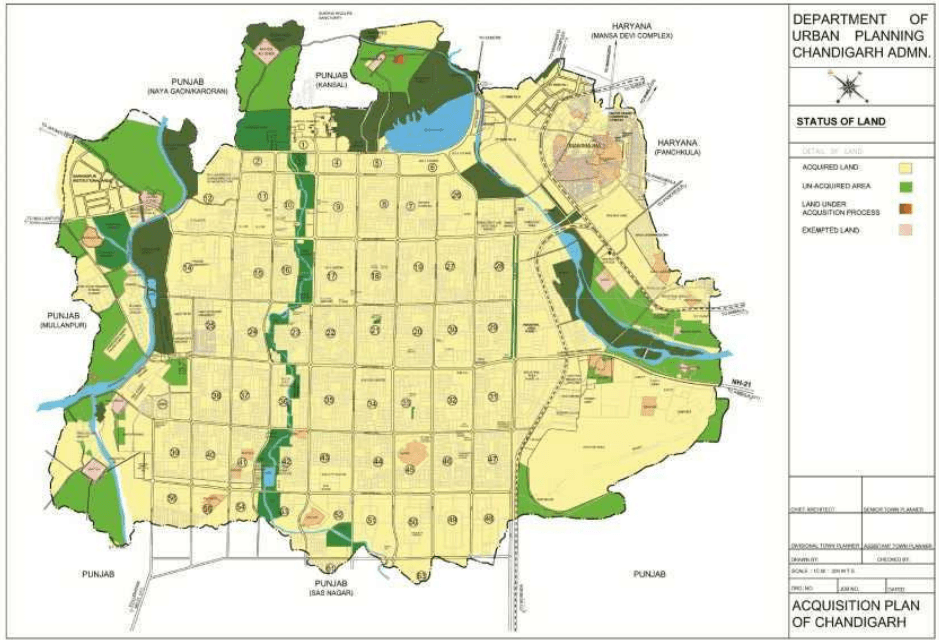
The total area proposed to be covered in the Master Plan is the entire area of 28169.61 acres comprising of Chandigarh Union Territory .The area includes both the area falling under the Phase I ,Phase II and Phase III sectors besides the area under the periphery. Considering the pattern of development followed in Chandigarh, the Existing Landuse Plan is being detailed out in two parts. Part I comprises of planned development included in the original plan (Phase I & II) and the subsequent developments made as part of the extended sectoral grid (Phase III ). The remaining landuse of the area falling in the periphery is being detailed out separately keeping in view the nature and context of development.
In Phase I and II, out of the 46 sectors in the sectoral grid falling within the first and the second phase of the original plan, 39 sectors are Residential whereas the remaining seven sectors namely sectors I, I2, I4, I7, 26(part), 34(Part), 43(part) are predominantly Institutional and Commercial housing the Capitol Complex, PGI/PEC, Panjab University, City Centre and Sub City Centres respectively. The Industrial Area, the Sukhna Lake, and Golf Range/Club have also been considered as part of the sectoral grid of Phase I and II. Phase III sectors (remaining parts of sectors 48 to 56, 61 and 63) falling in Chandigarh UT have been earmarked as Residential sectors. These sectors also include the belts reserved as Commercial/ Institutional along the Vikas Marg now proposed for mix landuse.
The details of areas falling under different phases and periphery are as under:
| CATEGORY | SECTORS | AREA in (acres) | PERCENTAGE |
|---|---|---|---|
| Phase I | 1 TO 30 * | 9398.83 | 33.37 |
| Phase II | 31 TO 47** | 5158.76 | 18.31 |
| Phase III | 48 TO 56 (PART) | 1870.54 | 6.64 |
| TOTAL | 16427.73 | 58.32 | |
| Remaining area of periphery | 11741.88 | 41.68 | |
| Grand total | 28170.00 |
- Includes the area of Industrial Area Phase I, Sukhna Lake, Golf Range.
- Includes the area under Industrial Phase II .
Out of the total area covered by the Master Plan, 58.32 % (16428.13 acres) falls under the area covered by the planned development whereas remaining area of 41.68% (11741.88 acre) falls in the periphery. Within the area falling under the planned sectors, Phase I has largest area comprising of 1/3rd of the area of the Master Plan whereas Phase II and Phase III has 1/4th of the total area of the Master Plan and remaining area falls in the periphery.
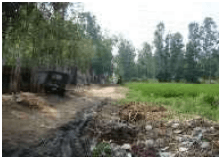
The area in the periphery comprising village abadis, agricultural land and the area where planned and unplanned development has taken place works out to be 11741.87 acres. As explained above, the existing landuse analysis has been carried out in two parts i.e. Area falling within the Sectoral Grid (Phase i, II & III) and Area outside the Sectoral Grid (Periphery).
13.3 EXISTING LANDUSE
Area falling within the Sectoral Grid (Phase I, II and III)
The existing landuse has been analysed in terms of different components i.e. Residential, Commercial, Traffic & Transportation, Industries, Public / Semi Public etc. Refer Table I, II & III. Looking at the above tables in Phase I, largest proportion of land has been allocated to the Residential component (42.69%) whereas Public and Semi Public have approximately same kind of area. The area under the Commercial component is placed at 4.73% whereas Traffic and Transportation occupies around 8% of the Total Area of Phase I. The above proportions of the areas have been worked out based on taking the entire area of residential sectors as the residential component. If the residential component is further detailed out, the proportions under residential will go down, whereas area under commercial, traffic, public and semi public, recreational shall accordingly go up. The detailed Landuse of Sectors falling in Phase I has been given in Annexure I. Each sector has a different pattern of Landuse as detailed out in the Table.
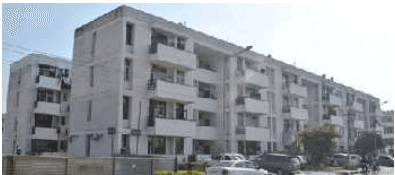
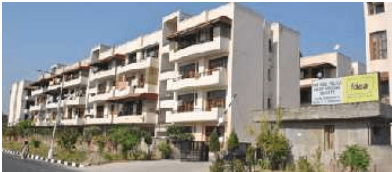
In case of Phase II, the proportion of Residential component is much higher i.e. 67.08 %, similarly, Commercial component is also higher than Phase I. The variation in landuse in this phase is due to the fact that Phase I was planned as low density sectors whereas the Phase II sectors were proposed to house larger population and were planned as high density neighbourhoods with smaller sized plots and ground coverage. As stated above, if the analysis of the sectors is carried out for different landuses, the proportion of Residential component will go down whereas the remaining component will go higher. The details of Landuse of Individual Sectors falling in Phase II is given in Annexure II. Considering the fact that Phase III development is largely guided by group housing, excluding the planning of individual plots, the proportion of Residential component has been found to be much higher. Residential area occupies (3)/(4) of the total area of Phase III. however, the area calculations is again based on taking the sectors as residential landuse without going into the details of various components included in the sector planning. Accordingly, the area under different uses will get rationalised once that analysis is included in different land uses. The detail Landuse of individual sectors falling in Phase III is given in Annexure III.
Landuse Within Remaining Area of UT Periphery
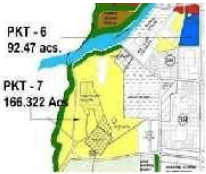
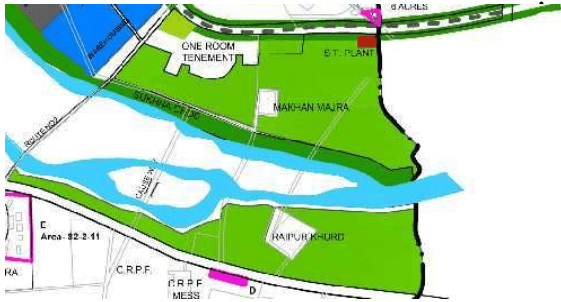
A perusal of the periphery area in the UT indicates that large chunks of land in the periphery have already been acquired for accommodating new land uses.
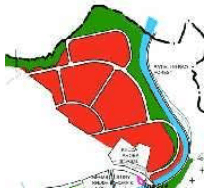
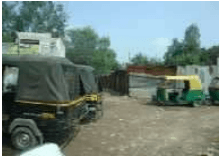
While developing area in the periphery, the existing road network with few upgradations has been used as the basis for providing accessibility to the pockets and developing these areas without a comprehensive road network. The landuse analysis of the existing development has been carried out for the area falling in the periphery and is detailed in Table IV & V
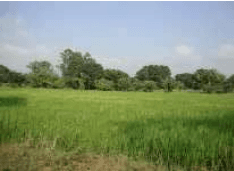
Out of the Total Area of 11741.88 acres, Residential component covers approx. 1/6th of the total areas. Commercial component accounts for 2.736%, Traffic and Transportation 5%, Industries 4.5%. In addition, area under Defense Use is placed at 13.4% which is close to the Residential component. Other Uses in the periphery area include Public /Semi Public, Recreational and Public Utilities. 19% of the Total Periphery Area is under Forest whereas the Agricultural component accounts for 21.67%.