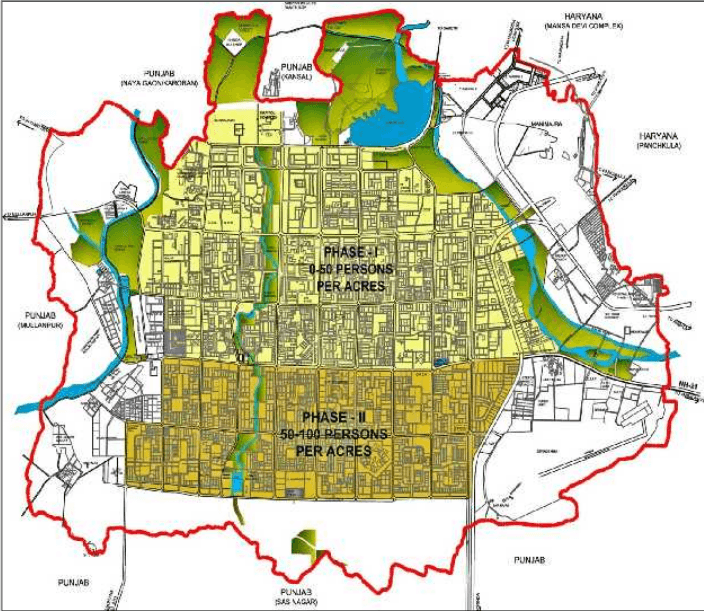
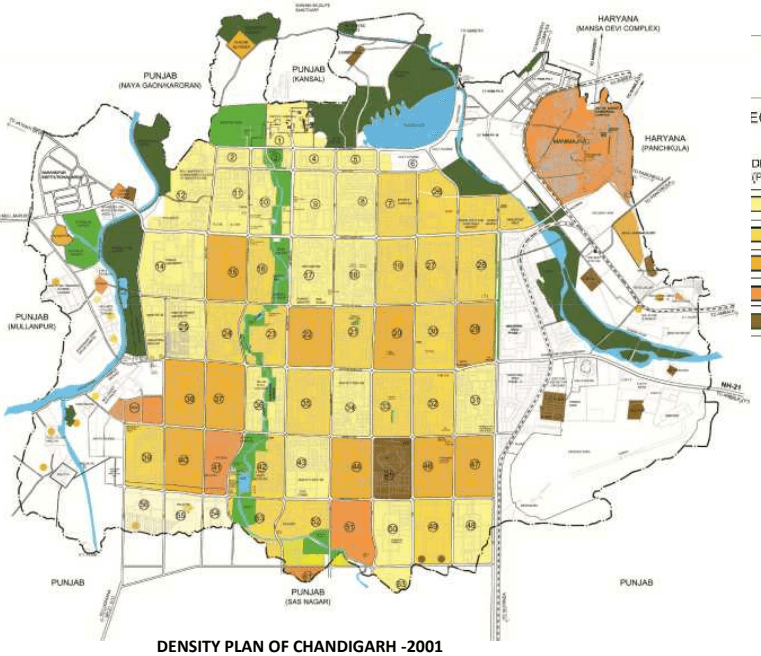
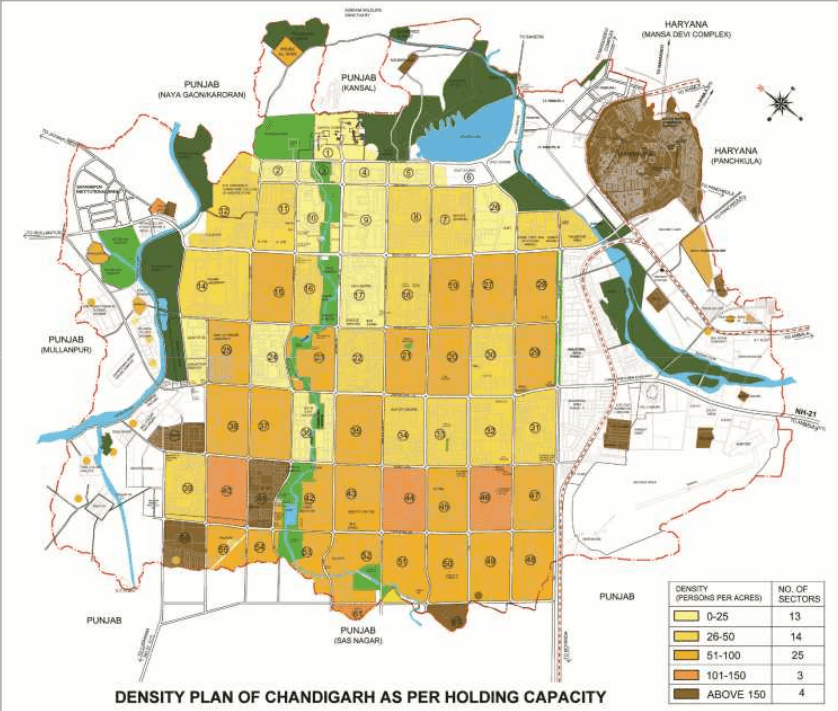
The UT of Chandigarh is a uni-district territory which came into existence on 1st of November, 1966 with an area of 114 sq. kms.
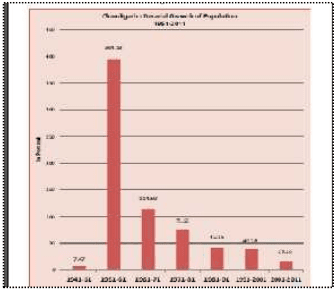
During the last 6 decades (1951-2011), Chandigarh has witnessed a population increase of more than forty four times with the absolute population increasing from 24,261 in 1951 to 10,54,686 in 2011.
As per Census 2011, the population of Chandigarh U.T has crossed the one million mark with its population placed very close to that of the state of Mizoram (10,91,014). The Union Territory recorded a population of 10,54,686 in 2011 with much lower decadal rate of increase in population with only 154051 people being added to the Chandigarh UT during the last decade.
The growth rate of merely 17.10% between 2001-2011 is the slowest since its inception. This is perhaps due to the rapid pace of urbanization taking place in the neighbouring towns of Mohali, Panchkula, Zirakpur, Kalka, Kharar, etc. falling within the 16 km periphery control area.
The details of the total population, decadal absolute growth and decadal growth rate are given in Table D1.1 below:
| Year | Total Population | Decadal Absolute variation of Population | Decadal Growth Rate(in%age) |
|---|---|---|---|
| 1951 | 24261 | - | - |
| 1961 | 119881 | 95620 | 394.13 |
| 1971 | 257251 | 137370 | 114.59 |
| 1981 | 451610 | 194359 | 75.55 |
| 1991 | 642015 | 190405 | 42.16 |
| 2001 | 900635 | 258620 | 40.28 |
| 2011 | 1054686 | 154051 | 17.10 |
Source – Census of India
5.2
土
Rural –urban Composition
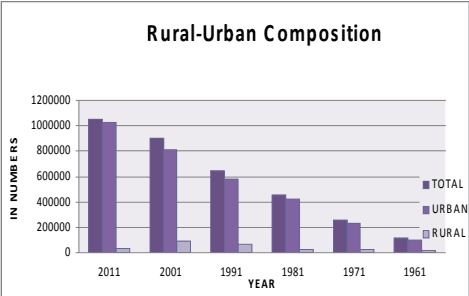
The U.T of Chandigarh has essentially become one territory with the urban settlements of Chandigarh and Manimajra occupying a major part of its 114 sq.km area.
As per the census of 2011, 10,25,682 (97.25%) of its population was urban and 29,004 (2.75%) was rural as compared to 82.80% urban and 17.20% rural in the year 1961. The details are at Table D1.2a.
TABLE D1.2a