The natural slope of Chandigarh’s site facilitates easy disposal of storm water through Sukhna Choe, N-choe and Patiala ki Rao. Due to the provision of proper road gullies and good slope of pipes, the storm water drainage of Chandigarh is in good condition. The city however experiences the choking of drains due to plastic bags and other solid waste during heavy rains especially near roundabouts.
Reasons for Floods in Chandigarh
The key reasons for this situation are assessed as follows:-
Some areas of city experience floods due to inadequate drainage system, which was designed for rainfall of 12 mm/hour excessive concentration of flood due to heavy down pour.
Disappearance of flood absorbing ‘N’- choe because of urbanisation.
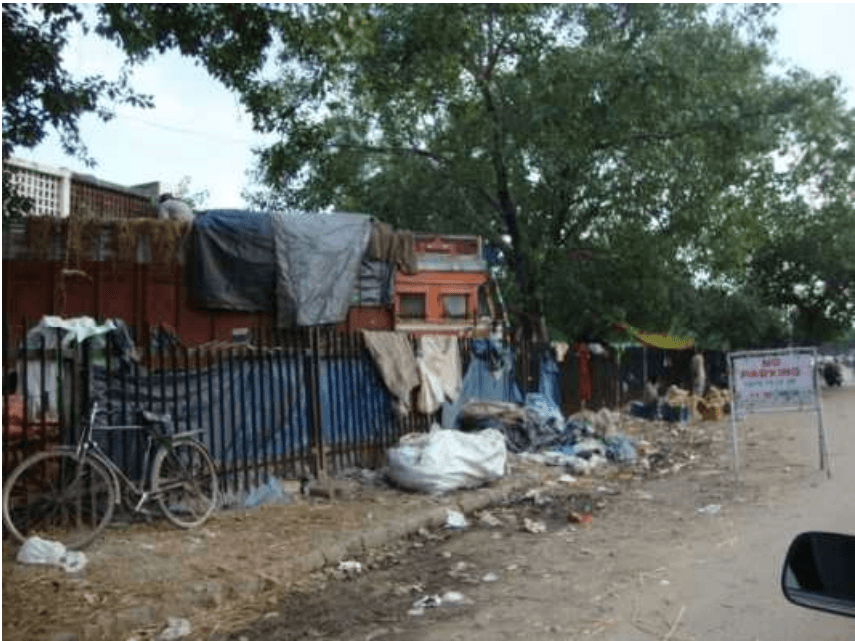
Dumping of debris and garbage into the open nallahs / N-choe.
Illegal encroachment of natural water courses.
Indiscriminate laying of service lines all along and across natural courses.
Filling of ‘N’- choe in Chandigarh which decreases the drainage capacity.
Diversion of natural water courses to accommodate habitations.
Increased run off due to increase in impervious areas.
Chapter 10
10.1 Introduction
Chandigarh’s sectoral grid has a well-designed system of piped water supply and sewerage disposal. Under the city’s Water Byelaws, every planned dwelling unit has to have water and sewerage connections. With the formation of U.T in 1966, all the works for the city’s physical infrastructure were handled by the respective departments of the Chandigarh Administration. After creation of the Municipal Corporation of Chandigarh in 1994, the city’s water supply, sewerage system, storm water drainage, solid waste management & sanitation, have been transferred to the Municipal Corporation. The Ministry of Urban Development (MOUD) has formulated benchmarks for service delivery in four areas as mentioned in Table at ANNEXURE-P.1. The purpose of formulating these benchmarks is to shift the focus from infrastructure creation to service delivery.
Water supply - sources of water
When Chandigarh was planned, the good availability of sub soil water was considered adequate for meeting the city’s requirements as the yield of tubewells was sufficient. With increase in the city’s population, many tubewells started drying up. It was decided to tap surface water of the Bhakra Main Line flowing at a distance of 27.5 Kms. from Chandigarh to meet the city’s growing water requirements. The first phase of augmentation of water supply from the canal was commissioned in 1983. It was decided by the Government of India that this quantity of water will be shared by Punjab, Haryana, Chandigarh Administration and Chandimandir Cantonment in the following ratios:
Union Territory Chandigarh : 29 cusecs. (14.5 mgd)
Punjab (for Mohali) : 5 cusecs ( 2.5 mgd)
Haryana (Panchkula) : 3 cusecs ( 1.5 mgd)
Chandimandir Cantonment : 3 cusecs ( 1.5 mgd).
Present availability of water
At present the city has access to 87 MGD of water which includes 20 MGD from 200 tube wells and 6 MGD and 3 MGD water share of Haryana and Chandimandir respectively.
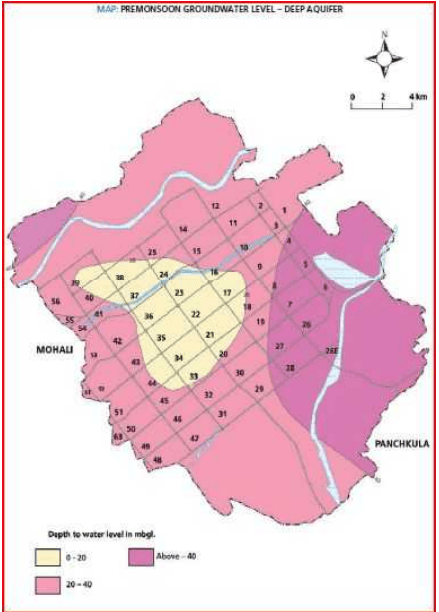
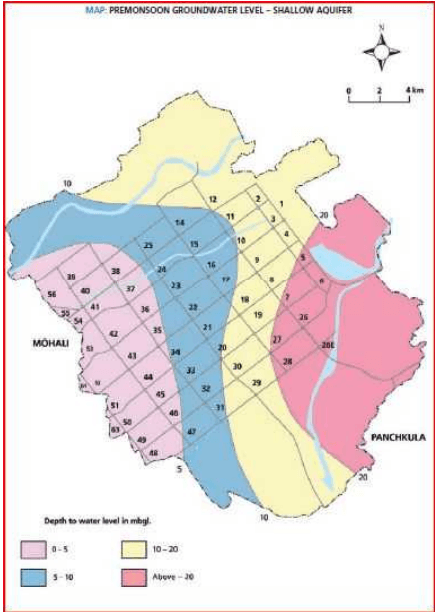
The city taps groundwater from the deep confined aquifers, which do not get naturally recharged. Hence recharging these aquifers is a must. At present Chandigarh is pumping out more water from its aquifers than is being recharged. However, the city not only has a declining deep water table but also has a rising water table in shallow aquifers in the southern sectors creating problems and water logging conditions as per Plan for shallow acquifers at P2 and deep acquifers at P3. (Source: Rainwater harvesting plan for Chandigarh, Centre for Science and Environment, New Delhi, 2011).
To meet the city’s future requirements of water, under JNNURM, Government of India had approved Phases V & VI of water supply scheme from Kajauli. The Punjab Government had initially agreed to release 40 mgd raw water out of which U.T’s share was to be 29 mgd. However, Government of Punjab now wants to use this water exclusively for Mohali area themselves and yet another phase of bringing more water to Kajauli is being negotiated.
With continuously increasing demand for water and uncertainty and disputes plaguing augmentation of canal water supply, Chandigarh needs to develop a comprehensive rain water harvesting plan to ensure long term sustainability of water sources for the city.
Existing Transmission, Distribution and Storage Capacities
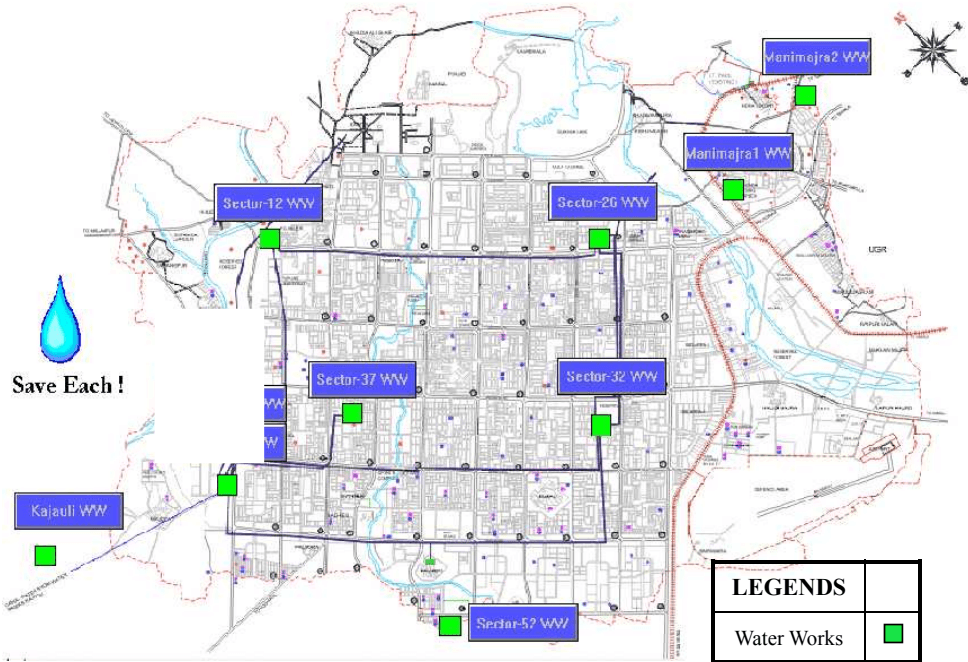
The transmission mains carry water from the raw water source Kajauli, Punjab to the Water Treatment Plant in Sector 39, Chandigarh. The water pumped to the treatment plant is treated, disinfected and stored. This is further pumped to five distribution water works which in turn pump the clear water to the city’s distribution system for use by the consumers. The performance indicators for maintaining the water supply are mentioned at ANNEXURE-P.2.
MAP M1 –
PREMONSOON GROUND WATER LEVEL DEEP ACQUIFERS
MAP M2 –
土
PREMONSOON GROUND WATER LEVEL SHALLOW ACQUIFERS
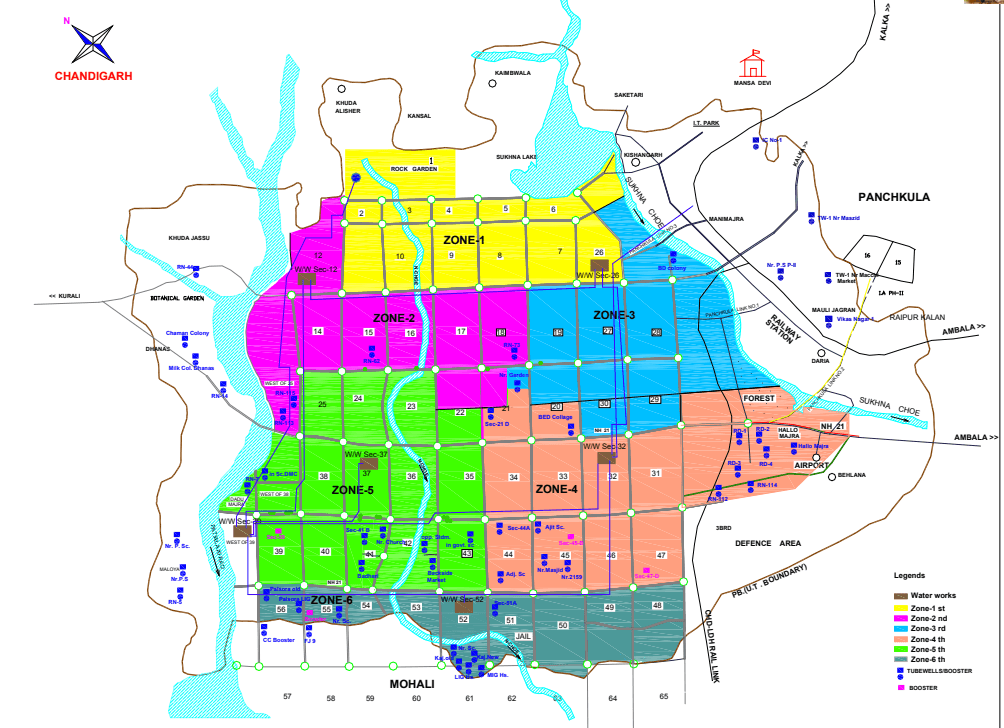
PLAN P1 - ZONING PLAN OF WATER SUPPLY DISTRIBUTION
土
PLAN P2 - WATER WORKS LOCATION PLAN
土
Distribution of water supply in Chandigarh and Manimajra
The city has been divided into 7 zones for the purpose of distribution including the town of Manimajra. The zoning of the city has been done keeping in view the north to south slope of the land. Each zone has a headwork named after its sector. A plan showing the location of tube wells and boosters in the city is at Plan 3 and the plan showing the water supply network is at Plan 4.
Manimajra area
Manimajra is mainly dependent on tubewells for water supply. The two water works at Manimajra are fed by 25 tubewells and canal water from Sector 26 Waterworks ,Chandigarh.
Recycling of waste water
The Government of India has agreed to the proposal of Chandigarh Administration for recycling of treated wastewater. Institutions like PGI, colleges, schools, technical institutions and Punjab University have been asked to disconnect the potable water supply from irrigation of lawns and obtain connection of tertiary treatment water to save precious potable water. The Municipal Corporation has received good response to the proposal. Accordingly, MC has executed a project under JNNURM for supply for treated tertiary water having biochemical oxygen demand (BOD) less than 10 mg/l. Further efforts are being made to utilize tertiary treated water in all green belts and houses having area of over one kanal (500 square yards).
10.3Sewerage System
Sewerage Network
The first phase (sector 1-30) of Chandigarh’s sewerage system was laid during 1952 to 1965, the second phase (sector 31 to 47) from 1965 to 1976 and the third phase from 1976 onwards. There are separate sewer and storm water drainage systems in Chandigarh. The sewerage and storm water is discharged by gravity flow due to good natural slope from north east to south west. The slope also helps the sewers to be naturally cleaned due to the good self cleansing velocities. There is a well organized network of main and branch sewerage drains. The egg shaped brick trunk sewers offshoot into 18 inches dia stoneware pipe branch sewers of each sector at major junctions of V3 roads. The main sewage runs from west to east with inter connection of sewer line from south to north. No pumping is involved because of the city’s topography. The length of stoneware sewage pipe network is 742 km. The population catered to by the sewerage system is 95%.
Quantum of sewage generation
At present 65.25 million gallons of sewage is generated per day in Chandigarh. Out of this, 45 MGD is treated at sewage treatment plant (STP) at Diggian, Phase X1 Mohali and the remaining at Raipur Khurd (1.25 MGD), Raipur Kalan (5 MGD), 3 BRD (5MGD), Sector 47, Chandigarh. Another I0 MGD STP is under construction at 3 BRD. After commission of this STP, total sewerage generated will be treated upto required standards.
10.4 POWER SUPPLY POSITION
土
Union Territory of Chandigarh came into existence with effect from 01.11.1966 after re-organization of erstwhile state of Punjab. The Local distribution of electricity in Chandigarh was taken over by the Chandigarh Administration, from the PSEB on 2nd May, 1967 and is responsible for distribution of power supply up to consumer’s door-step for making quality and continuous power supply available to each and every resident.
The UT of Chandigarh has no power generation of its own and the power requirement is met through firm share as well as unallocated quota from the Central Generating Stations. At present, UT Chandigarh has availability of power of approximately 200-270 MW of power from Central Generating Stations during different hours against the present summer demand of 275-350 MW. Accordingly, to meet with the demand gap, the Electricity Department is purchasing additional power from open market/ banking arrangement/ power exchanges.
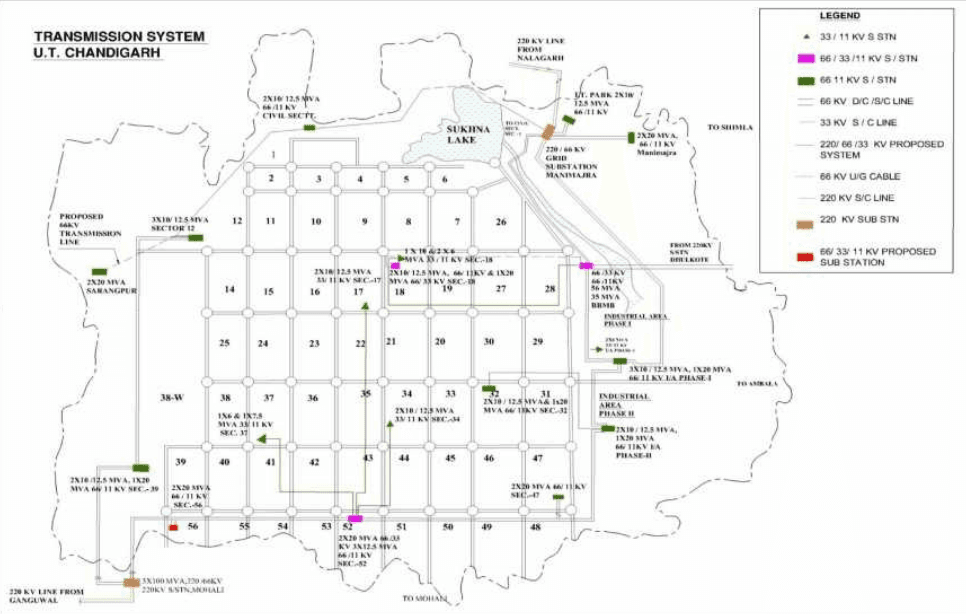
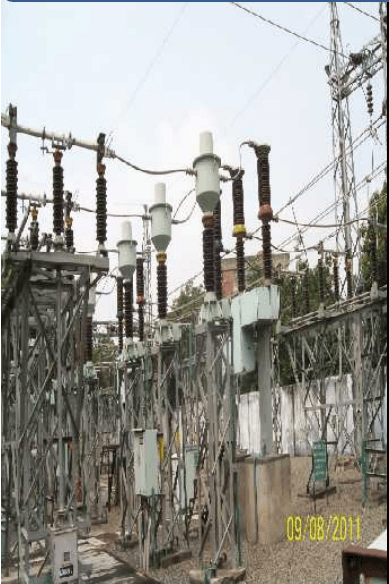
UT Chandigarh has been working towards expanding and strengthening its power infrastructure to meet the increasing consumer demand in various sectors of the economy and presently it has one 220 KV Sub Station,13 -66 KV Sub Station, 5- 33 KV Sub Station, 1813- 11 KV indoor and pole mounted Sub Station, 54 Kms. of double ckt. 220 KV lines, 103 Km. of 66 KV line, 28 Km of 33 KV line, 860 Km of 11 KV lines and 1234 Km of LT lines.
Per capita consumption of electricity in the UT Chandigarh has increased from 253 Kwh in 1967-68 to 1068 Kwh in 2009-10 against the national figure of 700 Kwh and accordingly electricity consumption has increased from 1.38 LU per day to 66 LU on a particular day.
The total transformation capacity in 1967-68 was 15.6 MVA which has increased to 636 MVA.
The number of consumers in 1967-68 was 27821 which have been increased to approximately 2 Lakhs.
The present connected load is 1136 MW.
The peak power demand in 1967-68 was approximately 14 MW which has been touched to 350 MW during this year i.e. on dated 21.06.2012. The T&D loss in 1967-68 was 25 % which has been reduced to approximately 17%.
The number of employees in 1990-91 was 1540 which has been presently decreased to 1085 against the sectioned post of 1790 numbers. The units purchased in 1967-68 were 57 MUs which has been increased to approximately 1682 MU. The units billed in 1967-68 were 43 MUs which has been increased to approximately 1300 MU. The revenue realization in 1967-68 was Rs 0.84 Cr which has been increased to approximately Rs 530 Cr.
To meet with the growing demand of power, the power purchase agreements have been tied up with future upcoming thermal/ hydro power plants. Load flow studies are being got conducted to strengthen the distribution infrastructure and two 220 kV sub-stations and six 66 kV sub stations are under planning.
To reduce the T&D loss further, R-APDRP programme of Government of India/Ministry of Power is being implemented and the work will start shortly.
Further, the working of the Electricity Department is being regulated by JERC. The first two ARR for the FY 2011-12 and
FY 2012-13 have been filed and the same have been approved by the JERC and stands implemented.
Gas based energy source to be tapped in view of land / space constraints
SCADA based power monitoring of street lights .
11 KV and 66 KV lines to be laid underground in future and existing overhead lines to be made underground .
PLAN P3 - EXISTING POWER MAP OF CHANDIGARH
Chandigarh Electricity Department
TABLE T1 - NETWORK SUMMARY
土
POWER SYSTEM INFRASTRUCTURE
Sr.No.
Equipment Particulars
1990-91
2001-02
2011-12
Anticipated requirement2029-30
1
220 KVS/Stn.(Nos.)
0
1
1
3
Transformation capacity(MVA)
0
100
200
800
2
66 kVS/Stn. (Nos.)
5
8
13
20
Transformation capacity(MVA)
218.5
318.5
616
916
3
33 kVS/Stns(Nos)
5
6
5
0
Transformation capacity (MVA)
71
112
120
0
Chandigarh Electricity Department
TABLE T2 - 18th ELECTRIC POWER SURVEY FORECAST (as per CEA)
土
ENERGY CONSUMPTION, ENERGY REQUIREMENT AND PEAK LOAD
Consumption Categories
2009-10
2010-11
2011-12
2012-13
2013-14
2014-15
2015-16
2016-17
2017-18
2018-19
2019-20
2020-21
2021-22
Domestic
472
506
539
571
606
643
682
723
767
813
862
914
970
Commercial & Misc
382
401
426
452
479
508
539
572
607
643
683
724
768
Public Lighting
15
15
15
15
16
16
16
17
17
17
18
18
18
Public Water Works
0
0
0
0
0
0
0
0
0
0
0
0
0
Irrigation
1
1
1
1
1
1
1
1
2
2
2
2
2
Industries LT
137
146
153
161
169
177
186
195
205
215
226
237
249
Industries HT
141
146
155
164
174
184
195
207
219
233
246
261
277
Bulk Supply
89
94
98
103
108
114
120
125
132
138
145
153
160
Total (Energy
1238
1309
1387
1468
1553
1643
1739
1841
1948
2062
2182
2309
2444
Consumption)
Chandigarh Electricity Department
Central pollution control board’s sponsored demonstration project
The Central Pollution Control Board has allotted one demonstration project to the Municipal Corporation of Chandigarh for the management of Municipal Solid Waste and to demonstrate implementation of Municipal Solid Waste (Management & Handling) Rules, 2000.
The following 3 important components are not covered under the Demonstration Project:
1. Disposal of domestic hazardous waste
The practice of disposal of hazardous household waste like used batteries, pesticides etc. along with solid waste is contrary to the provisions of the rules which inter-alia state that separate arrangements should be made for the disposal of hazardous household waste in the prescribed scientific manner to protect the environment.
E-waste facility by DOST.
2. Disposal of slaughter house waste
The Municipal Corporation Chandigarh is according top priority for the collection and transportation of waste from the slaughter house, meat market and fish market etc. due to its peculiar nature. At present the waste from these places is dumped along with other municipal solid waste leading to problems. Biomethanation plant also exists in slaughter house.
3. Disposal of carcasses
At present the disposal of dead animals is being done at 2-3 open spaces, which is creating unhygienic conditions and is also inviting public criticism.
It has been observed that undeveloped fringe areas of the city village hinterland, and areas along the choes are being used as dumping grounds.
A site measuring 1 acre has been finalized for carcasses near garbage processing unit in Dadumajra.
10.6 MASTER PLAN PROPOSALS
土
Water Supply
The following provisions shall be made for augmentation of water supply:
Providing Supervisory Control and Data Acquisition (SCADA) System & upgradation of water supply structures.
Conservation of drinking water by harvesting treated sewage upto tertiary level and using it for horticulture.
Proposals for water conservation & increasing water security use of re-cycled water
The use of potable domestic water shall be restricted to kitchen uses including drinking, bathing and washing clothes. Recycled water, should be used for non-potable uses such as watering parks, gardens landscapes, golf courses, use for construction, industrial process, flushing, washing roads etc.
Use of recycled water will be compulsory for all non-potable uses for all large buildings with an area of more than 2000 sq. m. in all new developments. If such water is not supplied by the MC then the building should set up its own water treatment plant within its premises for reuse of waste water.
All apartments or group housing complexes with more than 20 tenements and commercial, institutional and industrial complexes with an area of more than 2000 sq.m should make plumbing and infrastructure provision for enabling localized sewage treatment, use of recycled water for flushing, washing and for watering gardens.
Implementation
All building plans and land development plans with an area of more than 2000 sq. m. now have to indicate the onsite wastewater treatment and disposal arrangements and water reuse infrastructure including the plumbing plans etc. Separate systems have to be provided for sewage and sludge treatment to facilitate reuse of sludge water for gardening and washing purposes. This may require suitable storage facilities that are to be indicated on the building plans.
Reduce consumption of water
Consumption of potable water in all new buildings can be reduced by using water efficient fittings. At least 25% reduction in water consumption can be achieved from all sources.
Implementation
Replacement of old flush toilets and faucets with new low-flush and water efficient taps, shall be phased in through rebates in water bills and then made mandatory. To start with public institutional buildings and large commercial buildings such as malls shall be targeted.
10.5Solid Waste Management
Existing solid waste management in Chandigarh
The garbage is collected in small cycle carts during road sweeping by the safaiwalas of the corporation and is collected from house to house in large cycle carts. The collected waste is deposited in community Sehaj Safai Kendras from where it is transported to the dumping ground regularly through hydraulic fitted vehicles. In response to protests against the smell and poor maintenance of Sehaj Safai kendras, the corporation recently attempted to change the system. This, however, got stalled by protests of the sweepers working on contract.
Treatment of garbage with solution and dumping of disposal
The city Corporation has earmarked 45 Acres of low lying land situated in the west of Sector 38 near Dadumajra rehabilitation colony where the garbage is disposed of through ‘Land-Filling’. Government of Punjab has been requested to identify 100 acres for a new dumping ground.
Garbage processing unit
MC has set up a Garbage Processing Unit based on ‘pelletisation’ technology as a joint venture with M/s Jaiprakash Associates Limited on 10 acres of land for the processing of Municipal Solid Waste of the city on BOOT basis.
Peak Load(MW)
308
321
336
353
370
388
406
426
450
475
501
529
559
Augmentation of Water Supply Scheme Phase-V & VI.
Replacement of old distribution pipe lines of Phase-I sectors.
Recharging Deep Aquifers.
1 & 2 have already been approved by Ministry of Urban Development after finalization of City Development Plan and are under execution.