The UT of Chandigarh is a uni-district territory which came into existence on 1st of November, 1966 with an area of 114 sq. kms.
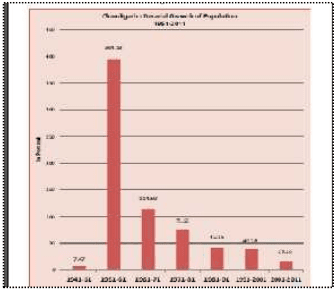
During the last 6 decades (1951-2011), Chandigarh has witnessed a population increase of more than forty four times with the absolute population increasing from 24,261 in 1951 to 10,54,686 in 2011.
As per Census 2011, the population of Chandigarh U.T has crossed the one million mark with its population placed very close to that of the state of Mizoram (10,91,014). The Union Territory recorded a population of 10,54,686 in 2011 with much lower decadal rate of increase in population with only 154051 people being added to the Chandigarh UT during the last decade.
The growth rate of merely 17.10% between 2001-2011 is the slowest since its inception. This is perhaps due to the rapid pace of urbanization taking place in the neighbouring towns of Mohali, Panchkula, Zirakpur, Kalka, Kharar, etc. falling within the 16 km periphery control area.
The details of the total population, decadal absolute growth and decadal growth rate are given in Table D1.1 below:
TABLE D1.1POPULATION GROWTH 1951 -2011)
Year
Total Population
Decadal Absolute variation of Population
Decadal Growth Rate(in%age)
1951
24261
-
-
1961
119881
95620
394.13
1971
257251
137370
114.59
1981
451610
194359
75.55
1991
642015
190405
42.16
2001
900635
258620
40.28
2011
1054686
154051
17.10
Source – Census of India
5.2
土
Rural –urban Composition
The U.T of Chandigarh has essentially become one territory with the urban settlements of Chandigarh and Manimajra occupying a major part of its 114 sq.km area.
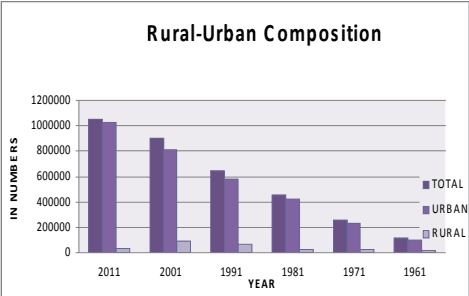
As per the census of 2011, 10,25,682 (97.25%) of its population was urban and 29,004 (2.75%) was rural as compared to 82.80% urban and 17.20% rural in the year 1961. The details are at Table D1.2a.
TABLE D1.2a
5.3Density
The population density during the last 5 decades (1961-2011) has increased 9 fold, from 1051 to 9252 persons per sq. km.
The density of the city doubled during 1961-71, when it increased from 1051 persons per sq. km to 2257 persons per sq. km. It went on increasing rapidly in subsequent decades with 3961 persons per sq. km in 1981, 5632 persons per sq. km in 1991 and 7900 persons per sq. km in 2001. With the latest census data becoming available, the density recorded for the Chandigarh UT is now placed at 9252 persons per sq. km in 2011.
Chandigarh shall continue to record higher densities with further population growth , which poses a challenge for maintaining the quality of life and providing basic & essential services even to its poorest residents as visioned by the city’s planners.
5.3.1 Sector Wise Distribution of Population & Density & the UT’S Holding Capacity
Detailed analysis of the holding capacity of each sector based on the number of existing or planned dwelling units and their population as per the 2001 census has been done. This is shown in Table D1.3 (see Annexure Page 7).
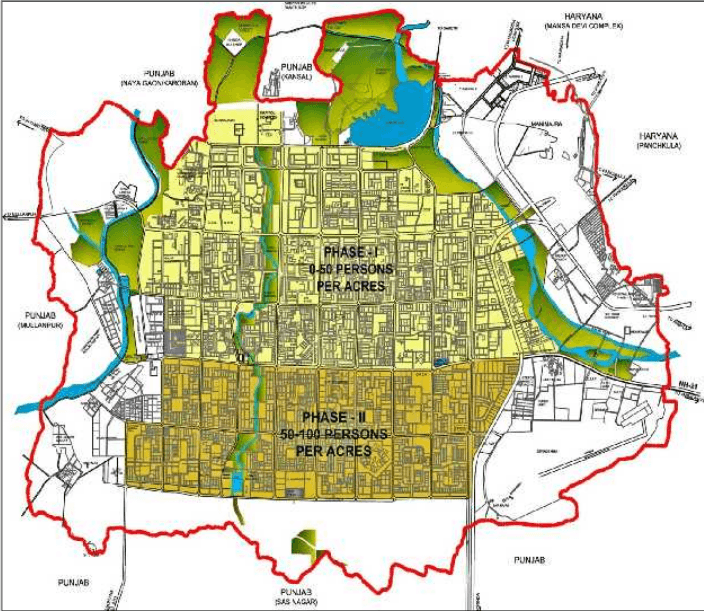
Further assessment of population density has also been done for different phases of the city’s development i.e. Phase I comprising of Sectors 1-30, Phase II comprising of Sectors 31-47, and Phase III with sectors 48-56, 61 and 63.
5.3.2 Densities AS Per Original Plan
The capital city of Chandigarh was planned for a differential pattern of density to accommodate a total population of 5 lakhs. Phase I was planned to be low density development with 9000 acres of land housing 150000 population.
Phase II was planned for higher density with 6000 acres of land accommodating 350000 people.
5.3.3 Prevailing Densities AS Per 2001 Census
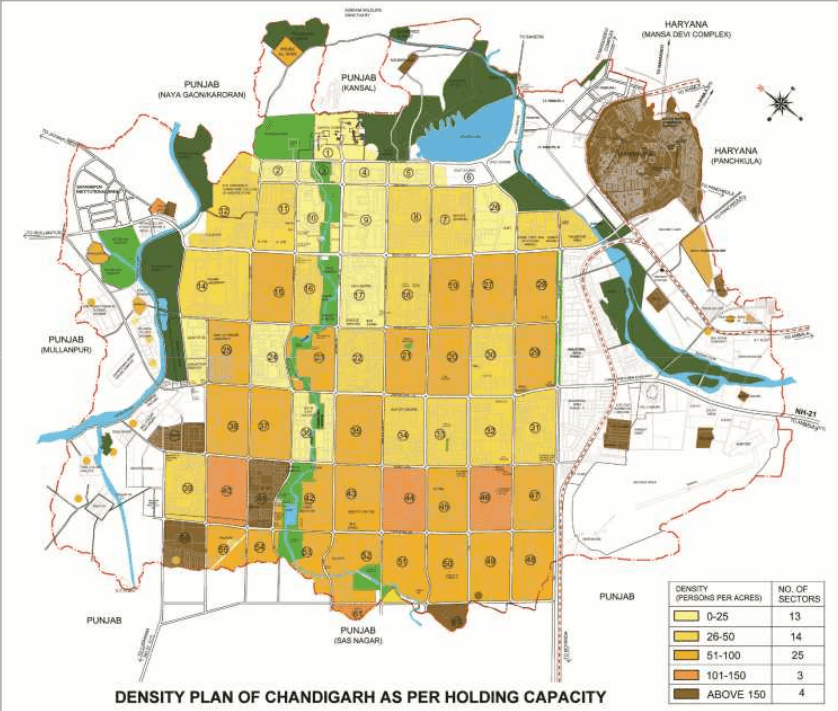
The prevailing density of Phase I of the city as per the 2001 census was 26, whereas for Phase II, it was 60 persons per acre. The density of Phase III (which was added subsequently), has been proposed as approx. 100 persons/acre.
Thus, by 2001, the density of Phase-I had already exceeded the design density when that of Phase-II sectors was the same as was designed. The city however, still has reasonable capacity to accommodate additional population.
5.3.4 Density AS Per Holding Capacity / Projections
As per the population worked out for the city on the basis of its holding capacity, the density of Phase I is estimated to be 34 persons per acre (more than double the planned density), 83 persons per acre for Phase II and 100 persons per acre for Phase-III sectors.
It can be seen that as against the planned population of a sector varying from 15000 – 25000, large variations in population at the sector level have been observed with the highest population of 41,077 being recorded in Sector 45, and the lowest population of only 1 being recorded in Sector 63.
The highest population in Phase I sectors was recorded in Sector 20 was 22,138, whereas in Phase II (31-47), the position is occupied by Sector 45, with a population of 41,077.
TABLE D1.2DENSITY FOR PHASE I, II AND III BASED ON CENSUS 2001 AND HOLDING CAPACITY
Phase
Planned Density(persons/acre)
Density as per Census 2001 (persons/acre)
Density as per Holding Capacity(persons/acre)
I-Sector1to30
16
26
34
II-Sector31to47
59
60
83
III-Sector48t056, 61,63
-
Under process of development
100
The density pattern is likely to undergo considerable change in the years to come with the city recording higher growth and development. As per existing trends, the sectors falling in Phase I shall continue to have lower density as compared to the sectors falling in Phase II.
The highest population density will be in the sectors falling in Phase III due to group housing and large scale rehabilitation of the population of unauthorized settlements in these sectors. As per the density calculated according to the holding capacity it can be mentioned that the higher densities will be in Manimajra (161 PPA), Sector 38 West (211PPA), Sector 63(195 PPA) and in Rehabilitation colonies at Ram Darbar (157 PPA). The detail of area and densities for Rehabilitation Colonies is at Table 1.3 (a)
PLAN D1 – DENSITY PATTERN IN SECTORS (AS PER ORIGINAL PLAN)
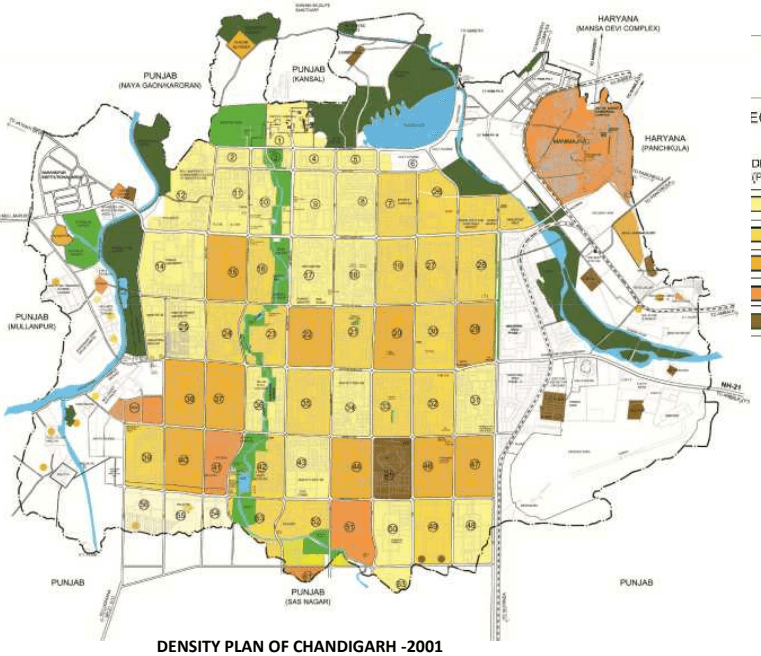
PLAN D2 - DENSITY PLAN OF CHANDIGARH (AS PER CENSUS -2001)
土
EGEND:
DENSITY(PERSONS PER ACRES)
NO. OF SECTORS
0-25
26
25-50
18
50-100
10
100-150
3
ABOVE 150
1
DENSITY PLAN OF CHANDIGARH -2001
PLAN D3 - DENSITY PLAN OF CHANDIGARH (AS PER HOLDING CAPACITY)
土
DENSITY (PERSONS PER ACRES)
NO. OF SECTORS
0-25
13
26-50
14
51-100
25
101-150
3
ABOVE 150
4
5.4SEX Ratio
As per the provisional population figure of 2011, Chandigarh U.T. recorded a population of 10,54,686 out of which 5,80,282 are male whereas remaining 4,74,404 are female.
As per Census 2011, compared to the all India figure of 940, Chandigarh has recorded a sex ratio of 818. Chandigarh recorded a sex ratio of 777 in the year 2001 as compared to the national average of 933.
The Table D1.4 (see Annexure Page 13) gives the prevailing sex ratio in Chandigarh and in India during the period 1961-2011. The sex ratio has gradually increased over the years except in 2001, when it showed a marginal decline. The distribution of population by age group/sex has been shown in Table 1.5 (see Annexure Page 13).
5.5 Literacy Rate
Chandigarh has always recorded a high literacy rate since its inception due to the high quality of educational infrastructure available in the city. As per Census 2011, 8,09,653 persons were literate in the U.T, indicating a literacy rate of 86.43% ( see Table D1.6 (see Annexure Page 14).
5.9Decadal Growth Rate of Haryana Portion
Due to establishment of various special government projects of HMT, ACC Cement Factory, Chandimandir Cantonment, Indian Tibet Border Police Complex, CRPF Complex, Terminal Ballastic Research Laboratory and Panchkula Town, this periphery area has undergone tremendous socio-economic and physical development. Further the development of infrastructure like roads, electricity and rapid transportation facilities, induced large scale immigration from other areas to this region. The population in the periphery area of Haryana has increased manifold in the last three decades. Table D1.12 (see Annexure Page 16) shows the projected population of the Haryana portion of periphery controlled area upto 2021.
As apparent from the above projections, the total population of the periphery controlled area would be 14,23,000 in 2021, when projects of Panchkula Extension & Shree Mata Mansa Devi Urban Complex get completed and urbanization in the area adjoining Kalka & Pinjore take place. Accordingly, the urban population would be 65.00%, 75.00% & 85.00% of the total population in the corresponding years of 2001, 2011 & 2021 respectively. The total urban population would be 1209550 in 2021.
5.6Economic Activity
The majority of workers in the UT are employed in fields other than cultivation, agriculture, household industry etc. From Table 1.7 (see Annexure Page 14), it is observed that proportion of cultivators, agricultural labourers, household industry workers and other workers to total workers are 0.6%, 0.2%, 1.1% and 98.1%.
Future Population Projections
In order to have a realistic assessment of the future population, the population estimates have been based on the following four methods.
Population projections made by the technical group on population projections constituted by Registrar General, Census of India
Population projections based on accepted methods of population projections.
Population projections made by various agencies.
Population projections based on the holding capacity.
5.7.1 Population Projections Made by the Census of India
The Technical Group set up by Census of India has made projections for Chandigarh’s population for the period 2011-2026 (Table 1.8 (see Annexure Page 14). As per the table, Chandigarh will have a population of 14,38,000 in the year 2011, 22,26,000 in 2021 and 25,18,000 in the year 2026. These projections are based on assumed growth rates of 59 .67% for the period 2001-11, 54.80% for 2011-21 and 13.12% for 2021-26. However, the actual population in the year 2011 is 10,54,686 which is much lower than the projected population by the Technical Group.
The prime reason for variation is the difference in actual and projected growth rate of the Chandigarh U.T recording the lowest decadal growth rate of 17.10% in its history as against the 59.67% projected by the technical group. Accordingly, even the future population projections for Chandigarh shall be much lower compared to the projections made by the technical group.
5.7.2 Population projections based on four accepted methods
Population projections for Chandigarh U.T. have also been made by the Arithmetic Progression Method, Exponential Method, Incremental Increase Method, and the Geometric Progression Method as shown in Table 1.8. As indicated in the table, there are large variations in the projected population using different methods. In order to remove the abnormalities/large variations, law of averages has been made applicable. The table showing population projections made by the Census of India is at Table 1.9 (see Annexure Page 14).
Population Projection of Chandigarh UT by Various Methods
Sr. No
Method
2011
2021
2031
1
ArithmeticProgression
1054686
1241647
1428608
2
GeometricProgression
1054686
1474694
2061962
3
IncrementalIncrease
1054686
1272457
1521039
4
Exponential
1054686
1882540
3360200
Average
1054686
1467834
2092952
5.7.3 Population Projections Made by Various Agencies
Taking various population projections into account, it will be realistic to assume that Chandigarh UT will have a population of 13.5-14.5 lakhs by the year 2021 & 15-16 lakhs by the year 2031.
5.7.4 Holding capacity of UT Chandigarh based on Master Plan recommendations
Population for the Chandigarh U.T has also been projected based on the holding capacity of the area. Holding capacity of the city has been worked out based on the following :
• Number of plots carved out for government housing,
Residential plots made available to the residents for constructing houses,
Number of plots and dwelling units made available by the Chandigarh Housing Board,
Dwelling units created in re-habilitation colonies,
Population of Manimajra in 2011.
Housing in the villages falling in the U.T.
Population living in unauthorized settlements.
Holding capacity of vacant areas in Phase III sectors and the periphery.
• Para-military personnel housed in the area.
Based on the above, the total holding capacity of the U.T of Chandigarh has been worked out as 15.52 lakhs as detailed in Table 1.10 (see Annexure Page 15). While it may not be possible to make an accurate forecast, the expectation is that the UT’s population will range between 15-16 lakhs, by 2031 for which the provision of necessary infrastructure should be planned.
In order to maintain the basic character of Chandigarh as an administrative city, unnecessary increase in the population should be avoided. With the coming up of new towns in the periphery in Punjab and Haryana, the excess population can be easily accommodated in those towns. Moreover since the land stock in Chandigarh is limited, the uses related to governance and administration should get priority in the allocation of land. It will be prudent to look at the city and the union territory based on the holding capacity indicated above with population restricted to 15.5 lakhs. Additional population will have to be diverted to the adjoining settlements by viewing the entire context of planning in the regional framework. However, continuous monitoring of population every 5 years will be desirable in order to rationalize the distribution of population. It will be prudent to consider that population for the area falling in the sectors should not exceed one million.
TABLE 1.10HOLDING CAPACITY OF UT CHANDIGARH BASED ON MASTER PLAN RECOMMENDATIONS
Sr. No.
Category
Total Units
Existing Population
Maximum No. of Dwelling Units
Holding capacity
1
Government Plots
24330
-
29925
111116
2
Private Plots
22788
-
22788x3=68364
293965
3
Chandigarh Housing Board
Plot
2255
2255x3=6765
29090
Unit
30698
-
30698
132001
4
Others
28963
-
28963
124541
5
Rehabilitation Colonies
61525
-
61525
264558
6
Unauthorized Colonies to be Rehabilitated
20911
69047
69000
7
Villages
-
84235
117929
8
Manimajra
-
117046
136943
9
New residential areas
-
-
200328
10
Paramilitary
50000
11
Total
1529471
Note: (i) Average family size for calculating holding capacity has been taken as 4.3. (ii) In case of sectors 6,12,17,26E,53& 54 existing population in 2001 has been included in the holding capacity. (iv) Private plots availing additional FAR / DU's
Adjustment of Proposed Population in Chandigarh City
1
Sectoral Grid
Sectors
Projected Population
Phase I
1 to 30
270086
Phase II
31 to 47
345945
Phase III
48 to 63
201424
2
Periphery
Pocket 2 near Sarangpur
7500
Pocket 7 nearMaloya
45000
Chandigarh Armed Police Complex
6500
3
Others
Rehabilitation Colonies
264558
Villages
117929
Manimajra
136943
Unauthorized Colonies to be Rehabilitated
69000
Paramilitary
50000
Total
1529471 Say 16lac
* The Population of sectors 48 to 63 has been calculated with a Gross Density of 100 PPA
Decadal Growth Rate of Gmada Region (punjab)
The growth in Mohali’s population and its emergence as a part of the tri-city comprising Chandigarh, Panchkula and Mohali started in the seventies. The population of Mohali (then a village) was only 1229 in 1971 but grew by about 39% per year during the period 1971-81 to reach 32,351 in 1981. Though the rate of growth in Mohali’s population has declined after 1981 due to a larger base population, it has remained high at over 9% per year during 1981-91 and over 4.5% per year during 1991-2001. The decadal growth rate of other towns in the region is given in the Table D1.11 (see Annexure Page 16).