Understanding the existing housing trends and situations is necessary to analyse gaps and propose housing strategies to address those gaps. It is clear that most of the Planning Area is currently rural, but the economic transition will lead to urbanisation within the Planning Area. Following sections cover the details of the existing population and household as well as its growing trends.
Summary of Existing Population and Household
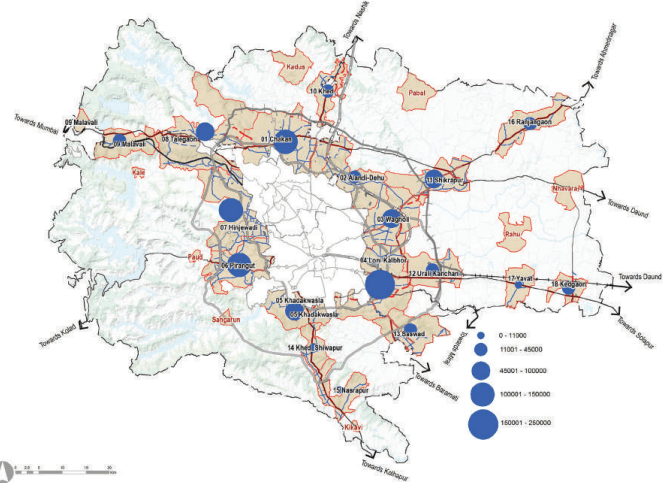
The PMR Study Area population increased from 13.4 lakh in 2001 to 17.1 lakh in 2011. It was estimated to be 26.3 lakh in 2018 and amounts to 28.6% of the total PMR population (91.67 lakh). Population density of the Planning Area has increased from 217 persons per sq km in 2001 to an estimated density of 329 persons per sq km in 2018.
As per the 2011 Census, the total household in the Study Area was 366,954 units. This is estimated at 608,009
household units by 2018 by considering the population of sanctioned ITP schemes, TPS and layouts. The Household size of the PMR Study Area is estimated to be 4.4 in 2018, a reduction from 5.12 in 2001. The existing number of households in 2018 for Growth Centres is 3,98,287 while for the rural area it is 2,04,451.
Existing Housing Situation
Residential Land Use occupies 80.83 sq km as per ELU data. It is scattered across the Study Area, whereas distribution becomes denser in the fringes (3 to 5 km) of municipal corporations and along the Pune-Mumbai and Pune-Ahmednagar Corridors.
Based on the building permissions data it is observed that five talukas namely Haveli, Khed, Mawal, Mulshi and Shirur has a dominant 98% share of the total built-up area under sanctioned residential layouts with Haveli covering 52% of the built-up area followed by Mulshi with 28% built-up.
Approved Residential layouts in PMRDA are predominantly located along the Pune-Mumbai and Pune-Ahmednagar transit corridors. They are also seen in pockets between the national highway and railway lines of Pune-Mumbai and Pune-Daund. Khed Rajgurunagar, Talegaon Dabhade, Shikrapur, Talegaon Dhamdhere, Nasarapur serve as residential areas for nearby industrial estates.
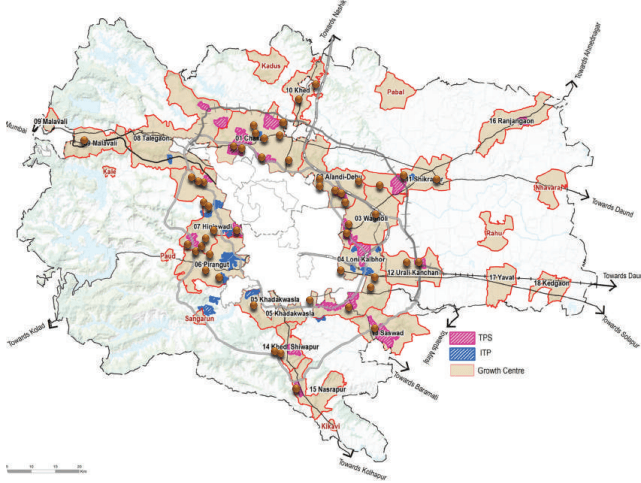
Other planned Residential areas in PMR are Integrated Townships and Town Planning Schemes. Townships are predominantly coming up in the western part of the Planning Area, most of them coming up within 10 km radius from municipal limits of Pune and Pimpri Chinchwad. Town Planning Schemes are predominantly located in the eastern part of the Planning Area. Table 17.2 and Table 17.3 give the details of these TPSs and ITPs as per respective TPS Reports.
| Sr. No. | TP Scheme <sup>P</sup> <sub>Ar</sub><sup>M</sup><sub>e</sub> | aRD (hAa N) otified Popu | lation PMRDA Hous | ehold GC |
|---|---|---|---|---|
| 1 | Mahalunge Man TPS | 250 | 120,000 | 30,769 Hinjawadi |
| 2 | WadachiWadi TPS | 134 | 84,000 | 21,538 Loni Kalbhor |
| 3 | Autade Handewadi TPS | 94 | 54,000 | 13,846 Loni Kalbhor |
| 4 | Holkarwadi TPS 04 | 158 | 103,000 | 26,410 Loni Kalbhor |
| 5 | Holkarwadi TPS 05 | 131 | 87,500 | 22,436 Loni Kalbhor |
| 6 | Manjari Kolwadi TPS | 223 | 145,000 | 37,179 Loni Kalbhor |
| 7 | Wagholi TPS | -991 | -593,500 | Wagholi152,179 |
| Sr. No. | ITP & ST | GIS Area (ha) | Population Project-ed | Household | GC |
|---|---|---|---|---|---|
| 1 | River View (Mahalunge) | 44 | 10,909 | 2,797 | Hinjawadi |
| 2 | Knowledge City & Oxford Golf course | 331 | 82,865 | 21,247 | Pirangut |
| 3 | XRBIA Hinjawadi | 123 | 30,837 | 7,907 | Hinjawadi |
| 4 | Life Republic | 161 | 40,329 | 10,341 | Hinjawadi |
| 5 | Forest Trail | 78 | 19,416 | 4,978 | Pirangut |
| 6 | Blue Ridge Hinjawadi | 44 | 11,119 | 2,851 | Hinjawadi |
| 7 | Nanded City | 261 | 65,181 | 16,713 | Khadakwasla |
Chapter 17: Self Sufficient: Housing and Amenities Proposal
| 8 | Sanjivani Integrated township- Urse & Adhe | 103 | 25,845 | 6,627 Talegaon |
|---|---|---|---|---|
| 9 | Solitaire - Manjari | 44 | 11,006 | 2,822 Loni Kalbhor |
| 10 | Riverview City-Kadamvakwasti | 216 | 54,094 | 13,870 Loni Kalbhor |
| 11 | Kul Ecoloch | 52 | 12,899 | 3,307 Hinjawadi |
| 12 | Sanaswadi | 42 | 10,527 | 2,699 Shikrapur |
| 13 | Kaleidoscope- Bhugaon | 61 | 15,318 | 3,928 Pirangut |
| 14 | Nilkanth- Bhugaon | 100 | 24,905 | 6,386 Pirangut |
| 15 | Gulbakshi- Bhugaon | 69 | 17,287 | 4,433 Pirangut |
| 16 | Splendour Country | 288 | 71,985 | 18,458 RA |
| 2,018 | 504,521 | 129,364 |
The income classification for the PMR Study Area as established under the CTT study is shown in Table 17.4. It is used as the basis for income-based classification of households such as EWS, LIG, MIG and HIG. These income groups are based on monthly income as defined under the MHADA guidelines and are shown in Table 17.4.
| No | Monthly Income | % Share of PMR Study Area | Income Grouping as Per MHADA |
|---|---|---|---|
| 1 | 2,000 - 5,000 | 1% | |
| 2 | 5,001 - 7,500 | 3.5% | |
| 3 | 7,501-10,000 | 9.5% | 55% EWS |
| 4 | 10,001-15,000 | 20.1% | |
| 5 | 15,001-20,000 | 21.1% | |
| 6 | 20,001-30,000 | 20.6% | |
| 7 | 30,001-40,000 | 10.3% | 38% LIG |
| 8 | 40,001-50,000 | 6.6% | |
| 9 | 50,000 - 1 lakh | 6.0% | 6% MIG |
| 10 | Greater than 1 lakh | 0.7% | 1% HIG |
Accordingly, distribution of households by income groups in the Planning Area as of 2017 includes 56% EWS, 38% LIG, 6% MIG and 1% HIG households.