Chapter 10Socioeconomic Analysis - Demographics and Economic Situation Analysis
This chapter and the next chapter cover socioeconomic analysis - analysis of existing socioeconomic conditions and prospects of Pune district and the Study Area. It consists of four parts - (i) existing demographic and economic situation analysis, (ii) regional economic positioning, (iii) economic transition strategy and (iv) projections for populations, households and employment by 2041.
The output of these analyses has guided the formulation of the overall vision for PMR and quantification of gross land quantum for various employment generating uses and residential uses.
This chapter covers the first part - existing demographic and economic situation analysis. The statistical study of demographic indicators helps understand the change in demography and economy of a region. This chapter discusses the spatial distribution of the population residing within the PMR Planning Area analyzed using the ELU database. It elaborates the trend observed in key demographic statistics for the area, population, household size, density, etc. from 1991 to 2011 at PMR Study Area and taluka levels. It will then discuss the economy of Pune district and PMR along with inferences drawn from the economic analysis and end with a summary of key findings.
10.2Demography: Pune Metropolitan Region (PMR)
Pune Metropolitan Region covers 6,914.26 sq km area, which is 44.20% of Pune district’s area. According to Census 2011, the total PMR population is 73,21,367, which is 77.64% of Pune district population. Within PMR, 78.66% of people live in urban areas while the remaining 21.34% population is concentrated in rural areas. Taluka wise summary of settlements under PMR with their population is presented in Table 10.1.
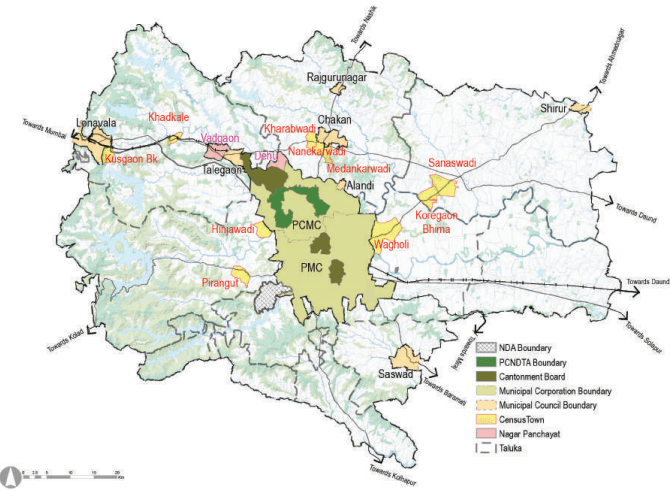
Figure 10.1: Location of settlements in PMR
Source: GIS Database,
Table 10.1Taluka wise Population Distribution across Pune Metropolitan Region - Census 2011
No
Taluka
Urban Population
Rural Population
Total Popula-tion
Percentage of PMR Population
Settlement
Pop. 2011
Settlement
Pop. 2011
Pop. 2011
1
Pune city
PMC
33,71,626(2018)
-
-
35,22,091
48.11
Canton.-2
1,50,465
Total
35,22,091
2
Haveli
PCMC
17,27,692
Villages:104
3,90,949
22,18,556
30.30
Canton.-1
48,961
Census town-1
33,479
Dehu NP
17,475
Total
18,27,607
3
Mawal
Lonavala MC
57,698
Villages:187
2,18,076
3,76,943
5.15
Talegaon MC
56,435
Vadgaon-NP
15,687
Census town-2
29,047
Total
1,58,867
4
Mulshi
Census town-2
25,633
Villages:142
1,44,733
1,70,366
2.33
5
Khed
Alandi MC
28,645
Villages:111
2,59,783
3,89,117
5.31
Rajguru MC
25,146
Chakan MC
41,113
Census town-3
34,430
Total
1,29,334
6
Shirur
Shirur MC
37,111
Villages:66
2,30,264
2,94,034
4.02
Census town-2
26,659
Total
63,770
7
Purandar
Saswad MC
31,821
Villages:38
55,902
87,723
1.20
8
Bhor
-
-
Villages:53
68,320
68,320
0.93
9
Velhe
-
-
Villages:52
26,866
26,866
0.37
10
Daund
-
-
Villages: 51
1,67,351
1,67,351
2.29
Total
Municipal Councils
2,77,969
Total
Nagar Panchayats
33,162
Total
Cantonments
1,99,426
Total (Planning Area)
Census Towns:10
1,49,248
Rural Villages: 804
15,62,244
17,11,492
Grand Total (PMR)
24
57,59,123
15,62,244
73,21,367
100
%
78.66%
21.34%
Source: Census 1991, 2001, 2011
Table 10.2Population of Census Towns - Census 1991, 2001, 2011
No
Taluka
Census Town
Census 1991
Census 2001
Census 2011
1
Haveli
Wagholi
9,004
17,743
33,479
2
Mawal
Khadkale
6,001
9,804
13,435
3
Kusgaon
4,982
8,567
15,612
4
Mulshi
Hinjawadi
2,971
5,407
11,459
5
Pirangut
3,402
6,040
14,174
6
Khed
Kharabwadi
2,059
4,267
9,200
7
Nanekarwadi
1,623
5,112
12,654
8
Medankarwadi
1,708
4,066
12,576
9
Shirur
Koregaon Bhima
4,533
8,999
13,116
10
Sanaswadi
4,407
8,356
13,543
Total
40,690
78,361
1,49,248
Source: Census 1991, 2001, 2011
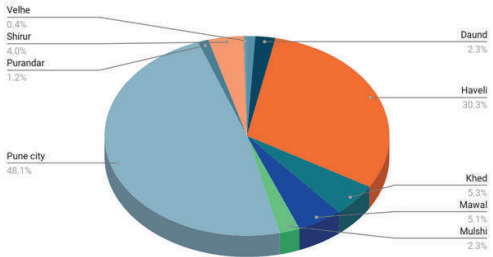
Figure 10.2: Taluka wise Population Distribution across Pune Metropolitan Region - Census 2011
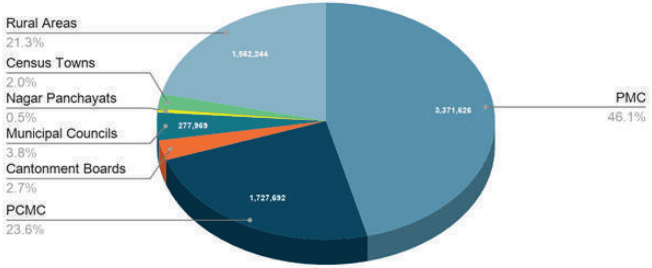
As per Census 2011, PMR population is 73.21 lakh. While PMC and PCMC constitute about 46.05 % and 23.59 % of the total population respectively, cantonments and municipal councils constitute only 2.72 % and 3.79 % respectively. The decadal population growth rate from 2001 to 2011 for PMR was 37.46 %.
Table 10.3Urban-Rural composition in PMR - Census 2011
Urban
Rural
Total
Pop. 2011
%
Pop. 2011
%
Pop. 2011
Pune District
57,51,182
60.99%
36,78,226
39.01%
94,29,408
PMR Total Area
PMC
31,24,458
58.54%
PCMC
17,27,692
30.00%
MC
2,77,969
4.83%
NP
33,162
0.58%
Canto.
1,99,426
3.46%
CT
1,49,248
2.59%
Total
55,11,955
78.66%
15,62,244
21.34%
73,21,367
Source: Census 1991, 2001, 2011
Figure 10.3: Urban-Rural composition in PMR - Census 2011
10.1Methodology
Land Use Planning for Study Area is based on assessment and projections of three key indicators - population, households and employment.
Projections are carried out for 2018, 2021, 2031 and 2041 for planning purposes. Most of the existing statistical information is available at taluka/district/state level, whereas Study Area is defined with villages (814 villages). This necessitated compilation of indicators mentioned above at the village level in the following manner:
Census data (1991, 2001, 2011) provides village wise population, households and employment information. It is used as a base for projecting population, households and employment for 2018, 2021, 2031 and 2041.
There is always a risk of linear projections based on only Census data since it does not capture the effects of major socio-economic disruptions that may occur between Census surveys. To avoid this, two more datasets have been referred to, namely- Directorate of Economics and Statistics (DES) data and Household Survey data collected under the Comprehensive Traffic and Transport Study by PMRDA in 2018.
District level data from Directorate of Economics and Statistics provides the total number of persons employed by economic sectors and by establishments (Report on Sixth Economic Census Maharashtra State 2013-14).
Study Area’s employment data (Census 2011) is projected till 2014 and subdivided into above economic sectors based on sector-wise shares depicted in the Sixth Economic Census of Maharashtra 2013-14.
Numbers have been ratified using sector-wise employment findings from the CTTS Household Survey.
Population projections are carried out for the Study Area and Pune Metropolitan Region separately. Forecasts for the Study Area are based on arithmetic and URGD methods where village wise population, households and employment is projected.
Incremental increase method is used to project population for municipal councils, whereas the projections for PMC, PCMC and cantonments are retained as per CTTS.
Census 2011: PMR Population Share
Table 10.4Population Growth Rate Trends
No1
Sector Pune District
Population
Growth Rate (%)
199155,32,532
200172,32,555
201194,29,408
1991 - 200131%
2001 - 201130%
2
PMC - 2011 (Excluding 11 villages- 2,39,483 and Yewalewadi- 7,685)
15,66,651
25,38,473
31,24,458
62%
23%
PMC - 2018
15,66,651
25,38,473
33,71,626
62%
33%
3
PCMC
5,17,083
10,12,472
17,27,692
32%
71%
4
Cantonments
2,01,017
2,04,359
1,99,426
2%
-2%
5
Municipal Councils and NP
1,62,831
2,32,900
2,99,789
43%
34%
6
Census Towns
40,690
78,361
1,49,248
93%
90%
7
PMR - Planning area (including CT)
10,65,134
13,48,185
17,11,492
27%
27%
8
PMR - Total
37,52,731
53,24,674
73,21,367
42%
37%
Source: Census 1991, 2001, 2011
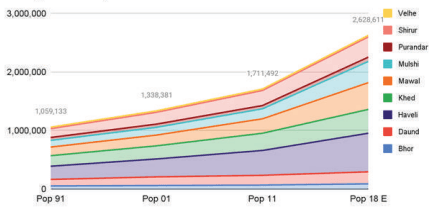
PMR Study Area population has increased from 13.48 lakh in 2001 to 17.11 lakh in 2011 which is 23.61% of PMR population (73.21 lakh) and 18.33% of Pune district’s population (94.29 lakh). Table 10.2 shows taluka wise distribution of Study Area population.
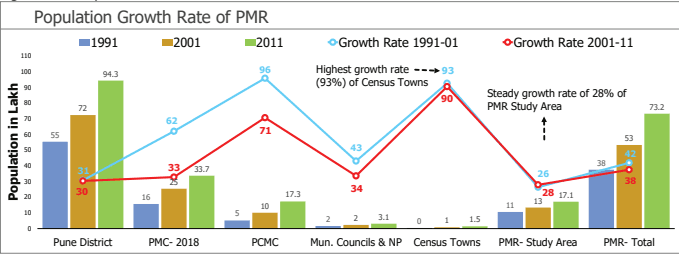
Figure 10.4 : Population Growth Rate Trends
Population Growth
PMR Study Area population growth rate is almost constant from 1991 to 2001 and from 2001 to 2011. This was majorly due to the increasing migration rates, decreasing fertility rates and overall urbanization of the area.
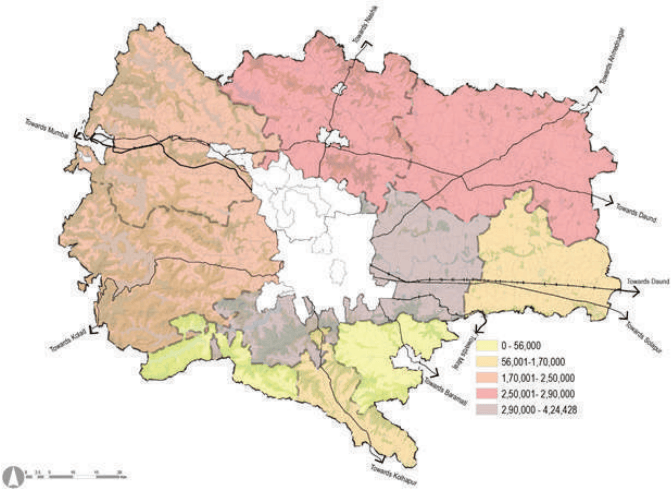
Figure 10.7 shows that talukas in the south (Purandar, Bhor and Velhe) show significantly low growth from 1991 to 2011, indicating out-migration. As shown in Table 10.5, Haveli, Mawal, Mulshi, Khed, and Shirur talukas show high population growth from 1991 to 2011. The population of Haveli taluka has increased from 2,25,453 in 1991 to 4,24,428 in 2011, indicating rapid growth of population in the taluka. This population growth in Haveli is majorly due to its proximity to Pune city, leading to spillover development. PMC Population has grown from 25,38,473 in 2001 to 31,24,458 in 2011 at a decadal rate of 33%, and PCMC Population has grown from 10,12,472 in 2001 to 17,27,692 in 2011 at a rate of 71 %. Compared to PMC and PCMC, the PMR Study Area population has grown from 13,48,185 in 2001 to 17,11,492 in 2011 at a decadal rate of 27 %.
Figure 10.7: Taluka wise population growth in PMR Study area.
Study Area Population Trend
Population Density
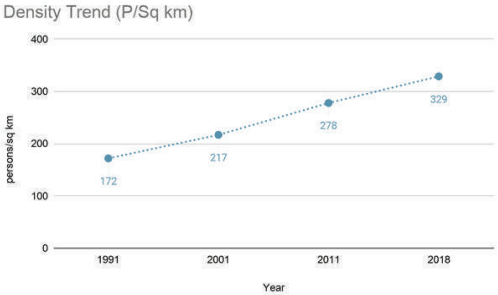
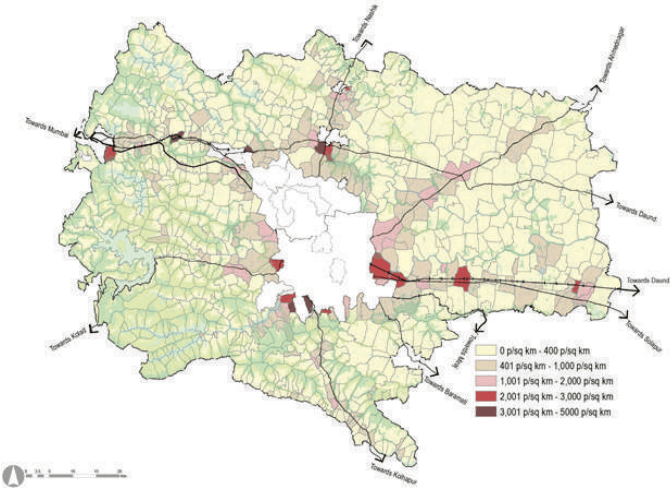
PMR Study Area’s population density has increased from 219 persons per sq km in 2001 to 278 persons per sq km in 2011. This increase in population density is majorly due to the high urbanization of the metropolitan area. Comparatively, the population density of Pune Metropolitan Region (i.e. including Pune urban) is 1,189 persons per sq km and that of Pune district is 602 persons per sq km indicating that PMR is a relatively less dense area.
Figure 10.8: Trend in the population density of PMR Study Area
As shown in Table 10.6, the population density of Haveli taluka has increased significantly from 276 to 520 persons per sq km between 1991 and 2011 due to spillover development from Pune. This is followed by Khed taluka showing an increase in population density from 206 persons per sq km to 337 persons per sq km from 1991 to 2011 due to spillover of development from Pimpri-Chinchwad. There has been little change in Purandar taluka’s population density, with a marginal increase from 171 persons per sq km in 1991 to 192 persons per sq km in 2011. Velhe taluka has shown a decline in density from 118 persons per sq km in 1991 to 117 persons per sq km in 2011 within the PMR. Over the years (from 1991 to 2011), Mulshi and Mawal talukas have shown above-average population growth but below-average population densities. This is majorly due to the talukas’ hilly terrain in the south and west of the region.
Table 10.6Taluka-wise population density
Taluka
Area (sq km)
1991
2001
2011
Haveli
815.63
276
375
520
Maval
1,070.64
144
181
231
Mulshi
1,003.26
113
132
170
Khed (Part)
874.15
206
257
337
Shirur (Part)
1,062.85
142
Taluka-wise household size
Haveli (4.60) and Mulshi (4.52) have the smallest household size within the PMR Study Area. Further, it can also be seen that there is a negative growth trend in household size in the region. Haveli and Mulshi talukas have shown a rapidly decreasing rate of household size within the region. This is indicative of the trend of increasing nuclear families in urban areas. Similarly, the rural talukas of Purandar, Bhor, Velhe and Daund have comparatively larger household sizes.
Table 10.7Taluka wise decreasing growth trend in household size
Talukas
Household Size
1991
2001
2011
2017 (Estimated)
Haveli
5.23
5
4.6
4.29
Mawal
5.75
5.37
5.09
4.97
Mulashi
5.35
4.92
4.52
4.27
Khed ( Part)
5.82
5.27
4.65
4.36
Shirur(part)
5.6
5.1
4.68
4.74
Purandar(part)
5.65
5.14
4.75
4.7
Bhor( Part)
5.32
4.99
4.71
5
Velhe ( Part)
5.06
4.88
4.75
5.01
Daund ( Part)
5.37
5.12
4.94
4.51
PMR Planning Area
5.49
5.12
4.72
4.51
Source: Census 1991, 2001, 2011
Literacy Rate
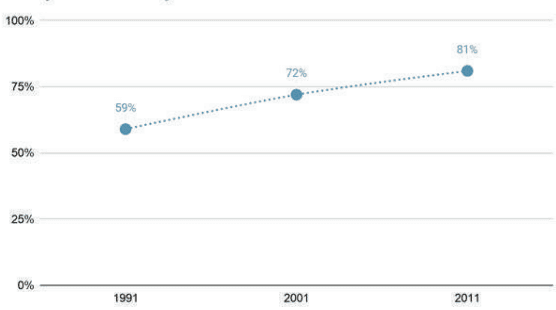
The literacy rate in the PMR Study Area has increased from 59% in 1991 to 81% in 2011. This rate is higher than the literacy rate estimated for Pune district, which is 79%. Further, male literacy in the PMR Planning Area is 80.1%, and female literacy is 70.6%.
Figure 10.11: Literacy Rates (1991-11)
Taluka-wise literacy rates
The literacy rate (2011) of the PMR Planning area is 81%. The average literacy rate for the talukas of Haveli, Mulshi and Shirur was 82%. The average literacy rate for the talukas of Daund, Velhe and Purandar was 78.6 %. Table 10.8 below gives the literacy rates in the overall PMR Planning area.
Table 10.8Taluka wise Literacy Rates in the PMR Study Area
Taluka
1991
2001
2011
Haveli
65%
75%
83%
Mawal
53%
70%
79%
Mulshi
55%
68%
79%
Khed (Part)
58%
71%
80%
Shirur (Part)
59%
74%
84%
Purandar (Part)
64%
75%
81%
Bhor Part)
64%
78%
84%
Velhe (Part)
52%
66%
78%
Daund (Part)
59%
71%
77%
PMR study Area
59%
72%
81%
Source: Census 1991, 2001, 2011
Sex Ratio
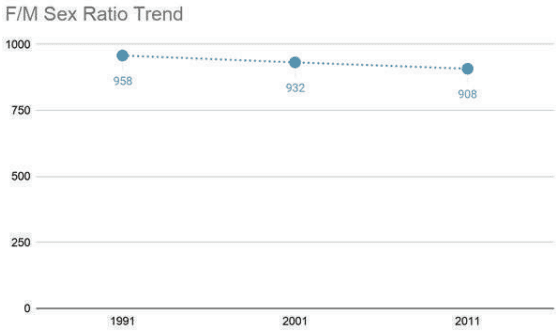
The sex ratio in the PMR Study Area has decreased from 932 in 2001 to 908 in 2011. PMR Study Area’s sex ratio is lower than that of PMR and Pune district. This indicates in-migration of male migrants in the region.
Figure 10.12: Sex ratio in PMR Study Area
Taluka-wise sex ratio:
The decreasing trend of sex ratio in the PMR Study Area indicates migration within the region. Within the talukas, Shirur has the lowest sex ratio of 839, indicating high male in-migration. This is followed by Khed and Daund talukas having sex ratio of 851. Hilly talukas on the western region Mawal (918), Purandar (882), Bhor (889) and Velhe (934) have comparatively higher sex ratio, which is an indicator of male out-migration rate.
Table 10.9Taluka wise sex ratio
Talukas
1991
2001
2011
2017 E
Haveli
927
883
862
851
Maval
956
961
918
880
Mulshi
993
931
881
851
Khed (Part)
961
914
851
799
Shirur (Part)
959
880
839
808
Purandar (Part)
987
854
882
919
Bhor (Part)
961
901
889
876
Velhe (Part)
1,031
932
934
939
Daund (Part)
962
888
851
808
PMR Planning Area
958
907
869
840
Source: Census 1991, 2001, 2011
Age-sex pyramid
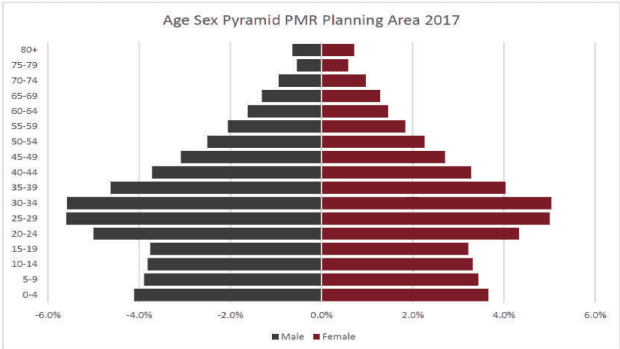
The age-sex pyramid has been forecasted for the year 2017 using the cohort survival method. Cohorts of major urban areas, i.e. PMC and PCMC were deducted from the cohorts of the PMR area as a whole to obtain the cohorts only inclusive of municipal councils in PMR and PMR Planning Area. Here, cohorts of municipal councils and PMR Study Area are assumed to be applied for the PMR Study Area and projections for the year 2017 were carried out. The age-sex pyramid for 2017 shows the higher share of 20-35 age group of the population indicating in-migration in the PMR Study Area for work and educational purposes.
Figure 10.13: Graph for age-sex pyramid for PMR Planning Area.
Workforce participation
Workforce Participation Ratio (WFPR) represents a percentage of people actively participating in the workforce vis a vis total number of people eligible to participate in the labour force. As Census 2011 data does not provide agewise population distribution, the total population is considered for calculations.
The workforce participation rate for PMR is 48.2 % with 8.31 lakh workers, which is more than PMR (41%), Pune district (43%) and Maharashtra (44%). But it is to be noted that the high WFPR in the PMR Planning Area is also contributed by agricultural activities as opposed to the urban areas.
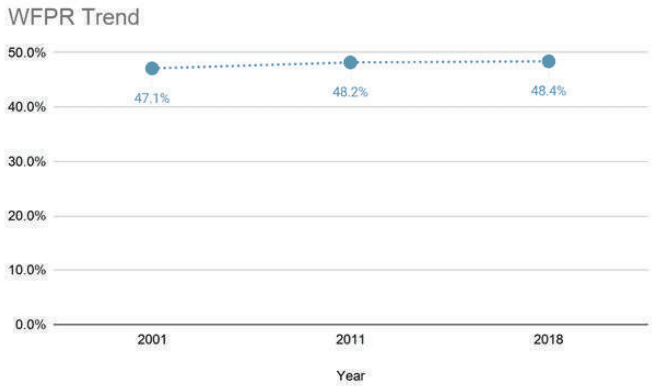
The workers in the PMR Study Area contribute to 26% of PMR workers and 19% of Pune district workers. As shown in Figure 10.14, overall workforce participation in PMR is estimated to have increased from 47.15% to 48.2 % between 2001 and 2011, with no substancial growth.
Figure 10.14: Workforce Participation rate in PMR study area
Taluka-wise Workforce Participation
Further, workforce participation is comparatively high in Purandar (59%), Shirur (51%) and Khed taluka (51%). These high numbers are due to the agrarian nature of these talukas, where more than 50% of the working population is engaged in agriculture and allied activities. Workforce participation is low in Mawal (44%), Mulshi (48%) and Haveli (44%). These talukas are close to the city centre and thus have employment opportunities other than agriculture. It can be clearly seen from the table given below that the talukas having low workforce participation rate have more than 50% of the workers engaged in non-agricultural activities.
Table 10.10Economic classification of workers in PMR planning area
Taluka
Total Work- Ag ing Popula- Wo tion 2011 Cu
Non ricultural Wor rkers and hold ltivators and ers)
-Agricultural kers (House-Industries Wo Other Work- Pa Ra
rkforce rticipation te
Percentage of Total Workers
Agriculture Workers Per-centage
Non-agricul-tural Workers Percentage
Bhor
34,768
22,825
11,943
50.89%
65.65%
34.35%
Daund
85,832
64,778
21,054
51.29%
75.47%
24.53%
Haveli
184,636
76,346
108,290
43.50%
41.35%
58.65%
Khed
151,547
94,371
57,176
51.51%
62.27%
37.73%
Mawal
108,111
49,047
59,064
43.75%
45.37%
54.63%
Mulshi
81,375
36,452
44,923
47.76%
44.80%
55.20%
Purandar
32,725
26,104
6,621
58.54%
79.77%
20.23%
10.3Demographics Analysis
This section presents key inferences based on close analyses of the demographic situation of the Study Area to position it in the correct perspective.
“91% of the Study Area is rural as per Census definition.”
As per 2011 Census, about 18.15% of the district’s population resides in Study Area out of which 91.29% is rural population. Considering the definition of Census Towns (CT), the villages are considered urban if their population is greater than 5,000, main male workforce outside agriculture is >75%, and population density is >400 p/sqkm. Within the Study Area, Bhor, Velhe, Daund, and Purandar are entirely rural as per the above criteria. Mulshi taluka shows the highest urbanisation level (15%), whereas Khed, Mawal, Shirur talukas show urbanisation levels between 9-12%.
However, aerial imagery and existing land use reveal the number of rapidly urbanising villages and applying census definition alone may not reveal the real growth trend in the Study Area.
“In reality, the Study Area is rapidly urbanising, out-pacing the rural population growth rate.”
The average decadal growth rate of urban population in the Study Area was 90% between 2001-11. This decadal growth rate is higher than that of PMC (33%) and PCMC (71%) during the same period. PMC’s declining population growth rate can be attributed to the increased cost of living, high land prices, sluggish natural growth rate, congestion and declining quality of life. Spin-offs from this trend can be seen as an increase in urban population around its immediate fringes, i.e. urbanising villages of Study Area and PCMC.
The Study Area has excellent potential to urbanise with emphasis on offering the best “Quality of Living” to benefit from present demographic growth trends within the region.
“Favorable Sex Ratio for demographic growth but weaker Literacy Rates for development.”
Sex ratio is commonly defined as the number of females per 1,000 males in the population. Within the Study Area, the sex ratio has been declining, which could be attributed to largescale migration of male workforce into the
region post-2001. The Study Area shows a higher number of females compared to urban areas. It has favourable sex ratio in comparison with MMR. Age-group wise distribution is studied at District level since Census 2011 data is limited to age group 0 to 6. Age-group pyramid indicates a favourable situation with a broad base of the young and working-age population.
10.4Economy: Pune Metropolitan Region (PMR)
A comprehensive understanding of a region is often developed through the study of its economic characteristics. This section outlines the economic profile of the PMR in context of the economic profile of the state and Pune district. It also discusses relevant growth trends across various segments of the PMR economy.
Growth of the metropolis
Pune is a diversified metropolitan city with industrial and commercial activities, educational, administrative and defence services. The original old city has been a hub for market centres for agricultural produce in the district as well as distant rural areas. It serves as a wholesale market for the sale of agricultural goods. Pune city has a great historical and administrative background and the most important advantage of being close to India’s economic centre - Mumbai. Pune experienced the outgrowth of expansion of industries beyond Mumbai, with many companies choosing to locate their industries in the city. Eventually over a period of time, Pune became an industrial hub catering services to the entire state of Maharashtra, thus establishing linkages to other cities not only in India but also globally.
The industrial development was majorly supported by good connectivity within the region. The Mumbai-Pune expressway gave an impetus to the economy of the region by reducing travel times to Mumbai and JNPT port. The region also enjoys connectivity to MIDCs in the east through SH27 to Ahmednagar/Aurangabad and NH65 to Solapur, towards the south through NH48 to Satara.
The initial industrial development was concentrated in Pimpri Chinchwad Municipal Corporation area (PCMC) only. Development of PCMC as an auto hub centre attributed to active industrial set up of production units. Few of the industries which established themselves between 1962 and 1992 were Kirloskar, Bajaj, TELCO (now Tata Motors), Philips India, etc. -The establishment of MIDCs brought about a major change in the manufacturing sector in the industrial profile of the region. The establishment of Chakan MIDC as a major auto-hub cluster acted as a magnet for investment in the auto-manufacturing sector globally.
The international status of the region has attracted many multinational corporations in choosing Pune for a profitable investment centre. Pune experienced a major change, shifting its base from the manufacturing sector to the IT sector, after the IT revolution and industrialisation after 1990. The city is now an established IT hub in India. This geared up growth in all the directions beyond the city limits. The IT cluster in Hinjawadi towards west and Magarpatta Cyber City in Hadapsar and Kharadi are the key locations that have experienced tremendous growth with respect to population and real estate. Pune is also an emerging pioneer educational hub with wellequipped educational facilities and one of the highest young populations. The development of IT widens the gates for employment opportunities for a number of people from different parts of the country. This, in turn, has led to an increase in demand for real estate and an increase in demand for housing, retail and commercial spaces.
10.5Economic Analysis
This section presents key inferences based on close analyses of the economic composition of the Study Area, Pune district and Maharashtra.
“Maharashtra is a leading destination for investments in India.”
With its strong industry and service, Maharashtra is consistently the highest contributor to the Indian economy. Its contribution to the national GDP stands at 14% while the national industrial output share is at 13%. Major economic drivers of Maharashtra are retail, infrastructure, media and tourism, fintech and IT. The service sector dominates the state domestic product contribution (56%) as a result of strong IT/ITES, banking industry presence in Maharashtra. Maharashtra has high FDI inflows, and 4,210 MoUs were executed with major companies during the Magnetic Maharashtra (2018) summit. Key sectors for high investments in Maharashtra include energy, infrastructure, metal and alloys, aircraft, e-vehicles, textiles, renewables, agro-processing, FMCG, logistics, precision manufacturing, real estate and consulting.
“Pune district is the third-largest economic contributor to Maharashtra’s economy.”
Pune district attracted about 16% of total investments pledged during the Magnetic Maharashtra (2018) summit. Approximately 2,400 entries had details of investment showing the key sectors such as real estate, auto and spare parts, logistics and warehousing, FMCG, precision engineering, pharmaceuticals, and biotech attracted significant investments in Pune.
Pune district ranks second in Maharashtra for the number of establishments and industrial employment. All this reflects in the consistent growth in its GDVA over the years, which grew at a CAGR of 11.5% between 2012 and 2017.
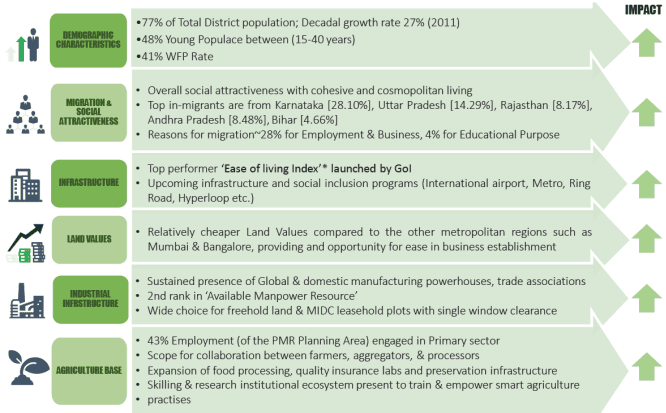
Key factors contributing to Pune district’s socioeconomic growth are elaborated in Figure 10.23. It shows that Study Area’s economic positioning is primarily defined by industrial infrastructure and an established ecosystem for knowledge-based sectors such as IT, ITES, Biotech and Pharmaceutical. It contributes to approximately 75% of the GDP of the district. The Study Area is Pune district’s industrial powerhouse with a home to several industrial parks, IT parks, business parks and emerging technology industries. The district has been undergoing robust economic performance for the past two decades where GDP has been growing steadily around 6-8%.
Figure 10.21: Key Governing Factors for PMR’s Socio economic Growth
“Agriculture is the third largest income generator for the District.”
The District has a net sown area of 8,63,000 hectares, 55% of total geographical area, and has major crops like sugarcane, jowar, fruits, pulses and vegetables.
The major component of the primary sector in Pune district is agriculture. There are also fisheries and limited forestry activities in the district. Organised Mining and Quarrying is negligible in the district and contributes <5% of the primary sector GDP.
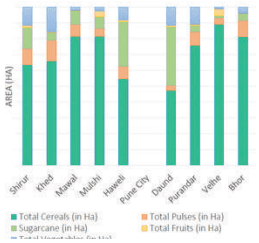
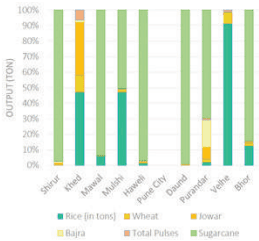
Major crops which are cultivated in the district are Sugarcane, Rice, Jowar and Bajra. Crops and productivity vary
across the talukas. Shirur is a leading taluka in the production of cereals, pulses and Sugarcane. Daund also is a major producer of Sugarcane. Cereals and Sugarcane occupy the maximum area under cultivation among the major crops. Sugarcane, Rice and Bajra are the major crops in terms of production. Sugarcane is the major crop which adds to about 51,56,200 tons of annual production.
“Despite massive public investments in irrigation, agriculture sector output and employment share remain low.”
Table 10.17 shows Taluka-wise agriculture potential in terms of cultivated agricultural land, irrigation coverage and output.
Census data shows that the share of agricultural employment has been falling in the district over the past four decades with a reduction in the number of cultivators in the region (reduced from 19% to 15%). The Study Area reflects the same trend as per Census 2011, where cultivators merely increased by 10649, whereas the number of agriculture labourers grew only by 4%.
Total population of Study Area (including census towns)
10,65,134
13,48,185
27%
17,11,492
27%
Source: Census 1991, 2001, 2011
Figure 10.5: Map showing taluka wise total population
Source: GIS Database, Census 1991, 2001, 2011
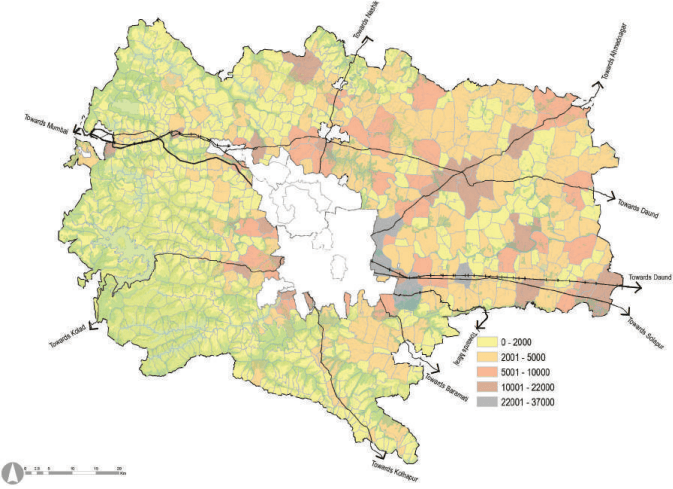
Figure 10.6: Village-wise population distribution in PMR Planning Area
Source: GIS Database, Census 1991, 2001, 2011
189
242
Purandar (Part)
290.96
171
187
192
Bhor (Part)
258.14
208
236
265
Velhe (Part)
229.24
118
115
117
Daund (Part)
552.88
202
267
303
PMR-Planning Area
6,157.75
173
219
278
Source: Census 1991, 2001, 2011
Figure 10.9: Gross Density of Study Area
Source: GIS Database, Census 1991, 2001, 2011
Household Size
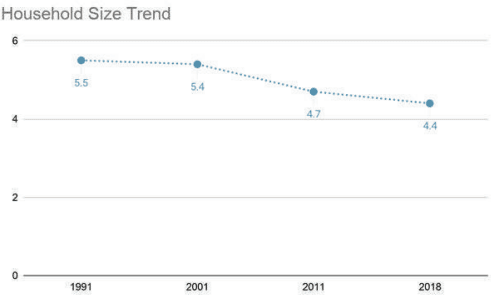
Household size of the PMR Study Area was 4.72 in 2011. Comparatively, PMR’s household size is 4.1, and for Pune district, it is 4.2. The household size of the PMR Study Area has declined from 5.12 in 2001 to 4.72 in 2011.
Primary reasons for decreasing household size is the growing trend of more nuclear families, declining fertility rates, and rising single-person migrations. This trend of the increasing population combined with decreasing household size translates further into increasing housing space demand.
Figure 10.10: Trend in household size in PMR study area
Shirur
131,939
88,371
43,568
51.35%
66.98%
33.02%
Velhe
13,791
10,272
3,519
51.33%
74.48%
25.52%
Total
824,724
468,566
356,158
48.19%
56.81%
43.19%
Source: Census 1991, 2001, 2011
However, Literacy Rate remains a key concern since it is lowest in the Study Area. CTTS Household Survey reports 91.1% literacy rate with about 25%, 32% and 22% of the population being educated up to 5th, 10th and 12th class respectively. The lack of educational infrastructure, accessibility, and efficiency could be few contributors to lower literacy rates. As most of the working-age group is educated up to 10th-12th Class, vocational training holds immense importance for skilling of youth and re-skilling of elderly workforce. It would also support major employment generators such as SME, which grapples with sourcing local semi-skilled/skilled tertiary workers which is understood from interaction with industry associations.
“Shrinking household size”
Household sizes across various jurisdiction boundaries in PMR are shrinking invariably, between 1991 and 2011. Rate of reduction of household size in case of villages is higher than census towns. The average household size is 4.72, about 58% of households represent household size ranging from 4 to 5, and only 11% of households have a size greater than 5.
Table 10.11Demographic Indicators of Pune District and Study Area
Census 2011 Data
Total
Urban
Rural
Pune District
Population
94,29,408
57,51,182
61%
36,78,226
39%
Decadal Growth Rate
30%
Child Population (0-6)
11,04,959
6,64,857
60%
4,40,102
40%
Sex Ratio
915
904
932
Literacy Rate
86%
79%
71%
Work Force
40,48,993
22,20,406
55%
18,28,587
45%
Households
21,51,503
13,71,531
64%
7,79,972
36%
Household Size
4.4
4.2
4.7
WPR
43%
39%
50%
Study Area
Population
17,11,492
1,49,248
15,62,244
Decadal Growth Rate
27%
Child Population (0-6)
2,17,065
22,609
10%
194,456
90%
Sex Ratio
945
826
947
Literacy Rate
71%
75%
Work Force
8,31,824
61.71
7%
770.11
93%
Households
3,67,048
37,222
10%
3,29,826
90%
Household Size
4.7
4.2
4.8
WPR
48%
40%
49%
Source: Census 2011
The geographical advantage of Pune is its large flat hinterland with good accessibility. The primate city has now grown well beyond its city limits and will continue to experience this, being a great centre for opportunity. Pune metropolitan region is thus an important social, economic and cultural centre in the state as well as the country.
Regional Income and past trends
To understand the domestic output of the region, district level analysis of the economy has been carried out. Due to the availability of income data at Pune district level, this data has been used to understand the economic output of PMR. The report on the District Domestic Product of Maharashtra 2004-05 to 2013-14 (the base year 2004-05) has been referred for this analysis.
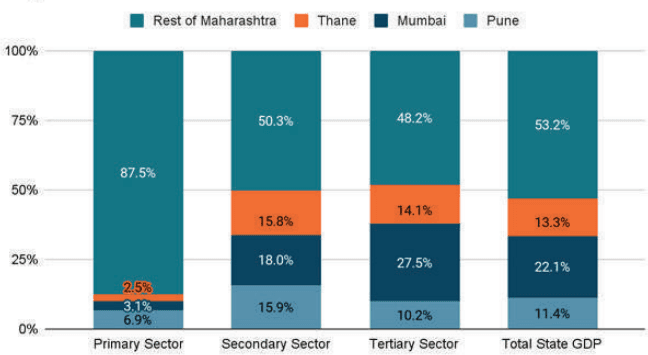
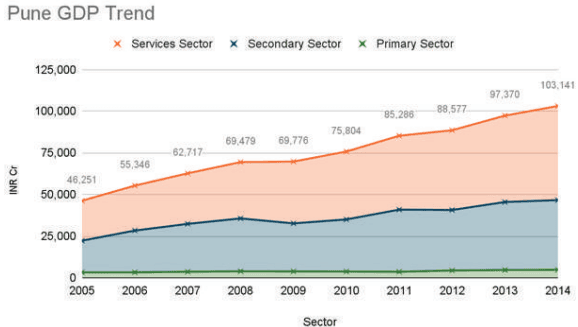
As shown in Figure 10.15, for the year 2013-14, Pune district contributed to 12% of the total state domestic product (Mumbai’s contribution was 23% and Thane was 14%). In absolute values, the Pune district’s GDP was Rs. 1,03,141 Cr and that of Maharashtra’s was Rs. 8,96,767 Cr.
Figure 10.15: Major contributors to GDP share in Maharashtra 2014
Major Contributors to State GDP 2014
Figure 10.16: GDP Growth Trend for Pune and Maharashtra
GDP Growth Trend
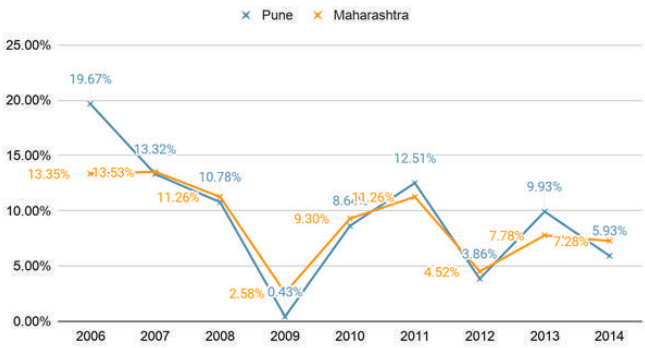
Data in Figure 10.16 shows that the annual average growth rate in the domestic product for Pune district as well as Maharashtra was about 9% during 2006-2014. It can be observed that during peak periods, Pune has experienced higher growth rates than Maharashtra. Similarly, during the economic slowdown, Pune was more severely affected compared to the state. Pune district is a major contributor to the state’s economic health.
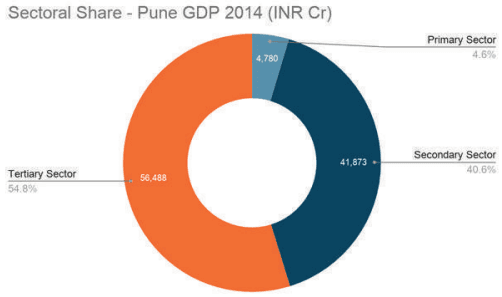
Further observing the sectoral contribution to the GDP as shown in Figure 10.17, the tertiary sector dominates with its share of 55% to the total GDP for Pune district for the year 2014, followed by the secondary sector (40%) and the primary sector (5%).
Figure 10.17: Sector wise GDP share for Pune District 2014
Source: District Domestic Product Report for Maharashtra 2004-05 to 20013-14 (DES, GoM)
In terms of Pune district’s sectoral contribution to the State economy, it is observed that the contribution of the secondary sector and tertiary sector has always been significant as against that of the primary sector. For the year 2014, Pune district’s secondary sector constituted 15.9% of Maharashtra’s secondary sector GDP, and the tertiary sector’s contribution was 10.2% of total Maharashtra’s tertiary sector GDP.
Figure 10.18 shows the trend within the sectors at 2004-05 base prices from 2004-2014 in Pune. It can be clearly seen that the GDP contribution by the tertiary sector has shown rapid growth over the past decade. The secondary sector has experienced ridden fluctuation within the economic slowdown phase and has contributed significantly, indicating the robustness of the sector. The primary sector’s contribution has been the lowest, and it does not show any growth in the past years.
Figure 10.18: GDP growth trend within sectors in Pune District
Source: District Domestic Product Report for Maharashtra 2004-05 to 20013-14 (DES, GoM)
In the last two decades, the Pune Metropolitan Region has emerged to be an important centre for industrial development. With the setting up of various MIDCs, SEZs, townships and incentives with respect to policy initiatives which has created a conducive environment for huge investment in the region. According to the Economic Survey of Maharashtra 2017-18, the Pune division of MIDC contributes to 25% of the total number of units, 38% of the total investment and employs 36% of employees in total Maharashtra. This clearly establishes the importance of Pune region as an important economic centre for investments and generating employment.
Table 10.12Industrial units in MIDC with key investments in Maharashtra
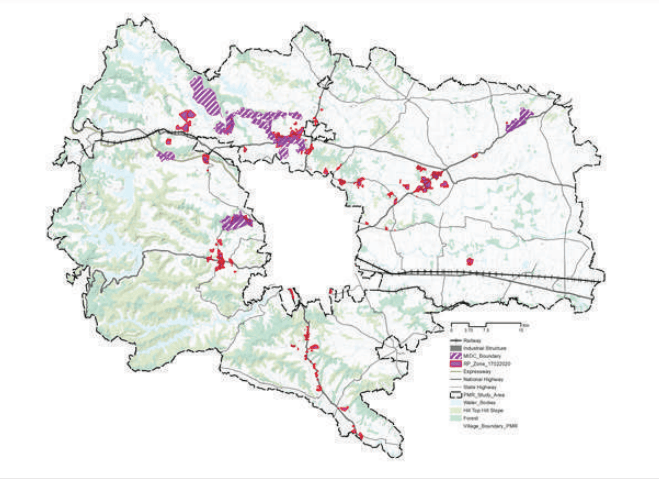
The Pune metropolitan region hosts a variety of secondary and tertiary activities together with primary activities. The spatial distribution of these activities is majorly seen along the transport corridors resulting in ribbon development. The Regional Plan 1995 had identified urban growth centres at Alandi, Talegaon, Uruli Kanchan and Loni Kalbhor and had proposed development around the fringe of PMC and PCMC. These proposals have not been realised completely, however, have shaped the development pattern in the region. Figure 10.19 shows the spatial spread of different industrial clusters in the PMR Planning Area and beyond.
Industrial Clusters in PMR
Industrial clusters are spread across PMR. PMR houses MIDCs at Talegaon, Chakan, Ranjangaon, Kharadi and Hinjawadi. Their strategic location and good connectivity have led to the development of other industries along these corridors. Development of some of these industrial clusters has been seen in Urse along the Mumbai-Pune Expressway, along Talegaon-Chakan road at Mahalunge in Khed, at Shikrapur and Sanaswadi and Koregaon Bhīma along Pune-Ahmednagar corridor, at Uruli Kanchan towards Solapur highway and Sasewadi in Khed Shivapur. It can be noted that the presence of these industries has influenced the employment trend in villages as workers engaged in non-agricultural activities have shown an increase in numbers and concentration along and around these developments.
Figure 10.19: Industrial Clusters in PMR
Existing Economic Geography of the PMR Study Area
The ELU database captures areas under primary activities including agricultural farms, cattle sheds and farmhouses. Secondary activities include industrial zones and special planning areas such as MIDC and SEZ. Tertiary activities cover the area under commercial and mixed-use. Based on the ELU database, the total area under various economic activities in the PMR Study Area is 2,400 sqkm. This is 39% of the entire PMR Study Area. Table 10.13 provides a further breakdown of these numbers.
Table 10.13Spatial distribution of Land-use under various economic activities as per ELU
Sr.No.
Land Use
Type of Activities captured in ELU
Area in sq. km(as per ELU data)
Area as a % of total area under economic activities
Area as a % of total planning area
1
Agriculture use
Primary ActivitiesFarmhouse, Cattle shed, Animal related Poultry farm
Tertiary ActivitiesMarketsGodowns/WarehouseHotelsOther use
25.66
1.07%
0.42%
Table 10.13 indicates that around 97% of the land available under different economic activities in the PMR Study
Area is under agricultural use. This is predominantly due to the rural nature of the region and agriculture being a major income source of the villages. The ELU data captures the land-use under various economic activities. The table above shows the distribution of economic activities in talukas. Out of the total PMR Study Area, 37.95% is under primary use, 0.61% under secondary use and 0.42% under tertiary use.
Primary Activities:
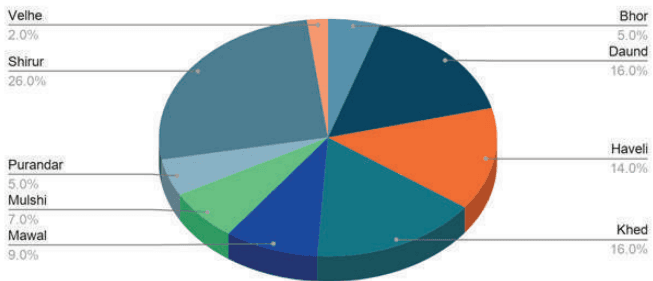
The total area under the primary sector (agriculture and allied use) in the PMR Study Area is 2,338 sq km. Figure 10.20 shows that out of the total area under primary use i.e. agriculture, Shirur and Daund talukas constitute 42% of the total area under primary activities, making them major contributors. Purandar, Bhor and Velhe talukas have a lower share of primary agricultural activities, with 5%, 5%, 2% contribution respectively. This is maybe on account of the hilly terrain of the area in these talukas and as only a part of these talukas are included in the PMR Study Area.
Figure 10.20: Primary activities-land use distribution in PMR study area
Agricultural Land Use Share
Secondary Activities:
The ELU database captures the secondary activities concerning small, medium and large-scale industries. The total area under secondary activities as industrial use in the PMR Study Area is 37 sq km. Out of the total share of land-use under secondary activities, Khed and Shirur contribute to 50% of the secondary activities in the PMR Study Area. This is majorly due to the presence of Chakan MIDC in Khed taluka and Ranjangaon MIDC in Shirur taluka. The talukas contributing least to the secondary activities are Bhor, Purandar, Velhe and Daund. This may be due to the terrain of the region and lack of connectivity.
Table 10.14Secondary activities in PMR Study Area- Land-use distribution and number of units
Classification
Area (ha)
Number of Units
Micro and Small
3,179.24
21,873
Medium
106.28
780
Large
438.26
2,031
Total
3,723.78
24,684
Tertiary Activities:
The area under commercial use as per the ELU database is around 26 sq km. The tertiary activities include all markets, hotels and restaurants, warehouses etc. There is a dispersed spread of commercial areas in the PMR Study Area where the offices and retail areas are located in and around major city centres. The concentration of area under office spaces is high in Mulshi (31.64%), Haveli (22.96%) and Khed (15.52%) taluka as it is located near Pune city. The same talukas correspond to more than 50% of the total no. of commercial units in the PMR Study Area. Apart from the periphery of Pune city, the commercial use concentration is also high around urban centres. Concentration of retails, hotels, restaurants is high along the Mumbai-Pune expressway and around Lonavala. The concentration of commercial units is low in Bhor (0.38%), Daund (2.67%) and Purandar (2.57%) taluka.
Table 10.15Commercial units and area
Classification
Area (ha)
Number of Units
Godowns
154
2,862
Hotels
79
3,788
Markets
7
105
Other uses
2,029
18,690
Total
2,269
25,445
“Secondary and Tertiary Sectors are key economic drivers of Pune District Economy
Secondary and tertiary sectors are the main drivers of the district economy, whereas the primary sector (agriculture) offers employment to most of the workforce.
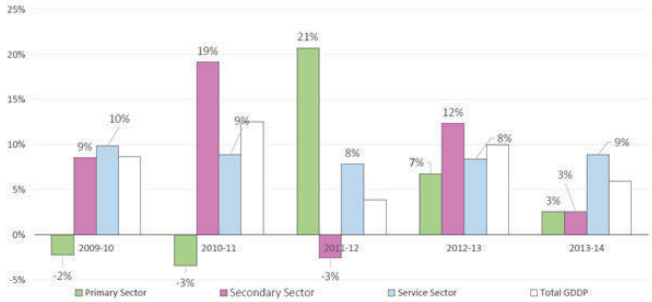
Agriculture is the main economic activity within the primary sector, whose GDP contribution has been declining by about 1% every two years.
Contribution of the secondary sector has been consistent at 40% and above. Manufacturing sub-sector shows a positive trend of increasing registered establishments. It can be seen that the share of unregistered manufacturing is decreasing with time. The secondary sector witnessed maximum growth in 2010-11 after which the sector shrunk due to global recession. It has picked up again post 2014.
The tertiary sector has been showing consistent growth from 2009 to 2013, (51-55%), in tandem with urbanisation. Growth is seen in banking and insurance, real estate, trade and hospitality and communication sectors.
Within the Study Area, growth of the secondary sector (construction in particular) and Tertiary sector has been concentrated at municipal corporations and along its fringes through large scale developments and business parks. Growth of the industrial sector has been pushed beyond the 5km buffer from PMC and PCMC boundaries due to industrial decentralisation policy adopted in RP 1997. These industries and its support ecosystem form the interface between the Study Area and municipal corporations.
Table 10.16Sectoral Distribution of Pune District GDP and Changing shares (2005-14)
2004-05
2007-08
2010-11
2013-14
Share of Sub-sector
2004-05
2008-09
2011-12
2013-14
Primary
3,240
3,789
3,615
4,780
Agriculture in Primary sector
84%
84%
80%
80%
7%
6%
4%
5%
Secondary
19,026
29,599
37,294
41,873
Registered Manufacturing in Secondary Sector
65%
67%
68%
67%
41%
43%
44%
41%
Unregistered Manufacturing in Secondary Sector
15%
12%
11%
11%
Tertiary (Service)
23,985
34,731
44,377
56,488
Communication in Tertiary Sector
3%
4%
8%
9%
Trade and Hospitality in Tertiary Sector
23%
20%
20%
19%
Banking and Insurance in Tertiary Sector
18%
22%
23%
22%
Real Estate in Tertiary Sector
26%
29%
26%
27%
52%
51%
52%
55%
Other Services in Tertiary Sector
10%
8%
8%
8%
Source: District Domestic Product Report for Maharashtra 2004-05 to 20013-14 (DES, GoM)
Figure 10.22: Growth Rate of Sectors in Pune district
Source: District Domestic Product Report for Maharashtra 2004-05 to 20013-14 (DES, GoM)
2,458,600
Khed
1,37,354
20,079
1,05,151
1,07,745
21,818
21%
61,977
26,600
Mawal
1,13,135
32,736
68,920
72,473
22,735
33%
18,215
219,800
Mulshi
1,03,931
16,726
44,347
69,529
21,977
50%
24,577
63,800
Haweli
1,33,627
7,864
92,531
1,06,868
19,112
21%
33,998
387,400
Pune City
11,990
235
5
1,480
NA
NA
0
0
Daund
1,28,986
4,904
1,15,469
1,04,746
52,033
45%
84,407
1,937,000
Purandar
1,10,313
2,221
89,100
99,884
25,171
28%
58,769
105,600
Velhe
49,955
10,796
23,881
34,296
2,259
9%
14,738
6,900
Bhor
89,234
12,260
48,124
59,599
10,893
23%
30,407
193,200
Source: District Socio-economic Review 2016 (Agricultural Output in Talukas of Pune district & Area under cultivation of Major Crops have been termed as Main Crops. Areas/ Output clubbed under respective column); Taluka-wise Irrigation data referred from Irrigation Department’s Zila Pustika 2015
Figure 10.23: Taluka-wise Cropping Pattern and Output
Source: District Socio-economic Review 2016
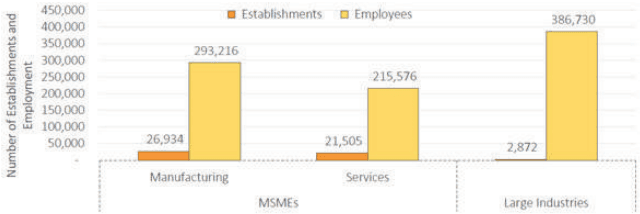
“Manufacturing sector leads in terms of establishments and employment within the secondary sector.”
Key sub-sectors within the industrial sector in Pune are automotive, auto ancillary, electronics, food processing and engineering. Additionally, about 2,872 large industries have been registered as of 2015. The spread of these industries in terms of manufacturing and services is portrayed in Figure 10.24.
Figure 10.24: Registered industries and employment in Pune District
Source: District Industrial Centre (DIC)
The manufacturing sector comprises large industries and SMEs. Approximately 44,000 firms were registered in Udyog Aadhaar as of March 2018, and the number reached 80,000 in October 2018.
Table 10.18Industrial Estates in PMR
Location
Distance from Pune city (km)
Major Industries
Chakan
35
Engineering, Auto and Auto Ancillary
Hadapsar
10
Engineering, Food, Auto Ancillary
Hinjawadi
19
Pharmaceuticals, Auto Ancillary
Jejuri
45
Pharmaceuticals, Textiles, Engineering
Kharadi
17
Engineering
Pimpri Chinchwad
17
Engineering, Auto and Auto Ancillary, Pharmaceuticals, Engineering
Source: District Industrial Centre (DIC), 2013 Data (Sixth Economic Census, 42nd Round)
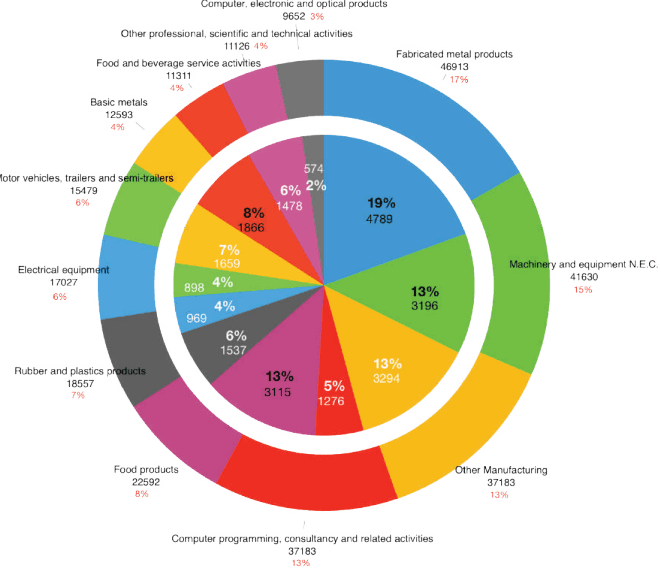
Table 10.19Major SMEs in Pune district
Sector
Number of Enterprises
Number of Employ-ees
Manufacture of fabricated metal products, except machinery and equipment
4,789
46,913
Manufacture of machinery and equipment N.E.C.
3,196
41,630
Other Manufacturing
3,294
37,568
Computer programming, consultancy and related activities
1,276
37,183
Manufacture of food products
3,115
22,592
Information service activities
462
19,831
Manufacture of rubber and plastics product
1,537
18,557
Manufacture of electrical equipments
969
17,027
Employment Activities
396
15,802
Manufacture of motor vehicles, trailers and semi-trailers
898
15,479
Manufacture of basic metals
1,659
12,593
Security and investigation activities
211
11,395
Food and beverages service activities
1,866
11,311
Other professional, scientific and technical activities
1,478
11,126
Manufacture of computer, electronics and optical products
5,74
9,652
Total
25,146
3,28,659
Source: District Industrial Centre (DIC), 2013 Data (Sixth Economic Census, 42nd Round)
Figure 25: Major SME’s in Pune District
In terms of economic output, the manufacturing sector’s growth occurred due to MIDC developed industrial estates and privately-led complementary industrial clusters. Data on the status of land availability in MIDC estates (Table 10.20) reveals that almost 100% of lands are almost consolidated/committed in terms of absorbing newer industrial tenants.
Table 10.20Status of MIDC Estates - Study Area
Sr. No.
Name of MIDC Estate
Land area in pos-session (ha)
Land area allotted (ha)
Vacant land Unalloted (ha)
Land area to be acquired (ha)
Remark
1
Chakan Ph.-I
256
2,613
37
3
Vacant land unalloted is not consolidated Undulating land.
2
Chakan Ph.-II
1,407
29
3
Chakan Ph.-III
584
4
4
Chakan Ph.-IV
402
2
5
Chakan Ph.-V
-
-
-
637
400-485 ha. to be acquired by Dec. 2019
6
Talegaon Ph.-I
578
-
-
-
20 Ha. not available for development
7
Talegaon Ph.-II
271
-
20
-
8
Talegaon Ph.-III
-
-
-
-
Denotification due to high acquisition cost
9
Talegaon Ph.-IV old
-
-
-
107
Acquisition status to be confirmed by MIDC
9A
Talegaon Ph.-IV new
-
-
-
2,200
Notification status to be confirmed by MIDC
10
Talegaon Ph.-V
-
-
-
162
Acquisition schedule not defined by MIDC
11
Ranjangaon Ph.-I
929
929
36
-
-
12
Ranjangaon Ph.-II
63
63
-
-
-
13
Ranjangaon Ph.-III
-
-
-
283
To be acquired within2019
14
Hinjawadi Ph.-I
96.42
63.82
-
-
Allotted land is earmarked but not in possession
15
Hinjawadi Ph.-II
236.24
99.78
-
-
16
Hinjawadi Ph.-III
351.17
144.69
-
-
17
Hinjawadi Ph.-IV
11.02
-
-
-
Total
5,185
3,913
93
3,427
Source: MIDC- Regional Office, Pune (RO1)
The major growth catalysts in the region are skilled workforce, good connectivity and supporting infrastructure attracting large investments.
The manufacturing sector is on the verge of major transformations as the industry leapfrogs towards embracing Industry 4.0 and IoT to improve their efficiency. It is likely to boost high-tech Innovation, IT and high-tech engineering, which is already established in the Study Area.
“SMEs employ the majority of the industrial workforce in Pune district.”
Most industries are located within 60 km from Pune city, which offers most of the skilled workforce for these industries. Table 10.21 depicts the spread of industrial clusters around Pune city and their major industrial activities.
Engineering and auto industries are distributed across all the industrial clusters. As per the District Industrial Profile - Pune (2012), the employment share of large industries and MSMEs was 38% and 62% respectively. The major sectors that employ the greatest number are engineering, IT-related activities and food processing. In terms of the greatest share of enterprises, engineering and food processing lead the manufacturing SME sector of Pune. There is also major auto-ancillary production in Pune.
“Tertiary sector growth is driven by IT/ITES, Real Estate, Education, Warehousing and Logistics.”
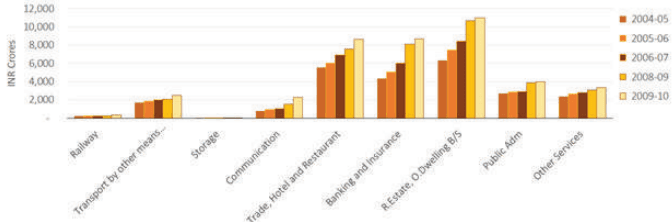
The contribution of the tertiary sector grew over the past two decades in the district. Major sub-sectors in the tertiary sector of Pune are - IT/ITES, banking and finance, trade, hospitality, biotechnology research centres, and communication. The sector is still growing and shows potential for further penetration. The factors that promote services in Pune are the competitive land prices, skilled labour and good connectivity to other major growth centres such as Mumbai. Figure 10.26 highlights the major sub-sectors within services. Infrastructural developments in the region can enormously enhance the service sector. Among services, IT exports are the primary economic activity in Pune.
Figure 10.26: Sub-Sectors within Tertiary Sector and its contribution
Source: District Domestic Product Report for Maharashtra 2004-05 to 20013-14 (DES, GoM)
“Pune alone contributes half of the total IT exports of Maharashtra.”
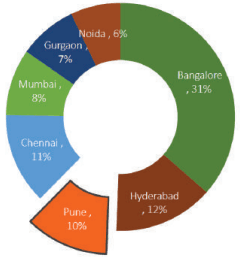
Pune is among the top four cities in India in terms of software exports. With its rising IT sector and infrastructure base, it has the potential to reach the likes of Bangalore, to be an IT leader in the country. Pune’s share of Maharashtra’s IT export stood at 57% by 2014 as per STPI, media sources. Pune’s software exports were higher (INR 29,589 crore) compared to Greater Mumbai (INR 21,811 crore). Other cities in Maharashtra such as Nagpur, Nashik, Kolhapur, Aurangabad altogether were under 1%.
Pune is a leading IT destination in India with several IT parks, spanning over Business Process Management (BPM), Information Technology Outsourcing (ITO) and Engineering Services Outsourcing (ESO). Pune saw the fastest growth as an IT destination compared to other IT hubs of India such as Bangalore or Hyderabad. According to NASSCOM, Pune’s IT sector employs approximately 3-3.4 lakh workforce spread over Business Process Outsourcing (BPO), Knowledge Process Outsourcing (KPO), ITO and ESO.
Pune has the highest share of private IT parks in Maharashtra, leading over Mumbai and Thane. There are about 172 private IT parks in Pune with major ones being in Hinjawadi, Koregaon Park, Yerawada, Viman Nagar, Kharadi, Magarpatta, Phursungi and Talawade. The Rajiv Gandhi Infotech Park (Phase I, II, III and IV) at Hinjawadi, is a dedicated MIDC Park, targeted to consolidate IT activity of Pune and is spread across a total area of about 695 hectares. IT majors operating from here are Tech Mahindra, TCS, RMZ Corporation, Infosys, Wipro, Cognizant, Ascendas, Hexaware Technologies Limited. Out of the total estimated workforce employed in all the IT Parks, Hinjawadi IT Park employs most of them.
However, it is vital to make Pune future-ready for emerging technological innovations such as Artificial Intelligence, Blockchain, and other high IT innovation sectors. Additionally, it is important to evolve a supportive start-up ecosystem in Pune to harness innovation possibilities in technology and other major sectors fully. It is crucial to upgrade the technology sector of Pune through infrastructure development and skilling.
Figure 10.27: Software Export Contribution by Tier I cities in India
Source: NASSCOM
“Office spaces, retail and warehousing drive PMR’s commercial real estate market.”
Pune’s commercial real estate market traditionally had a greater supply than demand until 2011, since then the office space off-take increased. Because of this oversupply, the market witnessed fewer launches from 2012 to 2015. Supply normalization was observed in 2012. Thereafter demand has picked up, driven by IT firms and banking, financial services, and insurance (BFSI) sector setting up back offices.
The supply for commercial offices (Source: Cushman and Wakefield report) in Pune is little over 55 million sq ft, with vacancy rates between 4% to 10% in the past five years. About 10.8 million sq ft is under construction. It showed high vacancy in the 2010-2012 periods which came down by 2014-2016, but again in 2017 onwards, it saw a slight decrease.
“Township is a unique feature of the PMR Residential Real Estate market.”
There are 16 townships spread over 2018 ha in the Study Area with their areas varying from 42- 331 ha. Out of 16, 10 townships are located on the west side and are clustered around Hinjawadi and Pirangut.
Real estate sector includes four sub-sectors - housing, commercial, retail and hospitality. The regulatory framework changes such as GST, RERA and introduction of REITS have ensured remarkable investments in the real estate segment. As these legislations are meant to protect the interests of buyers and developers, it is not only likely to fuel the market demand but also make the sector more efficient and organised. Increased productivity in the sector would lead to additional employment generation.
“Pune is an emerging retail hub with the rising purchasing power and a growing middle class population.”
Traditionally retail activity was concentrated in central Pune’s high streets such as MG Road, Laxmi Road, JM Road and FC Road. Organized retail made its foray into Pune with the developments of malls such as ICC High Street and Pune Central. Pune has emerged as an organized retail destination over the last 5 to 7 years.
The major factors which supported the retail boom in Pune are:
A significant proportion of the population within the age group of 20 to 35 years
Higher disposable income among the population employed in the IT/ITES sector
Predominantly migrant population
The retail development in Pune is also discerning a growth and movement to peripheral areas of the city. In addition to this, there is an increasing presence of international and national brands across High Streets and Malls. The supply for retail in Pune is about 6.26 million square feet, with current vacancy rates of about 30%. About 2.3 million square feet is under construction.