4.1 Growth trends in PMR
The population of PMR has grown at a CAGR of 3.24% from 2001 to 2011. Approximately 78.66% of the population in PMR resides in the urban area, while in comparison, 21.34% of the total PMR population lives in the rural area. From 2001 to 2011, the urban population in PMR grew at a CAGR of 3.52%, while the rural population grew at a CAGR of 2.17% during the same period.
Data in Table 4.1 indicates that the decadal growth Study Area- Urban is highest (91.03%) while that of PMC has been low at 32.82%. However, the growth rate in PCMC is about double for both population and households, indicating saturation in the PMC area and growth in the PCMC area between 2001 and 2011.
| Population (in Lakh) | Census 2001 | Census 2011 | CAGR | Decadal Growth Rate |
|---|---|---|---|---|
| PMR - Total | 53.24 | 73.21 | 3.24% | 37.51% |
| PMR- Urban (including CTs) | 40.66 | 57.47 | 3.52% | 41.34% |
| PMR- Rural | 12.60 | 15.62 | 2.17% | 23.97% |
| Study Area - Total | 13.38 | 17.11 | 2.49% | 27.88% |
| Study Area - Urban | 0.78 | 1.49 | 6.69% | 91.03% |
| Study Area- Rural | 12.60 | 15.62 | 2.17% | 23.97% |
| PMC | 25.38 | 33.71 | 2.88% | 32.82% |
| PCMC | 10.12 | 17.27 | 5.49% | 70.65% |
| Households (in Lakh) | Census 2001 | Census 2011 | CAGR | Decadal Growth Rate |
|---|---|---|---|---|
| PMR - Total | 11.17 | 16.30 | 3.85% | 45.93% |
| PMR- Urban (including CTs) | 8.73 | 12.76 | 3.87% | 46.16% |
| PMR- Rural | 2.44 | 3.53 | 3.76% | 44.67% |
| Study Area - Total | 2.48 | 3.63 | 3.88% | 46.37% |
| Study Area- Urban | 1.14 | 2.11 | 6.35% | 85.09% |
| Study Area- Rural | 1.34 | 1.52 | 1.27% | 13.43% |
| PMC | 5.24 | 7.34 | 3.43% | 40.08% |
| PCMC | 2.24 | 4.10 | 6.23% | 83.04% |
4.2 Residential development in Planning Area and trends
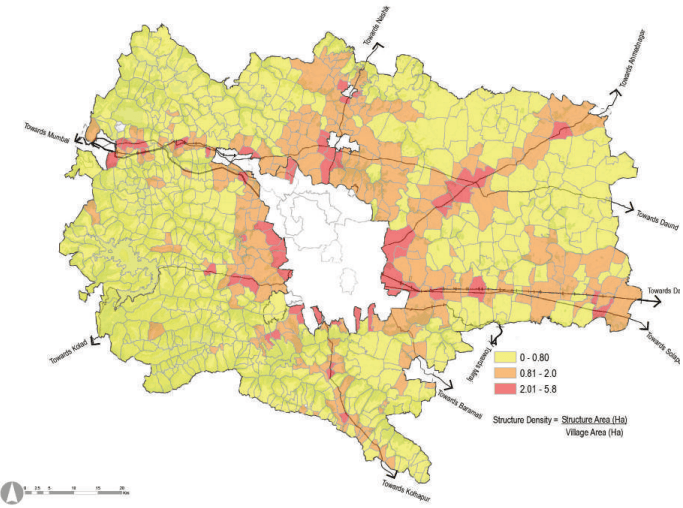
Table 4.3 showcases taluka wise breakup of residential development in the Planning Area. A total of 8,083 hectares of the Planning Area is under residential development. A drill-down of the residential area for taluka spread reveals that five talukas, namely Haveli, Khed, Mawal, Mulshi and Shirur, have a dominant 89% of the existing residential plinth area in the Planning Area.
| Taluka | Residential plinth area (ha) | Share in total residential plinth area (%) |
|---|---|---|
| Bhor | 250.67 | 3.10 |
| Daund | 439.67 | 5.44 |
| Haveli | 1,917.27 | 23.72 |
| Khed | 987.41 | 12.22 |
| Mawal | 1,865.05 | 23.07 |
| Mulshi | 1,471.88 | 18.21 |
| Purandar | 222.97 | 2.76 |
| Shirur | 844.49 | 10.45 |
| Velhe | 83.96 | 1.04 |
| Total | 8,083.37 | 100 |
An ELU assessment for residential clusters shows that in Haveli taluka, the bulk of the residential development is housed in Wagholi, Manjri Bk, Kirkitwadi, Nahre and Koregaon Mul. In Khed taluka, Varale and Mahalunge together contribute significantly to overall residential development in the planning region. In Mawal taluka, Vadgaon, Jhambul and Kune account for most of the residential developments. In Mulshi taluka, Hinjawadi, Bavadhan Bk, Pirangut, Sus, Mahalunge, Bhugaon, Bhukum and Man drive the residential development. The key villages driving growth in Shirur Taluka are Shirur and Shikrapur. These circumscribe the periphery of the PMR urban core and align with transport corridors emanating on the fringes. It is reasonable to expect further radial growth around these clusters.

Chapter 4: Housing
Figure 4.1: Village Wise Structure Density
4.3 Household Characteristics
The housing condition assessment is based on the CTTS Survey, which categorises the households under various categories. 2% of households in PMR were interviewed to capture household and travel characteristics. The samples were distributed among sectors based on the population. Within the 2% sample size, 40% of households were interviewed from PMC, 30% from PCMC and 30% from the rest of PMR. Thus to understand the housing scenario, household characteristics of PMR are represented in this section.
Household Size
Figure 4.2: CTTS: Household Size
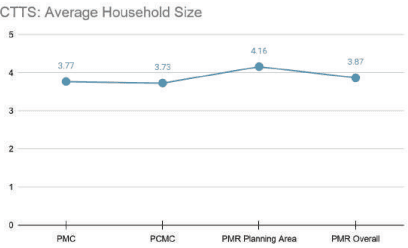
The average household size in PMR is 3.87, where the smallest is in PCMC (3.73) and the largest in the PMR Planning Area/Study Area (4.16). The household size in PMC is 3.77. At the taluka level, the average household size is the largest in Khed, i.e. 4.29 and smallest in Mawal (3.71). In contrast, among municipal councils, the
CTTS: Average Income
largest household size is observed in Rajgurunagar (4.51) and the smallest in Talegaon (3.80).
Household Income
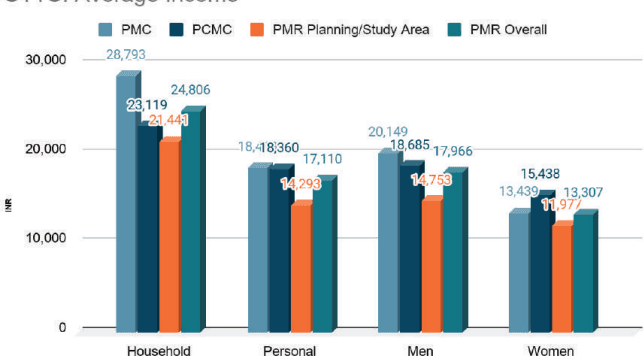
Average household and personal income per month in PMR is observed to be INR 24,806 and INR 17,110, respectively. PMC has the highest household income, i.e. INR 28,793 and personal income, i.e. INR 18,469, followed by PCMC (HI - INR 23,119 and PI - INR 18,360). Men’s income, i.e. INR 20,149, is observed to be highest in PMC, whereas women’s income, i.e. INR 15,438, is highest in PCMC.
Among the talukas, Haveli has the highest household and personal income of INR 24,889 and INR 15,673. In comparison, Bhor (HI - INR 14,770 and PI - INR 10,561) and Velhe (HI - INR 14,793 and PI – INR 10,430) have the least incomes.
Figure 4.3: CTTS: Income Levels
Household Ownership
The distribution of households by ownership reveals that 71% of families have their own house in PMR. The ownership level in PMR Planning Area is highest with 79%, followed by PCMC with 69%. Among talukas, ownership share is highest in Purandar (97%), followed by Velhe (96%), whereas the lowest is in Haveli (68%). Among municipal councils, ownership share is highest in Saswad (96%) and lowest in Chakan (58%).
The share of rental housing is higher in urbanized areas like PCMC, PMC, Alandi, Chakan, and Haveli.
Household Typology
Predominant household typology in PMR is individual houses with 56% of the total dwellings. Within PMC, the share of flats/apartments is almost equal to individual homes. Among the share of kutcha/huts, a higher share is observed in PMC and PCMC than in the PMR Planning/Study Area.
4.4 Housing supply in PMR
Table 4.4 shows the supply of housing units in the Pune Metropolitan Region categorised by provider type.
| Stakeholder/scheme | Total | PMC | PCMC | Other ULBs PMR Planning Area | |
| Government Sector Housing Units | 2,48,715 | 1,99,824 | 39,493 | 4,363 | 5,035 |
| MHADA | 8893 | 2,343 | 2,187 | 4,363 | - |
| SRA | 2,00,261 | 1,65,000 | 35,261 | ||
| PMAY | 8,310 | 4,078 | 4,232 | 5,035* | |
| BSUP | 20,528 | 20,528 | |||
| Total Residential Census Houses | 20,71,833 | 7,31,648 | 4,08,278 | 1,82,802 | 7,42,654 |
Source: Housing Census, Secondary research, Ministry of Rural Housing, Economic Survey of Maharashtra, MHADA, SRA
Integrated Townships and Town Planning schemes
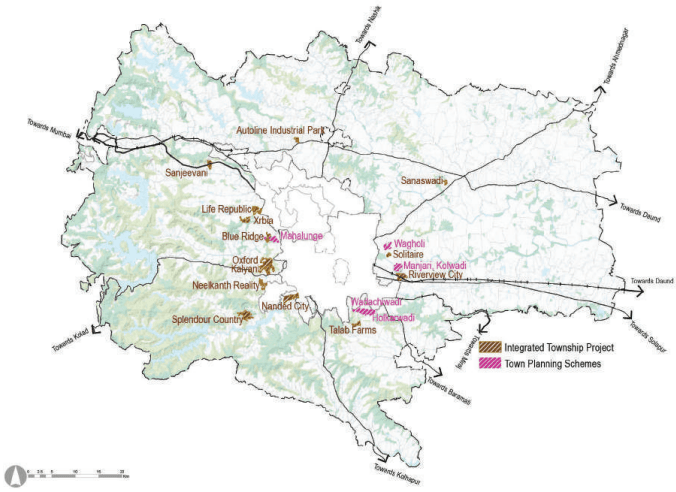
Integrated Townships: The latest Integrated Township Policy stipulates that a minimum of 40 hectares of contiguous land is required with a minimum of 18 m wide access road to get permission for a township. The policy also stipulates the land requirements for public amenities and services like gardens, playgrounds, schools, economic activities, transportation network, etc. The remaining area can be utilized for residential purposes.
Townships are predominantly coming up in the western part of the Planning Area. Most of them are coming up within 10 km from municipal limits of Pune and Pimpri-Chinchwad. Town Planning Schemes are predominantly located in the eastern part of the Planning Area.
Town Planning Scheme: The preparation and execution of a Town Planning Scheme is based on the Maharashtra Regional and Town Planning Act 1966. Chapter 5 of the MRTP Act details the process of making Town Planning Schemes. The scheme’s main purpose is to ensure orderly development, whether it be for implementing Development Plan proposals or any land that is likely to be in the course of development. It helps create new towns-like development or integrated developments through the pooling of land required for public purposes in respect of the plan or for purposes connected with the implementation of such a scheme. As per Section 64 of the MRTP Act, 50% of the land is planned for public purposes such as EWS/affordable housing, roads, open spaces and social infrastructure. The remaining 50% of the land is given back to the original landowners.