Chapter 17Self Sufficient: Housing and Amenities Proposal
Housing is a critical piece of urban service delivery. The Planning Area comprises primarily areas classified as rural and adjoining peripheral areas of urban local bodies. However, the projected population growth rate of 3.1% per annum will lead to rapid urbanisation, posing development pressure in peripheral regions of urban local bodies. The Development Plan aims at providing inclusive development by evaluating the housing provisions through affordability, resilience, low carbon and smart city lenses.
17.1 Self-sufficient: Objectives and Actions
Under the Vision framework, housing objectives are proposed under the Self-sufficient goal. These objectives promote an integrated approach to regulate residential growth, arrest sprawl like development, seize degradation of the environment and help in providing adequate infrastructure for a better liveable habitat. Following actions are proposed in the Vision Framework in order to materialise these objectives into the planning process.
Table 17.1Objectives and Actions
Objectives
Actions
Provide adequate and
Action 1: Town planning schemes for implementing strategic projects
affordable housing for all
Action 2: Public housing at each growth centre
Guide integrated and
equitable neighbourhood
Action 3: Provide equitable distribution of open spaces and social amenities
development
Develop compact
residential development
Action 4: Promote Work-Live concept and develop compact residential development
along major transit
along transit corridors
corridors
Walkable Neighbourhoods
The Live Hubs promote the integration of various sectors such as mobility planning, economic development, ecosystem conservation, utility infrastructure development and recreational sector into land-use planning, given the desire to enhance resilience and low carbon approach in the urban framework. Housing is one of its critical components and must comprehensively address the needs of all the segments of the social structure. Compact and inclusive development is the key to such development.
17.4Inclusive Housing Strategy
The housing strategy proposes to ensure housing supply to be met through inclusiveness via development concepts of walkable neighbourhoods with equal distribution of amenities, low-cost housing and ensuring newer developments such as TPS and ITPs for quality and well-integrated development. It aims to reduce housing vacancy and create a vibrant, sustainable and inclusive rental housing market through land reservations and PPP models. This will enable PMRDA to shift its role from a provider to a facilitator for affordable housing.
The income classification as per MHADA guideline is assumed as a day-to-day scenario. The income groups analysis shows that the PMR (Urban) has a considerable portion of EWS and LIG households (approximately 94%). The share is further assumed to be similarly consolidated towards the affordable housing segment. However, MIG and HIG housing share is also expected to increase, considering the planning initiatives planned for the region till 2041 and beyond. The shares assumed for the income segments in the future (till 2041) are shown in Table 11.6. The same has been assumed based on the study of other similarly positioned urban metropolitan areas in India such as Nagpur, Mumbai Metropolitan Region, Bangalore Metropolitan Region.
Table 17.5Household Split as per Income Groups
Sr No
Income Group
2018 (Exist-ing)
2021
2031
2041
1
EWS
55%
390,802
55%
502,566
50%
546,738
41%
2
LIG
38%
270,009
38%
402,053
40%
560,073
42%
3
MIG
6%
42,633
6%
80,411
8%
160,021
12%
4
HIG
1%
7,105
1%
20,103
2%
66,675
5%
5
Total
100%
710,549
100%
1,005,132
100%
1,333,507
100%
Proposed Housing distribution
The housing distribution estimates are achieved through residential zones, land reservations for public housing and Town Planning Schemes.
Proposed Residential Zone and its distribution: Work-Live Hubs
Live-Work is an urban planning strategy that focuses on bringing the workplace closer to residential areas, reducing commuting time to work. The average trip lengths between the workplace and home need to be reduced to achieve the goal of “Convenience.” To achieve this, employment opportunities need to be created within the Growth Centres for at least 30% of resident workers. Remaining 70% resident workforce is connected to other urban nodes utilizing a mass transport system based on the hub-and-spoke network model, i.e. develop a mass transport interchange within each Growth Centre to serve its residents and connect such interchange with each other and with municipal corporations through mass transport corridors.
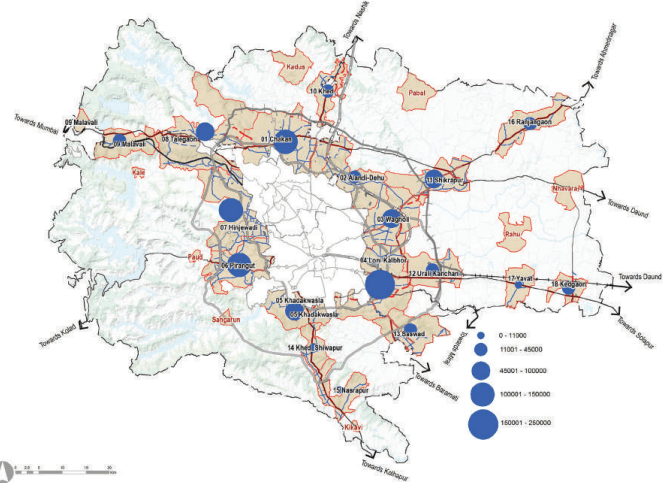
The Growth Centres around municipal corporations (PMC and PCMC) form the Work-Live Hubs. The bulk of the proposed residential area is located in Loni Kalbhor, Pirangut, Chakan, Hinjawadi, Khadakwasla and Wagholi Growth Centres, in proximity to employment nodes.
The residential land requirement by 2041 is estimated for the proposed 18 Growth Centres that would require a total of 10.49 lakh houses including existing ones. Out of this requirement, ITPs and TPSs cover 2.81 lakh houses. For the remaining 7.86 lakh houses, total residential area of 374.67 sqkm has been proposed in all 18 Growth Centres by considering residential density of 125 ppl/ha and 45% top-up (15% amenity, 10% open space and 20% roads). Total proposed gross land under residential zones including ITP/TPS, approved layouts and new residential
Chapter 17: Self Sufficient: Housing and Amenities Proposal
area is 401.87 sqkm. The boundries of ITP schemes whose master plans are approved and are inforce, are marked as overlay while zone under it is maintained as per the proposals of RP 1997 at the time of its sanction. Figure 17.1 explains the housing requirements and corresponding residential land distribution within the Growth Centre.
Figure 17.1: Household Distribution and Residential Zone Proposed
Table 17.6Proposed Housing Requirement and Residential Zone Distribution
Growth Centres
Existing Household(2018)
Total Projected House-holds (2041)
Total Proposed Residential Zone (sq km)
% Share of R Zone
Chakan
42,946
107,568
43.66
11.7
Alandi
Town Planning Schemes
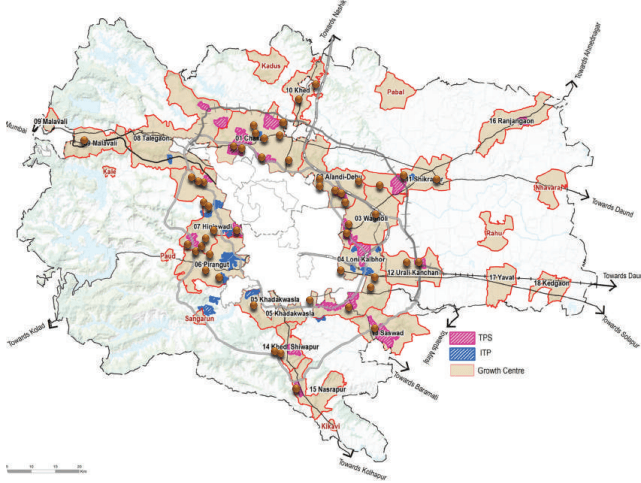
26 Town Planning Schemes are proposed in Urban Growth Centre for the newly opened up residential areas, which accounts for 109.32 sqkm land in addition to the existing six town planning schemes. PMRDA envisages implementing the Development Plan proposals by enabling the provision of Town Planning Schemes and also to achieve the proposed economic role of each of the growth centres. Strategic projects such as Life Sciences Park, Crescent Railway and Station, Multimodal hub and Metro & Metro Depot, Logistic Hub, Town Centre, Education Hub, etc and other neighbourhood level amenities are to be implemented using the Town Planning Schemes. However, Authority has to quickly initiate the process for declaration of intention to undertake the TP Schemes under the MR & TP Act of 1966.
Chapter 17: Self Sufficient: Housing and Amenities Proposal
Figure 17.2: Proposed Town Planning Schemes and Public Housing
17.2Existing Housing Situation
Understanding the existing housing trends and situations is necessary to analyse gaps and propose housing strategies to address those gaps. It is clear that most of the Planning Area is currently rural, but the economic transition will lead to urbanisation within the Planning Area. Following sections cover the details of the existing population and household as well as its growing trends.
Summary of Existing Population and Household
The PMR Study Area population increased from 13.4 lakh in 2001 to 17.1 lakh in 2011. It was estimated to be 26.3 lakh in 2018 and amounts to 28.6% of the total PMR population (91.67 lakh). Population density of the Planning Area has increased from 217 persons per sq km in 2001 to an estimated density of 329 persons per sq km in 2018.
As per the 2011 Census, the total household in the Study Area was 366,954 units. This is estimated at 608,009
household units by 2018 by considering the population of sanctioned ITP schemes, TPS and layouts. The Household size of the PMR Study Area is estimated to be 4.4 in 2018, a reduction from 5.12 in 2001. The existing number of households in 2018 for Growth Centres is 3,98,287 while for the rural area it is 2,04,451.
Existing Housing Situation
Residential Land Use occupies 80.83 sq km as per ELU data. It is scattered across the Study Area, whereas distribution becomes denser in the fringes (3 to 5 km) of municipal corporations and along the Pune-Mumbai and Pune-Ahmednagar Corridors.
Based on the building permissions data it is observed that five talukas namely Haveli, Khed, Mawal, Mulshi and Shirur has a dominant 98% share of the total built-up area under sanctioned residential layouts with Haveli covering 52% of the built-up area followed by Mulshi with 28% built-up.
Approved Residential layouts in PMRDA are predominantly located along the Pune-Mumbai and Pune-Ahmednagar transit corridors. They are also seen in pockets between the national highway and railway lines of Pune-Mumbai and Pune-Daund. Khed Rajgurunagar, Talegaon Dabhade, Shikrapur, Talegaon Dhamdhere, Nasarapur serve as residential areas for nearby industrial estates.
Other planned Residential areas in PMR are Integrated Townships and Town Planning Schemes. Townships are predominantly coming up in the western part of the Planning Area, most of them coming up within 10 km radius from municipal limits of Pune and Pimpri Chinchwad. Town Planning Schemes are predominantly located in the eastern part of the Planning Area. Table 17.2 and Table 17.3 give the details of these TPSs and ITPs as per respective TPS Reports.
13,710
22,135
12.5
3.3
Wagholi
40,638
80,936
40.05
10.7
Loni Kalbhor
38,359
206,494
41.8
11.2
Khadakwasla
34,869
95,045
10.84
2.9
Pirangut
42,844
132,197
34.15
9.1
Hinjawadi
29,175
109,369
33
8.8
Talegaon
34,316
66,353
41.75
11.2
Malawali
18,989
29,609
18.94
5.1
Khed Rajgurunagar
10,474
19,431
10.75
2.9
Shikrapur
23,564
46,560
19.63
5.3
Uruli Kanchan
19,616
27,463
15.29
4.1
Saswad
4,531
19,790
10.53
2.8
Khed-Shivapur
5,521
7,682
4.76
1.3
Nasrapur
7,212
10,523
7.22
1.9
Ranjangaon
18,704
41,191
17.4
4.7
Yawat
5,281
7,322
3.96
1.1
Kedgaon
7,539
11,316
7.03
1.9
Total
398,287
1,040,985
373.26
100
Rural Areas
2,98,759
28.61
Total PMR
13,48,379
401.87
Affordable Housing
It is projected that urban-rural migration will be key in population growth. Thus, by 2041 the demand for affordable housing will increase. EWS household estimation for 2041 is 41%, and that of LIG is 42%. With the positive economic transition, affordable households would still need to be provided.
Under the Pradhan Mantri Awas Yojana (Urban) Programme launched by the Ministry of Housing and Urban Affairs (MoHUA) following programme verticals are proposed:
“In Situ” slum redevelopment
Affordable housing through a credit-linked subsidy scheme (CLSS)
Affordable Housing in Partnership with Public and Private sectors (AHP)
Subsidy for beneficiary-led individual house construction/enhancement (BLC)
60 Public Housing Reservations are proposed. 153.42 ha (42 nos.) land is reserved for public housing for PMAY schemes while 55.28 ha (18 nos.) land is proposed for MHADA housing. Assuming an average FSI of 2.5, a total of 1.32 lakh households could be achieved to have affordable housing.
Besides this, the integrated townships also provide sufficient space for the construction of small tenements for EWS and LIG categories referred to as ‘Social Housing Component’, with 15% FSI of the basic residential FSI. Out of this component, 25% FSI is utilised exclusively to construct EWS tenements and the remaining 75 % FSI may be used for LIG tenements.Out of the total tenements constructed as Social Housing component, one third (1/3rd) tenements shall be kept for Rental Housing tenements which will be disposed on Rent only by the project Proponents (UDCPR 2020). Thus, Integrated Townships are also inclusive and cater to the need for the lowincome groups, which are a major share in projected housing demand. To the extent of 10% land would be available for EWS housing through Town Planning Schemes.
Chapter 17: Self Sufficient: Housing and Amenities Proposal
8
Sanjivani Integrated township- Urse & Adhe
103
25,845
6,627 Talegaon
9
Solitaire - Manjari
44
11,006
2,822 Loni Kalbhor
10
Riverview City-Kadamvakwasti
216
54,094
13,870 Loni Kalbhor
11
Kul Ecoloch
52
12,899
3,307 Hinjawadi
12
Sanaswadi
42
10,527
2,699 Shikrapur
13
Kaleidoscope- Bhugaon
61
15,318
3,928 Pirangut
14
Nilkanth- Bhugaon
100
24,905
6,386 Pirangut
15
Gulbakshi- Bhugaon
69
17,287
4,433 Pirangut
16
Splendour Country
288
71,985
18,458 RA
2,018
504,521
129,364
The income classification for the PMR Study Area as established under the CTT study is shown in Table 17.4. It is used as the basis for income-based classification of households such as EWS, LIG, MIG and HIG. These income groups are based on monthly income as defined under the MHADA guidelines and are shown in Table 17.4.
Table 17.4Income Classification as per CTT Study
No
Monthly Income
% Share of PMR Study Area
Income Grouping as Per MHADA
1
2,000 - 5,000
1%
2
5,001 - 7,500
3.5%
3
7,501-10,000
9.5%
55% EWS
4
10,001-15,000
20.1%
5
15,001-20,000
21.1%
6
20,001-30,000
20.6%
7
30,001-40,000
10.3%
38% LIG
8
40,001-50,000
6.6%
9
50,000 - 1 lakh
6.0%
6% MIG
10
Greater than 1 lakh
0.7%
1% HIG
Accordingly, distribution of households by income groups in the Planning Area as of 2017 includes 56% EWS, 38% LIG, 6% MIG and 1% HIG households.
17.3Housing Demand
The Study Area’s total population in 2041 is projected to be 53.71 lakh, with 40.74 lakh being urban (Growth Centres) and 12.97 lakh being rural. Average Household Size for the Study Area would be four by 2041, whereas the same for urban areas is expected to be 3.9 and 4.4 for the rural area. Household size is estimated to shrink with rising education levels, reducing household level affordability and increasing living costs. Based on the URGD method, estimated minimum housing demand within the Study Area by 2041 would be 13.34 lakh homes (urban 10.41 lakh, rural 2.93 lakh) including existing ones.
The projected housing requirement for rural areas is 292,523 ie. 22% of the requirement of the total households. Residential land required for the rural population would be supplied by allowing Gaothan expansion from Gaothan boundary. However, an integrated strategy needs to be in place for a total of 10.41 lakh homes. Table 11.7 gives
the breakup of the distribution of households in Growth Centres.
Out of the 10.41 lakh households in Growth Centres, almost 12 % of the households, i.e. 129,364 households, are provided through Integrated Townships, and details are mentioned in Table 11.3. Six town planning schemes are proposed in PMR amounting to 152,179 homes, i.e. 14% of the projected demand for 2041.