Chapter 10Socioeconomic Analysis - Demographics and Economic Situation Analysis
This chapter and the next chapter cover socioeconomic analysis - analysis of existing socioeconomic conditions and prospects of Pune district and the Study Area. It consists of four parts - (i) existing demographic and economic situation analysis, (ii) regional economic positioning, (iii) economic transition strategy and (iv) projections for populations, households and employment by 2041.
The output of these analyses has guided the formulation of the overall vision for PMR and quantification of gross land quantum for various employment generating uses and residential uses.
This chapter covers the first part - existing demographic and economic situation analysis. The statistical study of demographic indicators helps understand the change in demography and economy of a region. This chapter discusses the spatial distribution of the population residing within the PMR Planning Area analyzed using the ELU database. It elaborates the trend observed in key demographic statistics for the area, population, household size, density, etc. from 1991 to 2011 at PMR Study Area and taluka levels. It will then discuss the economy of Pune district and PMR along with inferences drawn from the economic analysis and end with a summary of key findings.
10.1Methodology
Land Use Planning for Study Area is based on assessment and projections of three key indicators - population, households and employment.
Projections are carried out for 2018, 2021, 2031 and 2041 for planning purposes. Most of the existing statistical information is available at taluka/district/state level, whereas Study Area is defined with villages (814 villages). This necessitated compilation of indicators mentioned above at the village level in the following manner:
Census data (1991, 2001, 2011) provides village wise population, households and employment information. It is used as a base for projecting population, households and employment for 2018, 2021, 2031 and 2041.
There is always a risk of linear projections based on only Census data since it does not capture the effects of major socio-economic disruptions that may occur between Census surveys. To avoid this, two more datasets have been referred to, namely- Directorate of Economics and Statistics (DES) data and Household Survey data collected under the Comprehensive Traffic and Transport Study by PMRDA in 2018.
District level data from Directorate of Economics and Statistics provides the total number of persons employed by economic sectors and by establishments (Report on Sixth Economic Census Maharashtra State 2013-14).
Study Area’s employment data (Census 2011) is projected till 2014 and subdivided into above economic sectors based on sector-wise shares depicted in the Sixth Economic Census of Maharashtra 2013-14.
Numbers have been ratified using sector-wise employment findings from the CTTS Household Survey.
Population projections are carried out for the Study Area and Pune Metropolitan Region separately. Forecasts for the Study Area are based on arithmetic and URGD methods where village wise population, households and employment is projected.
Incremental increase method is used to project population for municipal councils, whereas the projections for PMC, PCMC and cantonments are retained as per CTTS.
10.2Demography: Pune Metropolitan Region (PMR)
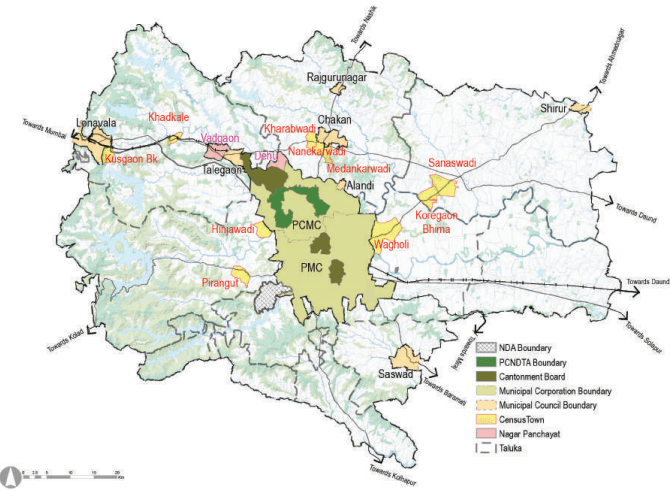
Pune Metropolitan Region covers 6,914.26 sq km area, which is 44.20% of Pune district’s area. According to Census 2011, the total PMR population is 73,21,367, which is 77.64% of Pune district population. Within PMR, 78.66% of people live in urban areas while the remaining 21.34% population is concentrated in rural areas. Taluka wise summary of settlements under PMR with their population is presented in Table 10.1.
Figure 10.1: Location of settlements in PMR
Source: GIS Database,
Table 10.1Taluka wise Population Distribution across Pune Metropolitan Region - Census 2011
No
Taluka
Urban Population
Rural Population
Total Popula-tion
Percentage of PMR Population
Settlement
Pop. 2011
Settlement
Pop. 2011
Pop. 2011
1
Pune city
PMC
33,71,626(2018)
-
-
35,22,091
48.11
Canton.-2
1,50,465
Total
35,22,091
2
Haveli
PCMC
17,27,692
Villages:104
3,90,949
22,18,556
30.30
Canton.-1
48,961
Census town-1
33,479
Dehu NP
17,475
Total
18,27,607
3
Mawal
Lonavala MC
57,698
Villages:187
2,18,076
3,76,943
5.15
Talegaon MC
56,435
Vadgaon-NP
15,687
Census town-2
29,047
Total
1,58,867
4
Mulshi
Census town-2
25,633
Villages:142
1,44,733
1,70,366
2.33
5
Khed
Alandi MC
28,645
Villages:111
2,59,783
3,89,117
5.31
Rajguru MC
25,146
Chakan MC
41,113
Census town-3
34,430
Total
1,29,334
6
Shirur
Shirur MC
37,111
Villages:66
2,30,264
2,94,034
4.02
Census town-2
26,659
Total
63,770
7
Purandar
Saswad MC
31,821
Villages:38
55,902
87,723
1.20
8
Bhor
-
-
Villages:53
68,320
68,320
0.93
9
Velhe
-
-
Villages:52
26,866
26,866
0.37
10
Daund
-
-
Villages: 51
1,67,351
1,67,351
2.29
Total
Municipal Councils
2,77,969
Total
Nagar Panchayats
33,162
Total
Cantonments
1,99,426
Total (Planning Area)
Census Towns:10
1,49,248
Rural Villages: 804
15,62,244
17,11,492
Grand Total (PMR)
24
57,59,123
15,62,244
73,21,367
100
%
78.66%
21.34%
Source: Census 1991, 2001, 2011
Table 10.2Population of Census Towns - Census 1991, 2001, 2011
No
Taluka
Census Town
Census 1991
Census 2001
Census 2011
1
Haveli
Wagholi
9,004
17,743
33,479
2
Mawal
Khadkale
6,001
9,804
13,435
3
Kusgaon
4,982
8,567
15,612
4
Mulshi
Hinjawadi
2,971
5,407
11,459
5
Pirangut
3,402
6,040
14,174
6
Khed
Kharabwadi
2,059
4,267
9,200
7
Nanekarwadi
1,623
5,112
12,654
8
Medankarwadi
1,708
4,066
12,576
9
Shirur
Koregaon Bhima
4,533
8,999
13,116
10
Sanaswadi
4,407
8,356
13,543
Total
40,690
78,361
1,49,248
Source: Census 1991, 2001, 2011
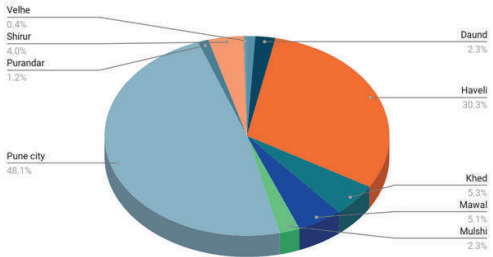
Figure 10.2: Taluka wise Population Distribution across Pune Metropolitan Region - Census 2011
As per Census 2011, PMR population is 73.21 lakh. While PMC and PCMC constitute about 46.05 % and 23.59 % of the total population respectively, cantonments and municipal councils constitute only 2.72 % and 3.79 % respectively. The decadal population growth rate from 2001 to 2011 for PMR was 37.46 %.
Table 10.3Urban-Rural composition in PMR - Census 2011
Urban
Rural
Total
Pop. 2011
%
Pop. 2011
%
Pop. 2011
Pune District
57,51,182
60.99%
36,78,226
39.01%
94,29,408
PMR Total Area
PMC
31,24,458
58.54%
PCMC
17,27,692
30.00%
MC
2,77,969
4.83%
NP
33,162
0.58%
Canto.
1,99,426
3.46%
CT
1,49,248
2.59%
Total
55,11,955
78.66%
15,62,244
21.34%
73,21,367
Source: Census 1991, 2001, 2011
Figure 10.3: Urban-Rural composition in PMR - Census 2011