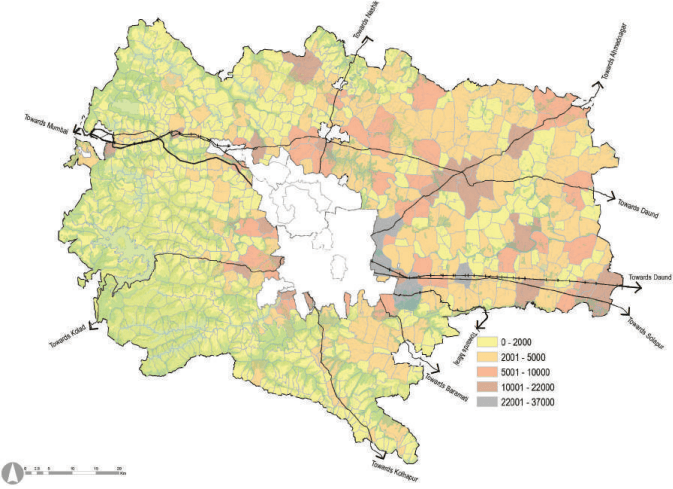
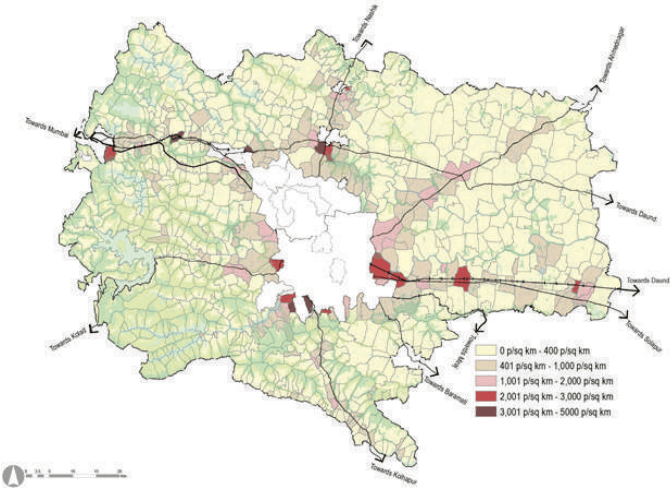
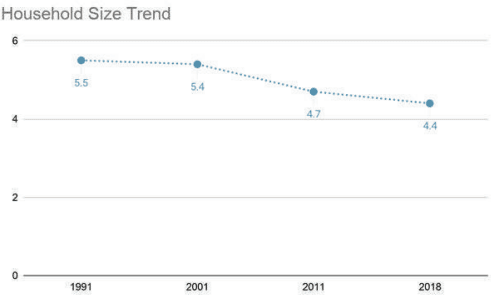
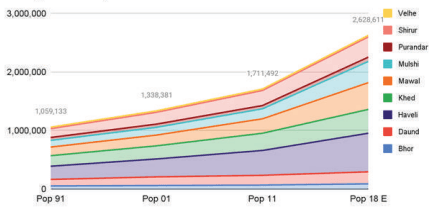
Pune Metropolitan Region covers 6,914.26 sq km area, which is 44.20% of Pune district’s area. According to Census 2011, the total PMR population is 73,21,367, which is 77.64% of Pune district population. Within PMR, 78.66% of people live in urban areas while the remaining 21.34% population is concentrated in rural areas. Taluka wise summary of settlements under PMR with their population is presented in Table 10.1.
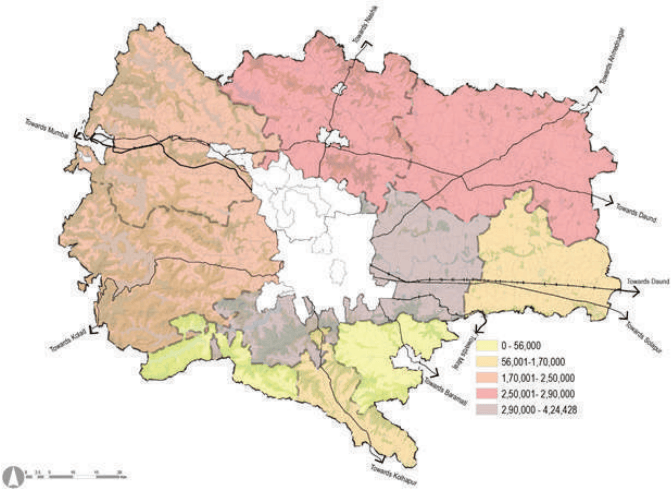
Figure 10.1: Location of settlements in PMR
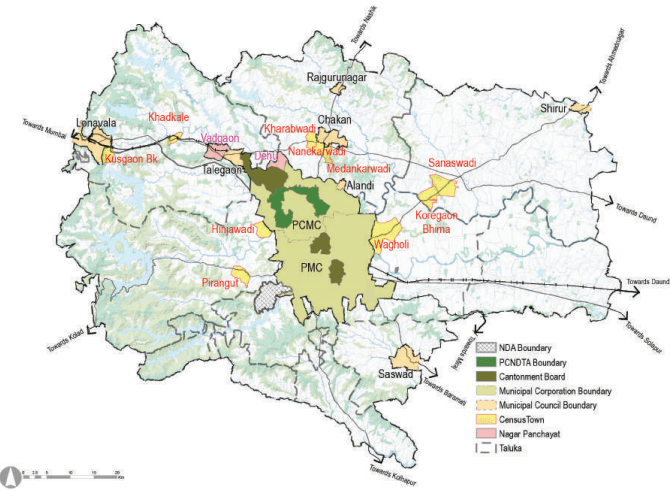
Source: GIS Database,
| No | Taluka | Urban Population | Rural Population | Total Popula-tion | Percentage of PMR Population | ||
| Settlement | Pop. 2011 | Settlement | Pop. 2011 | Pop. 2011 | |||
| 1 | Pune city | PMC | 33,71,626(2018) | - | - | 35,22,091 | 48.11 |
| Canton.-2 | 1,50,465 | ||||||
| Total | 35,22,091 | ||||||
| 2 | Haveli | PCMC | 17,27,692 | Villages:104 | 3,90,949 | 22,18,556 | 30.30 |
| Canton.-1 | 48,961 | ||||||
| Census town-1 | 33,479 | ||||||
| Dehu NP | 17,475 | ||||||
| Total | 18,27,607 | ||||||
| 3 | Mawal | Lonavala MC | 57,698 | Villages:187 | 2,18,076 | 3,76,943 | 5.15 |
| Talegaon MC | 56,435 | ||||||
| Vadgaon-NP | 15,687 | ||||||
| Census town-2 | 29,047 | ||||||
| Total | 1,58,867 | ||||||
| 4 | Mulshi | Census town-2 | 25,633 | Villages:142 | 1,44,733 | 1,70,366 | 2.33 |
| 5 | Khed | Alandi MC | 28,645 | Villages:111 | 2,59,783 | 3,89,117 | 5.31 |
| Rajguru MC | 25,146 | ||||||
| Chakan MC | 41,113 | ||||||
| Census town-3 | 34,430 | ||||||
| Total | 1,29,334 | ||||||
| 6 | Shirur | Shirur MC | 37,111 | Villages:66 | 2,30,264 | 2,94,034 | 4.02 |
| Census town-2 | 26,659 | ||||||
| Total | 63,770 | ||||||
| 7 | Purandar | Saswad MC | 31,821 | Villages:38 | 55,902 | 87,723 | 1.20 |
| 8 | Bhor | - | - | Villages:53 | 68,320 | 68,320 | 0.93 |
| 9 | Velhe | - | - | Villages:52 | 26,866 | 26,866 | 0.37 |
| 10 | Daund | - | - | Villages: 51 | 1,67,351 | 1,67,351 | 2.29 |
| Total | Municipal Councils | 2,77,969 | |||||
| Total | Nagar Panchayats | 33,162 | |||||
| Total | Cantonments | 1,99,426 | |||||
| Total (Planning Area) | Census Towns:10 | 1,49,248 | Rural Villages: 804 | 15,62,244 | 17,11,492 | ||
| Grand Total (PMR) | 24 | 57,59,123 | 15,62,244 | 73,21,367 | 100 | ||
| % | 78.66% | 21.34% | |||||
Source: Census 1991, 2001, 2011
| No | Taluka | Census Town | Census 1991 | Census 2001 | Census 2011 |
| 1 | Haveli | Wagholi | 9,004 | 17,743 | 33,479 |
| 2 | Mawal | Khadkale | 6,001 | 9,804 | 13,435 |
| 3 | Kusgaon | 4,982 | 8,567 | 15,612 | |
| 4 | Mulshi | Hinjawadi | 2,971 | 5,407 | 11,459 |
| 5 | Pirangut | 3,402 | 6,040 | 14,174 | |
| 6 | Khed | Kharabwadi | 2,059 | 4,267 | 9,200 |
| 7 | Nanekarwadi | 1,623 | 5,112 | 12,654 | |
| 8 | Medankarwadi | 1,708 | 4,066 | 12,576 | |
| 9 | Shirur | Koregaon Bhima | 4,533 | 8,999 | 13,116 |
| 10 | Sanaswadi | 4,407 | 8,356 | 13,543 | |
| Total | 40,690 | 78,361 | 1,49,248 |
Source: Census 1991, 2001, 2011
Figure 10.2: Taluka wise Population Distribution across Pune Metropolitan Region - Census 2011
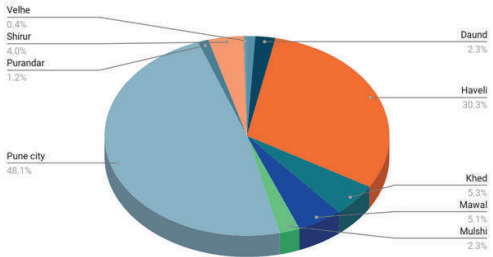
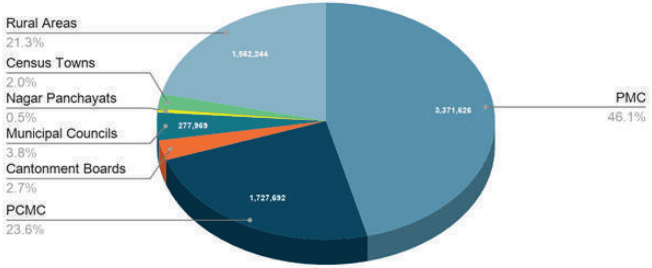
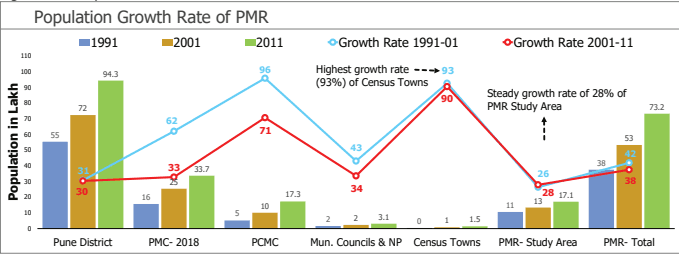
As per Census 2011, PMR population is 73.21 lakh. While PMC and PCMC constitute about 46.05 % and 23.59 % of the total population respectively, cantonments and municipal councils constitute only 2.72 % and 3.79 % respectively. The decadal population growth rate from 2001 to 2011 for PMR was 37.46 %.
| Urban | Rural | Total | ||||
| Pop. 2011 | % | Pop. 2011 | % | Pop. 2011 | ||
| Pune District | 57,51,182 | 60.99% | 36,78,226 | 39.01% | 94,29,408 | |
| PMR Total Area | PMC | 31,24,458 | 58.54% | |||
| PCMC | 17,27,692 | 30.00% | ||||
| MC | 2,77,969 | 4.83% | ||||
| NP | 33,162 | 0.58% | ||||
| Canto. | 1,99,426 | 3.46% | ||||
| CT | 1,49,248 | 2.59% | ||||
| Total | 55,11,955 | 78.66% | 15,62,244 | 21.34% | 73,21,367 | |
Source: Census 1991, 2001, 2011
Figure 10.3: Urban-Rural composition in PMR - Census 2011