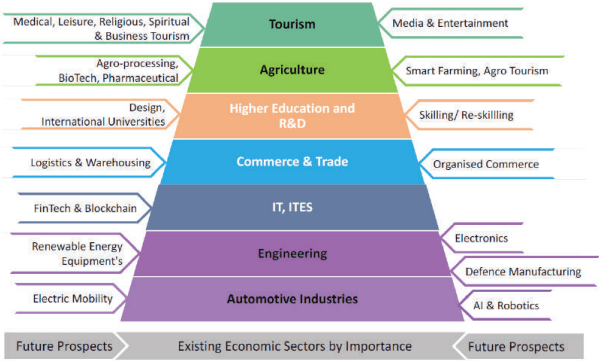
The truncated pyramid represents the PMR economy. The base constitutes four sectors indicating high productivity. The top two sectors denote weak productivity with untapped potential, and the middle sector - research and education demonstrates its strategic importance by serving a skilled workforce for all the sectors. Refer to Figure 11.8.
Chapter 11: Regional Economic Positioning and Socio-economic Projections
Figure 11.8: Existing Economic Base and Proposed Catalysts
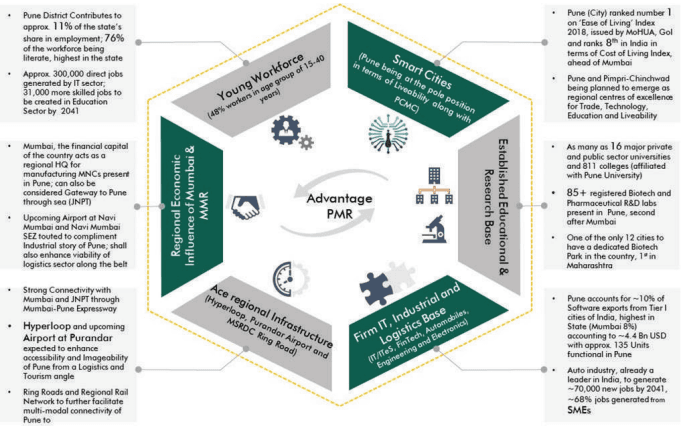
Although Pune’s key strengths are manufacturing (automobile and engineering), IT/ITES, education and research and emerging biotech, pharma industry, other cities have already established their stronghold at the national level. For example, automobile manufacturing has been a stronghold of Chennai. Bangalore supersedes Pune in terms of IT exports, the number of higher education institutes and innovation quotient (patents filed), and biotech sector output. Hyderabad is India’s Pharma hub. Moving forward, prospects for higher Quality of Life (QOL), relatively lower cost of living, and the availability of economic opportunities would be the key differentiator for PMR to sustain its economic competitiveness. Figure 11.9 highlights the regional economic competitiveness of PMR.
Figure 11.9: Regional Economic Competitiveness of PMR
Strategic regional infrastructure development projects and external development initiatives are likely to improve PMR’s attractiveness for investments. For example, international airports at Navi Mumbai and Saswad, railway infrastructure up-gradation, Dighi port development, Development Plans for NAINA and MSRDC (71 villages) and PMR level development initiatives such as MIDC planned land consolidation, 2 Ring Roads and Metro proposals are likely to be growth drivers for the Study Area.
PMR is witnessing a spur in investments into auto, engineering, IT/ITESand FMCG (Fast Moving Consumer Goods). While these sectors are foreseen as future employment growth drivers, emerging trends are also assessed to understand prospects for these sectors. It is identified based on market intelligence, understanding emerging global trends, considering government policies and capturing stakeholder aspirations.
Potential Economic Drivers
Proposed economic sectors for the Study Area are organised into three categories as below based on the aspects discussed above:
Hinterland Sectors: Synergies from District Catchment
Automotive (Production and R&D)
High-tech Engineering
Information Technology, IT Enabled Services
Logistics and Warehousing (FMCG, Agriculture Manufacturing and Retail Industry)
• Education, Research and Skill Development
Smart Agriculture (High-value Agriculture, Agri-mechanisation, Traceability of Agriculture and Food)
Wellness Tourism (Hospitals, Wellness Centres, Yoga and Spiritual Tourism, Alternative Medicines)
Demand Pull Sectors: Synergies from Competing Regions
Electronics (for Industries, Government, Services Sector and Agriculture)
Life Sciences (Biotech, Pharmaceuticals, Medical Devices etc.)
Banking, Financial Services and Insurance (BFSI)
• Agro and Food Processing
• Design (Animation and Gaming)
Healthcare
Media and Entertainment
11.1Socio-economic Projections
Socio-economic projections are worked out village wise for 814 villages within PMRDA jurisdiction. Projections are carried out for population, resident workforce/working population and household for 2021, 2031 and 2041 and are based on three historical Census datasets of 1991, 2001 and 2011.
Projections for PMR
Projections are carried out in two parts. Population projections for PMC, PCMC and Cantonments are taken from the CTTS and kept constant. While projecting populations for municipal councils, Planning Areas and Rural Areas, four established methods of population projections such as arithmetic increase, geometric increase, incremental increase and graphical curve method were tested.
Out of these four methods, projections through the geometrical increase method were outliers; as the geometrical increase method projections were more than 10 lakh vis-à-vis projections using the remaining three methods. Thus, they were discarded. Similarly, the projection using the graphical curve method was not adopted as the accuracy is dependent on the skill and experience of the person dragging the curve, which is subjective.
Ultimately, arithmetic increase and incremental increase methods were chosen for detailed village level projections of the study area due to their relevance, as explained below.
Projections for Study Area
The Study Area is organised into two parts - Urban Growth Centres and Rural Area based on the assessment of the urban/rural development potential of 814 villages. Two hundred and thirty-three villages are identified for urban development (referred to as Urban Growth Centres ), and 581 villages are identified for rural development (referred to as Rural Areas). Detailed village-wise population projections are carried out for Urban Growth Centres and Rural Areas separately.
The arithmetic increase method is used for projections of Rural Areas as the growth rates of most of the villages are stabilising/declining.
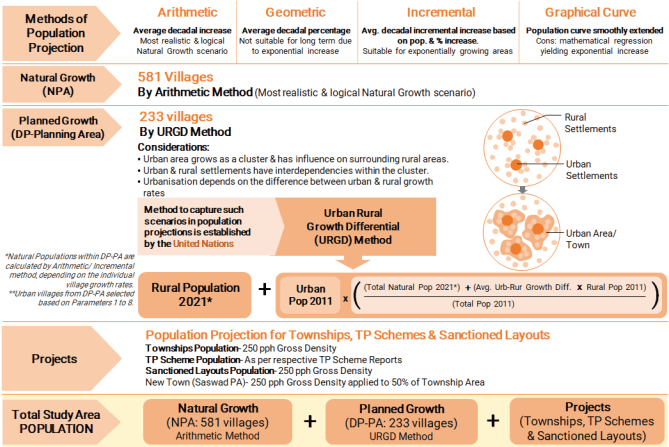
For village wise projections of Urban Growth Centres, the arithmetic or incremental increase method is used based on the individual village’s growth rate. However, just summing up the village-wise populations of urban and rural villages in isolation to project the population of Urban Growth Centres will not be feasible since all the villages are closely linked to each other and not isolated. Thus, for projections of each Urban Growth Centre as a whole, Urban-Rural Growth Differential (URGD) method is used since each Urban Growth Centre contains a mix of interdependent urban and rural villages showing different demographic growth trends.
URGD is the most reliable method for such cases since its formula considers the urban and rural growth difference in relation to the total population while projecting. It is also known as the United Nations method. Pune district level projections in RP 1997 are also based on the URGD method. Urban-Rural Growth Differential rate in the URGD
formula is computed by taking the difference between average urban population growth rate and average rural population growth rate. The remaining methodology of the projection exercise is shown in Figure 11.1.
Figure 11.1: Methodology for Study Area Population Projections
Projections for Rural Areas i.e. 581 Villages
For Rural Areas, the arithmetic increase method is used, where the average increase in population is assumed to be constant from decade to decade. The average increase per decade is found out from the previously available census data (1991, 2001, 2011). This number is multiplied by the number of decades for which the population is to be worked out and is then added to the present population to get the future population after ‘n’ decades.
Where Pn is the future population after n decades, P is the present population, n is the number of decades and d is the average increase per decade.
The total population of 581 villages represents the total Rural Area population for a particular decade.
Projections for Villages under Urban Growth Centres
Evolution of the Study Area shows that its urbanisation level would determine the population growth of Urban Growth Centres, and it would be dependent on the difference between urban and rural growth rates.
‘Urban-Rural Growth Differential’ means the difference between the population growth rate of urban and rural areas. It is observed that the difference is maintained for an indefinite future period without leading to absurd results by using the URGD Method. This is irrespective of the current urbanisation level, total population growth rate, or whether the rural population is increasing or diminishing.
First, villages are classified under rural and urban character based on the parameters satisfied by them as explained in the assessment of urban/rural development potential of 814 villages in Chapter 9. Urban villages are selected based on parameters 1 to 8.
Then, the population for each of the 233 villages is projected, and the total natural population is worked out.
Chapter 11: Regional Economic Positioning and Socio-economic Projections
For village-wise population projections, villages are classified into two categories based on their growth rates from 2001 to 2011. The incremental increase method is used for villages with growth rates more than the average growth rate of 233 villages in Urban Growth Centres. In contrast, the arithmetic increase method is used for villages with growth rates below average. First, the average increase per decade is found out in the incremental increase method, and then the average percentage increase per decade is worked out. The future population is worked out from the following equation:
Pn = P + n * d + (n*(n+1)/2)*t))
Where Pn is the future population after n decades, P is the present population, n is number of decades, d is average increase per decade, t is average incremental increase per decade.
Then, inputs such as urban population, rural population, total population, urban growth rate, and rural growth rate of each village in Urban Growth Centres are inserted in the URGD method formula. Refer to the formula shown in Figure 11.1. The existing urban population will be multiplied with a factor of urban-rural growth differential. The factor considers average urban-rural growth difference for the past three decades, existing rural and total population and future total population projected using arithmetic/incremental increase method. This calculation procedure is adopted for all eighteen Urban Growth Centres.
Urban Population in URGD
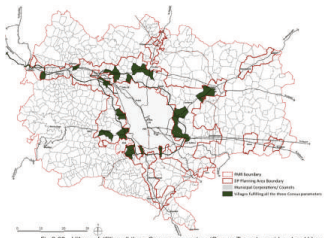
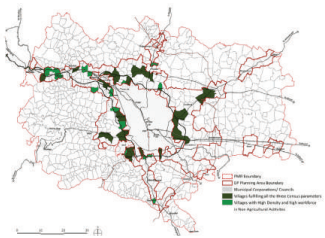
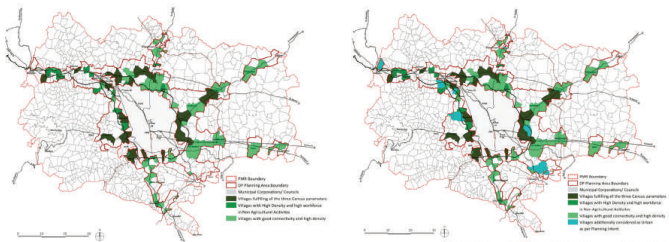
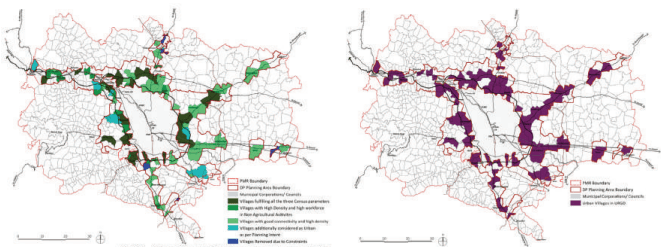
Urban Population in URGD method has been calculated by adding the population of villages categorized as Urban within the DP planning Area. About 104 villages have been categorized as Urban in URGD method. The process of selecting Urban villages is represented through the maps (Fig.11.2 to Fig.11.7) and explained though four steps in the following table (Table 11.1).
Table 11.1Categorizing Urban Villages in URGD
No1
Category of Vil-lages Census Towns
No. of Villages29
Remark Villages are selected as Urban if they fulfil all the three Census parameters of Population >5,000, Density >400 pph, and Main male working population in non agriculture >75%
2
Villages with High Density and high workforce in Non Agricultural Acitivites
21
Further, some more villages qualify as Urban if they fulfil both the following parameters since they indiate that they are already urbanised: 1. Villages having Population Density greater than 400 pph (as per the census definition) 2. Villages having Main Male Working population engaged in non agricultural employment higher than 75%
3
Villages with good connectivity and high density considered as Urban
47
Additionally, villages are shortlisted as Urban if they fulfil both the following parameters they can become an Urban Nucleus within each DP PA in future and attract rural migrants: 1. Villages along National and State Highways, Expressway, proposed Ring Road and with Railway stations 2. Villages having Population Density greater than 400 pph (as per the census definition)
4
Villages Additionally considered as Urban as per Planning Intent
10
Villages are added to Urban Category based on the Planning Intent such as: 1. Villages with proximity to proposed Airport: Vanpuri, Sonori, Dive 2. Villages with presence of Proposed ITP/ TPS: Urse, Manjari Kh. 3. Village with excellent connectivity (Proximity to Highway, Expressway, Ring Road and Railway): Shirgaon 4. Villages with existing IT Cluster: Man, Bhoirwadi 5. Village fully built up: Kune N. M. 6. Village with urbanisation potential due to high Population and Density: Rakshewadi
5
Villages omitted
-5
From above selected villages, 5 villages are omitted, inspite of meeting above criteria, due to constraints. Such villages are Kolwadi, Chivhewadi, Holewadi, Kedgaon, and Sandbhorwadi
The population of various projects in the Study Area such as Townships, Town Planning Schemes and Sanctioned Layouts are calculated based on the following:
PMRDA has approved 16 townships over 2,018 hectares - 15 townships in Urban Growth Centres and 1 in Rural Area. The population of each township is estimated based on the gross residential density of 250 PPH.
Populations of six notified Town Planning Schemes (TPS) are considered as per their respective TPS reports.
The Study Area has about 3,592 hectares of sanctioned layouts, out of which 2,527 hectares are in Urban Growth Centres and 867 hectares in Rural Areas. The population of sanctioned layouts is calculated by considering the gross residential density of 250 PPH.
Promoting greenfield development at Saswad Growth Centre is a planning strategy, considering the proposed Chhatrapati Sambhaji Raje International Airport. Since this Growth Centre does not have an adequate existing population, the projections can not reach a sufficient population required to justify amenities and other public developments. Hence, Saswad Growth Centre’s population is induced by proposing a consolidated residential development of 225 hectares and a gross density of 250 PPH applied to 50% of the area.
To estimate employment and households of the projects in Urban Growth Centres, Workforce Participation Ratio and Household size are projected for 2021 using the incremental increase method. The incremental increase method is used since the projects are majorly present in the villages that show higher than average growth rates. By this method, WFPR comes out to be 48.6%, and household size works out to be 4. These numbers are used to calculate employment and households for the ‘Projects’ population for years 2021, 2031 and 2041.
Total Study Area Population
The total Study Area population is worked out by adding individual populations of Urban Growth Centres, Rural Areas, Townships, TP Schemes and sanctioned layouts.
Employment and households are estimated using the Census 1991, 2001 and 2011 datasets and methodology as explained above.
Population, employment and household projections for each Growth Centre are provided in Table 11.6, 11.7 and 11.8.
Table 11.2Summary of Projections for Study Area
Key Projections
2011
2018
2021
2031
2041
UGC Population
953,579
1,667,369
1,989,629
2,977,366
4,074,098
UGC Employment
417,287
744,827
893,163
1,343,285
1,842,331
UGC Households
210,669
398,287
483,764
745,478
1,040,985
UGC Household Size
4.5
4.2
4.1
4
3.9
UGC Workforce Participation Rates
43.80%
44.70%
44.90%
45.10%
45.20%
RA Population
757,913
961,242
1,048,383
1,172,550
1,296,718
RA Employment
407,437
527,263
577,770
673,299
767,981
RA Household
152,340
204,451
226,785
259,654
292,523
RA Household Size
5
4.7
4.6
4.5
4.4
RA Workforce Participation Rates
53.80%
54.90%
55.10%
57.40%
59.20%
Total Population
1,711,492
2,628,611
3,038,012
4,149,916
5,370,815
Total Employment
824,724
1,272,090
1,470,933
2,016,584
2,610,311
Total Households
363,009
602,739
710,549
1,005,132
1,333,507
Household Size
4.7
4.4
4.3
4.1
4
Workforce Participation Rates
Sustainers
Findings from the demographic and economic analysis point out three main challenges for the Study Area: upgrading skills of the workforce, increasing income levels and raising affordability, addressing the shrinking employment base of the agriculture sector.
These challenges are linked to the livelihood source of 53% of the Study Area workforce, i.e. the agriculture sector, that has been grappling with the lowest productivity (GDP contribution below 5%). Therefore, the economic transition should begin from the agriculture sector. Improving the productivity of the agriculture sector through ‘value addition’ and leveraging the services sector to bridge the gap between production and processing would kick start the economic transition.
The burgeoning service sector (commercial and logistics), which is already absorbing most of the unskilled and semi-skilled workforce of the Study Area, can seamlessly connect the farm and consumer/agro and food processing industry.
Adopting technology for mechanised farming, weather and market predictability, traceability, agricultural research can be the means of improving productivity. Therefore, sectors such as smart agriculture, agricultural biotechnology and FMCG (agro and food processing, supply chain logistics) are seen as employment ‘sustainers’ that would retain the jobs dependent on agriculture. The sectors shall be promoted on the agriculturally productive east side and near the proposed airport, which is seen as a gateway to agrarian districts of western Maharashtra.
Sunrise Sectors : Synergies from Global and India Growth
Innovation and High-tech Industries (Industry 4.0)
Defense Equipment Manufacturing
• Renewable Energy (Biofuels, Methanol, Hydrogen fuel cells, Clean Energy related component manufacturing/ assembly)
Electric Mobility
IoT, AI and Robotics
Blockchain and Fin-tech
Chapter 11: Regional Economic Positioning and Socio-economic Projections
Table 11.3Assessment of Future Potential of Existing Growth Drivers of PMR
Existing Growth Drivers- PMR
Prospects and Potential
Emerging Trends
Automotive Sector
Strong existing infrastructure and investmentPotential for an export oriented as well as domestic market focused production
Smart Manufacturing- Value chain digitisation & use of real-time data, intelligent technology enhancing communication, productivityRobotic technologies - impact reaching into logistics and supply chain organizations. Becoming increasingly important for SMEs to adopt as these technologies take center stageAdditive Manufacturing (3D printing)- customized three-dimensional parts from digital designs
Auto-ancillary
An evolved sector in PMRGoes hand in hand with the automotive sector development
Engineering
Strong employment prospectsNeeds skilling and human resource development for fully utilising technological advancements in the sector
IT/ ITES
Stronghold of the regionPotential to evolve into high innovation IT sectors like AI and Big Data
Network/Cybersecurity- IT audit and penetration test is becoming norm.Internet of Things- IOT having a major impact on smart manufacturing
Banking & Insurance
Growing regional economy fueling banking and insurance penetrationPotential for innovations in FinTech and IT enabled services like Blockchain
Blockchain Technology saving time and cost of processing trade transactions
Education & Research
Stronghold of PuneHuge potential to drive start-ups, innovation, technical skilling and R&D
Foreign Universities with local campusesDigital education, Virtual CampusNewer concepts like Superlabs
Supply Chain Logistics
Emerging in Pune with industrial base & e-commerce penetration;Huge potential to support all sectors, especially FMCG, Agro-processing
Business-to-Business-to-business (B2B) and business-to-consumer (B2C) internet businesses have evolved from basic communications channels to complete end-to-end mediums
Economic Transition Strategy
Historical trends in GDP and employment growth indicate that economy of PMR is in a transition phase, where the primary sector is likely to face a decline in output with a scarcity of workforce, the secondary sector growth rate is likely to slow down, and the services sector would witness significant growth as the Study Area urbanises, over the next two decades. Economic transition strategy essentially addresses this phase by recommending sectors that would play the role of sustainer, enabler or driver of this economic transition to diversify the economy.
Chapter 11Regional Economic Positioning and Socio-economic Projections
The first half of this chapter covers socio-economic projections, and the second half will discuss the regional economic positioning, including economic transition strategy.
Regional economic positioning systematically assesses existing economic drivers and anticipates future drivers. While doing so, it factors in their growth/decline trends into socio-economic projections. This is necessary so that projections do not merely reflect historical trends as recorded in Census data. It lays the foundations of the economic development plan for the Study Area and guides policy formation to boost the region’s economic competitiveness.
Enablers
Tourism, construction and education sectors can ‘enable’ the transition from primary sector employment in the short term. The tourism sector is already established as a source of employment for the rural workforce. Consolidation of this sector is needed by promoting Tourism Getaways, i.e. aggregation of tourism developments representing particular themes. Leisure, Wellness and Adventure tourism in the Western Ghats, Religious/Spiritual tourism on the north side, Heritage tourism on the south/southwest and agro-tourism on the east side of PMR should be incentivised.
Committed public investments in regional infrastructure and downstream real estate development could trigger substantial jobs in the construction sector. Vocational training of the local workforce and skilling centres should be set up on priority by engaging large industries and SMEs.
Employment Projection by Sector: 2011-2041
The URGD method is used to project Planning Area employment by 2041 (along with population and households). The Planning Area would have 26.1 lakh total employment as per the same.
While keeping an ultimate target as 26.1 lakh, the previously mentioned derived sectoral split of 2011 is analysed and projected till 2041 by using the Linear Regression method.
However, as per the Linear Regression method, the share of certain sectors was observed to be constantly decreasing while the same for certain sectors was continually increasing. For example, agriculture’s share would follow the trend and reduce to a single-digit share till 2041. On the other hand, sporadic expansion of IT companies in the late 1990s and early 2000s contributed to an exponential increase in the combined share of the secondary and tertiary sector, which almost doubled between 1991-2011.
Using only these growth rates would have resulted in skewed projections. Therefore, during the regression analysis, both sectoral shares and CAGR are used as variables to project the sectoral employment till 2031, and 2031 figures are tweaked to align with envisaged growth as per planning intent to derive 2041 employment.
The methodology used to project sector-wise employment projections is as follows (Refer to Table 11.4):
Drivers
Manufacturing, IT and the commercial sector are likely to continue as the ‘drivers’ of the economy. As industry majors are already transforming their operations to embrace Industry 4.0, IoT and digitisation for higher productivity, it would require its ancillaries (SMEs) to organise themselves to remain relevant.
SMEs are the largest employment generator and are likely to create substantial new jobs in industrial ancillaries, IT/ITES, e-commerce and supply chain logistics.
Ecosystem requirements of these newer versions of industries will have to be planned proactively by establishing newer IT parks, business parks, logistics clusters and industrial clusters. These could be set up in the north, east and south of the Study Area for balanced regional growth.
Although electronics, life sciences, design (animation and gaming), media and entertainment, defence manufacturing, renewable energy, blockchain and fin-tech are not seen as drivers of the PMR economy, these need to be encouraged to diversify the economy.
Employment Projections
Data Sourcing Limitation
Most of the statistical information is available at the taluka/district/state level, whereas the Study Area/ Planning Area is defined with villages (814 Villages). This necessitated the compilation of data at the village level from the Census 1991, 2001 and 2011.
Census data does not provide employment by each sector. Therefore, the district level report on the Sixth Economic Census Maharashtra State 2013-14 is used to fill this gap.
Derivation of Employment Split by Sector, 2011
As per Census 2011, total employment of the Planning Area was 8.25 lakh. (Refer to Table 11.4)
Table 11.4Employment Scenario of Planning Area Census 1991, 2001, 2011
Employment as per Census Data
1991
2001
2011
CAGR(2001-1991)
CAGR(2011-2001)
Total
450,523
100.00%
629,718
100%
824,724
100%
3.4%
2.7%
employment
Total Primary
333,027
73.9%
434,191
68.9%
438,399
53.2%
2.7%
0.1%
Sector
Agri. Labourers
237,200
52.6%
304,972
48.4%
292,092
35.4%
2.5%
-0.4%
Cultivators
85,735
19.0%
114,168
18.1%
124,533
15.1%
2.9%
0.9%
HH Industries
10,092
2.2%
15,050
2.4%
21,773
2.6%
4.1%
3.8%
Others
117,496
26.1%
195,527
31.0%
386,325
46.8%
5.2%
7.0%
(Secondary &
Tertiary Sector)
As of 2011, primary sector employment was 53% (agricultural laborious, cultivators, and household industries). Census data classifies the rest of the employment as ‘Others’ which was 47%. ‘Others’ represents combined secondary and tertiary sector employment.
Census figures show downward trends in the primary sector share in rural employment from 74% in 1991 to 69% in 2001 and 53% in 2011. By 2011, its GDP contribution was about 4%. Total primary sector employment CAGR between 1991-2001 was 2.7% whereas it was 0.1% between 2001-2011. This aligns with the observed trend of
Chapter 11: Regional Economic Positioning and Socio-economic Projections
shrinking agricultural employment due to the low productivity of the sector and also the rural exodus.
Census 1991, 2001, 2011 figures indicate that the combined share of secondary and tertiary sectors increased from 26% in 1991 to 31% in 2001 and 47% in 2011. Combined secondary and tertiary sector employment CAGR between 1991-2001 was 5.2% whereas it was 7% between 2001-2011. This is in tandem with spillover of the secondary sector (non-manufacturing) activities (construction material production and mining) and tertiary sector activities (logistics, commercial, tourism support, education, health etc.) into the rural areas. This is mainly due to large land uptakes in rural areas and the higher cost of operations in urban areas.
In order to understand the break up of the secondary and tertiary sector by 2011, the ‘Others’ category of employment is subdivided using the sectoral shares depicted in the Sixth Economic Census of Maharashtra 2013-14.
The resultant split is regrouped into the secondary and tertiary sector. Thus, the sectoral employment breakdown of 2011 is derived for the primary sector (53%), secondary sector (29%) and tertiary sector (18%) for the Planning Area. (Refer to Table 11.4).
Primary Sector
Considering historic data from 1991 to 2011, the share of the primary sector, with respect to overall employment, dropped from 74% to 53%, and CAGR declined from 3% to 0.1% over the
past three decades. 2041 employment is projected considering a CAGR of 1% to ensure that projected employment does not shrink below the 2011 figures of primary sector employment.
This implies retaining rural jobs by improving the productivity of the sector as per the proposed economic transition strategy. The resultant share of the primary sector would reach 25% of total employment by 2041.
Table 11.5Employment Projections
No
Employment Projec-tion
2011*Share
2011Share
2011
2021
2031
2041
2041Share
CAGR
1
Primary
53.16%
438,399
702,033
766,255
652,578
25.00%
1.4%
23
Secondary (Non-man-ufacturing) Automotive
1.73%
2.65%
21,82614,237
39,97426,211
85,70436,698
122,68565,258
4.70%
6.1%5.4%
4
Auto-ancillary
6.75%
55,631
102,416
127,771
190,553
4.3%
5
Engineering
4.36%
35,937
66,160
92,632
156,619
5.2%
6
Pharma
0.58%
4,752
8,749
16,121
52,206
8.6%
7
Biotech
0.06%
488
898
5,129
33,934
15.8%
8
Electronics
3.42%
28,193
51,902
77,437
130,516
5.4%
9
Food processing
0.32%
2,632
4,846
19,359
78,309
12.4%
10
Heavy machinery
0.39%
3,255
5,993
5,496
7,831
3.1%
11
Others
0.62%
5,085
9,362
6,543
2,610
-2.3%
12
Information and communication (including computer system, consulting and related services)
1.61%
13,300
26,569
52,035
91,361
6.9%
13
IT- Other service activities (not classified elsewhere)
6.67%
55,044
95,343
136,079
195,773
4.5%
14
Secondary (Manufac-turing + IT) Sales, Maintenance and Repair
1.38%
26.5%
218,55511,352
398,44729,419
575,29950,415
1,004,97073,089
38.50%
5.4%6.6%
15
Wholesale trade
1.24%
10,257
32,361
53,843
78,309
7.3%
16
Freight and Storage (with postal and courier work)
2.08%
17,168
40,009
90,746
130,516
7.3%
17
Retail trade
3.91%
23,974
54,425
78,647
104,412
5.2%
18
Restaurants and hotels
2.16%
17,853
31,842
69,846
78,309
5.2%
19
Financial and Insurance Work
0.99%
8,200
14,874
40,099
57,427
6.9%
20
Real estate work
0.56%
4,657
8,305
18,220
31,324
6.8%
21
Arts, Entertainment, Sports and Entertainment (excluding illegal gambling and betting)
0%
10,083
13,052
2.9%
22
Vocational, scientific and technical work (including advertising, marketing, research, and veterinary work)
5.56%
45,877
88,256
127,045
156,619
4.3%
Chapter 11: Regional Economic Positioning and Socio-economic Projections
23
Organized administrative and support service activities (travel agency, routine work and session and organized trade exhibitions)
0%
14,709
16,133
20,882
2.9%
24
Educational
0.39%
3,180
9,561
24,199
54,817
10.3%
25
Human health and social work (including residential and non-residential resident center)
0.42%
3,425
6,720
10,050
31,324
7.9%
Tertiary
17.70%
145,944
330,480
589,326
830,079
31.80%
6.2%
Total Employment
100%
100%
824,724
1,470,933
2,016,584
2,610,311
100%
~
Secondary Sector - Non-manufacturing
With increased urbanisation, non-manufacturing activities such as mining, construction and utilities sub-sectors are likely to expand. 2041 employment is projected to catch up to a CAGR of 5% by 2041. It is defined to ensure that the secondary (non-manufacturing) sector’s employment growth rate remains in tandem with the population growth rate.
Secondary Sector - Manufacturing
With an established strong foothold into the region and the anticipated 4th industrial revolution, the industrial sector’s share is envisaged to grow from 27% to 39%. As shown in Table 11.4, sub-sectors such as automotive, auto ancillaries, engineering, and electronics are projected to grow at a CAGR of 3-4% each, in alignment with the past trend and continue to be major employment generators. Sub-sectors such as pharma, food processing and biotech are not strongholds of the region but need to be promoted to drive the economic transition. Therefore, an aggressive CAGR of 6%, 9%, and 11% respectively, is targeted to push growth into these sub-sectors.
Secondary Sector - IT
As per NASSCOM data, IT sector employment in the Pune division was 4.5 lakh in 2018. As per the ‘Socio-Economic Survey of Pune City’ by Karve Institute in 2008-09, IT sector employment in the Pune division was 2.25 lakh (1999), mainly concentrated in and around Hinjawadi.
CBRE’s real estate database suggests that at PMR level, the built-up area under IT was 34.1 million square feet before 2014, and it grew to 42.2 million square feet by 2018 (Q4). Vacancy in stock was 7% by 2018. Assuming 100 square feet of built-up area per IT worker, the PMR IT workforce works out to be 4.2 lacs, close to the NASSCOM data.
Based on these two sources, it can be observed that Pune Division’s IT sector employment grew from 2.25 lakh to about 4.5 lakh by 2018 at a CAGR of about 3.7%.
PMR level direct IT employment is projected to increase at a CAGR of 3% (assuming marginal growth scenario) from 4.2 lakh to about 7.1 lakh by 2041.
Assuming that the Study Area would take up a 40% share from PMR, the IT sector’s new employment is estimated to be 2.9 lakh by 2041.
IT sector employment is validated by projecting employment of the Study Area, using Census 2011 data and classifying it into economic sub-sectors using sub-sector-wise employment data provided in the 6th Economic Census of Maharashtra (2012-13). Projected employment for 2041 based on this data also comes out to be 2.9 lakh.
Figure 11.2: Villages fulfilling all three Census parameters (Census Towns) considered as Urban
Figure 11.3: Villages with High Density and High Main Male Workforce in Non-agriculture considered as Urban
Figure 11.5: Villages additionally considered as Urban as per Planning Intent
Figure 11.4: Villages with good Connectivity and Population Density greater than 400 pph considered as Urban
Chapter 11: Regional Economic Positioning and Socio-economic Projections
Figure 11.6: Villages Removed from Urban category Figure 11.7: Urban villages in URGD due to constraints
48.19%
48.39%
48.42%
48.59%
48.60%
Note: UGC - Urban Growth Centres; RA - Rural Areas. Numbers for 2011 are based on Census 2011 data.
Tertiary Sector
Services sector (vocational, technical, scientific, marketing, advertisement, research etc.) represents a major share of the tertiary sector and is anticipated to maintain a 2011 share of 6% of overall employment. Logistics, sales-maintenance-repair, wholesale trade, restaurants and hotel, retail trade, finance, and insurance show high growth due to rapid urbanisation and change in urban lifestyle. Therefore, these sectors are projected to grow at a CAGR of 4-5%. Although human health and education have a small share at present, these sectors are envisaged to diversify the economy. Therefore, an aggressive CAGR of 6% and 8% respectively, is targeted to push the growth of these sub-sectors.
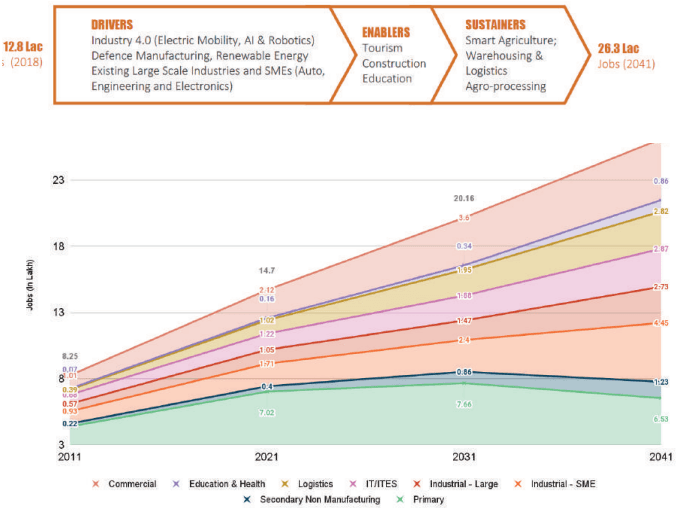
Thus, out of the projected 26.1 lakh employment in 2041 for the Planning Area, the primary sector share is 25%, secondary sector (non-manufacturing) share is 5%, secondary sector (manufacturing) share is 28%, secondary sector (IT) share is 11%, and the tertiary sector share is 32%. (Refer to Table 11.5)
Figure 11.10 shows the envisaged economic transition and projected employment by 2041.
Figure 11.10: Economic Transition and Projected Employment 2041
Proposed Employment Distribution
While projecting the Planning Area employment, using the URGD method, 2041 employment of urban (Development Plan Growth Centres) and rural areas is also projected. As per the same, urban and rural areas would generate 18.4 lakh and 7.7 lakh employment, respectively. Distribution of this employment is carried out based on the following rationale: