| No1 | Sector Pune District | Population | Growth Rate (%) | |||
| 199155,32,532 | 200172,32,555 | 201194,29,408 | 1991 - 200131% | 2001 - 201130% | ||
| 2 | PMC - 2011 (Excluding 11 villages- 2,39,483 and Yewalewadi- 7,685) | 15,66,651 | 25,38,473 | 31,24,458 | 62% | 23% |
| PMC - 2018 | 15,66,651 | 25,38,473 | 33,71,626 | 62% | 33% | |
| 3 | PCMC | 5,17,083 | 10,12,472 | 17,27,692 | 32% | 71% |
| 4 | Cantonments | 2,01,017 | 2,04,359 | 1,99,426 | 2% | -2% |
| 5 | Municipal Councils and NP | 1,62,831 | 2,32,900 | 2,99,789 | 43% | 34% |
| 6 | Census Towns | 40,690 | 78,361 | 1,49,248 | 93% | 90% |
| 7 | PMR - Planning area (including CT) | 10,65,134 | 13,48,185 | 17,11,492 | 27% | 27% |
| 8 | PMR - Total | 37,52,731 | 53,24,674 | 73,21,367 | 42% | 37% |
Source: Census 1991, 2001, 2011
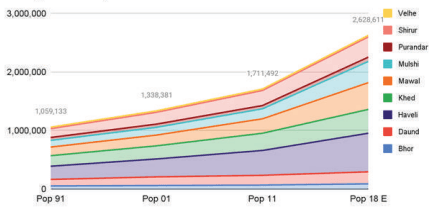
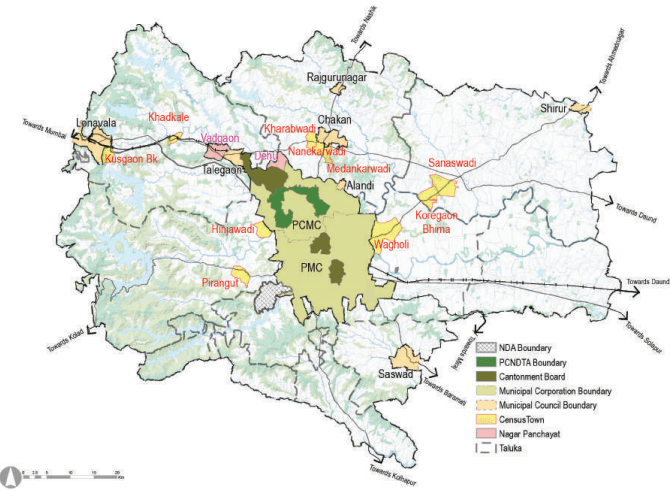
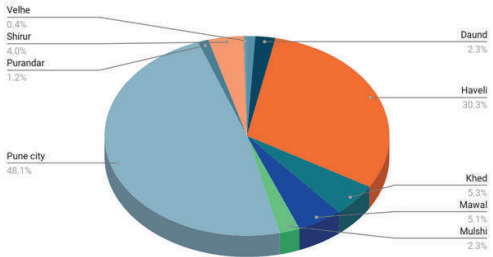
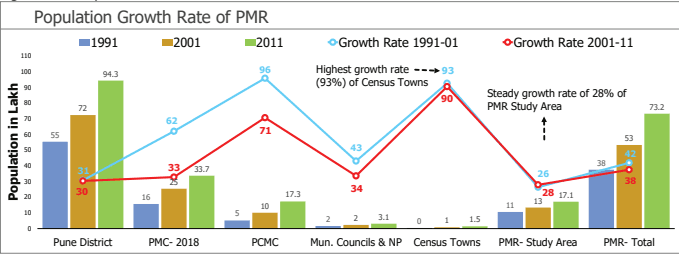
PMR Study Area population has increased from 13.48 lakh in 2001 to 17.11 lakh in 2011 which is 23.61% of PMR population (73.21 lakh) and 18.33% of Pune district’s population (94.29 lakh). Table 10.2 shows taluka wise distribution of Study Area population.
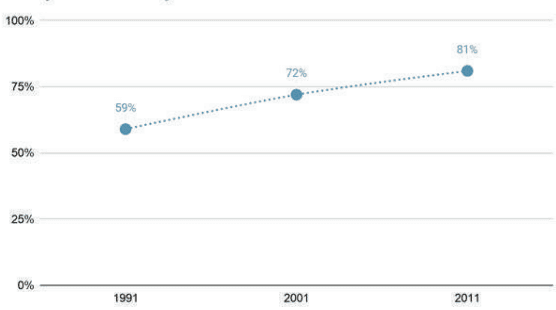
Figure 10.4 : Population Growth Rate Trends
Source: Census 1991, 2001, 2011
| No. | Talukas | Census 1991 | Census 2001 | Growth1991-01 (%) | Census 2011 | Growth2001-11 (%) |
|---|---|---|---|---|---|---|
| 1 | Haveli | 2,25,453 | 3,05,854 | 36% | 4,24,428 | 39% |
| 2 | Mawal | 1,53,742 | 1,94,234 | 26% | 2,47,123 | 27% |
| 3 | Mulshi | 1,13,159 | 1,32,623 | 17% | 1,70,366 | 28% |
| 4 | Khed (Part) | 1,80,164 | 2,24,526 | 25% | 2,94,213 | 31% |
| 5 | Shirur (Part) | 1,50,531 | 2,01,317 | 34% | 2,56,923 | 28% |
| 6 | Purandar (Part) | 49,823 | 54,382 | 9% | 55,902 | 3% |
| 7 | Bhor (Part) | 53,771 | 61,000 | 13% | 68,320 | 12% |
| 8 | Velhe (Part) | 26,970 | 26,397 | -2% | 26,866 | 2% |
| 9 | Daund (Part) | 1,11,521 | 1,47,853 | 33% | 1,67,351 | 13% |
| 10 | Total population of Study Area (including census towns) | 10,65,134 | 13,48,185 | 27% | 17,11,492 | 27% |
Source: Census 1991, 2001, 2011
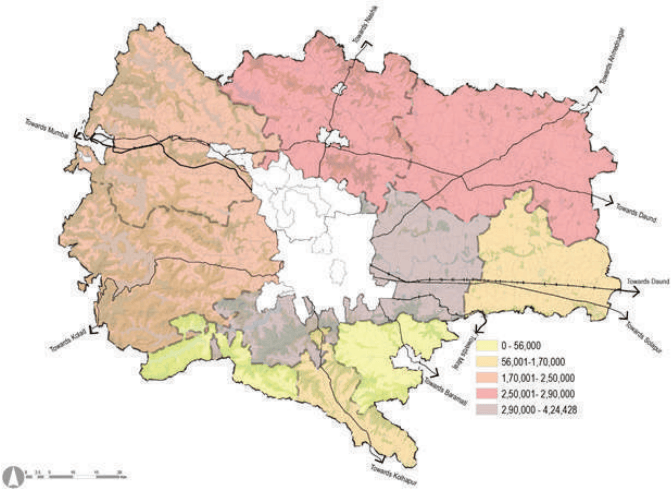
Figure 10.5: Map showing taluka wise total population
Source: GIS Database, Census 1991, 2001, 2011
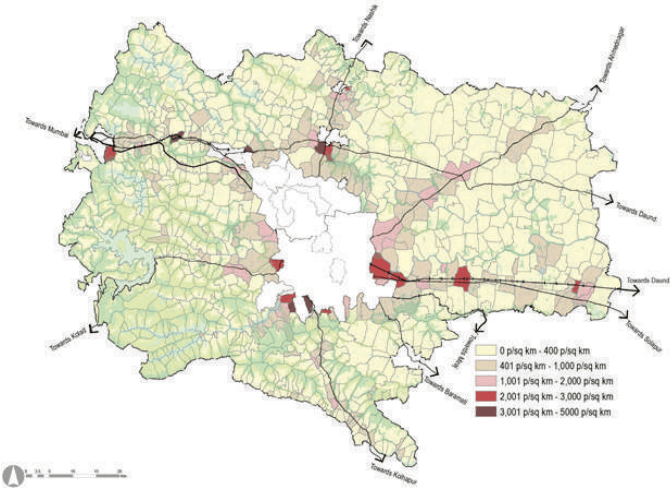
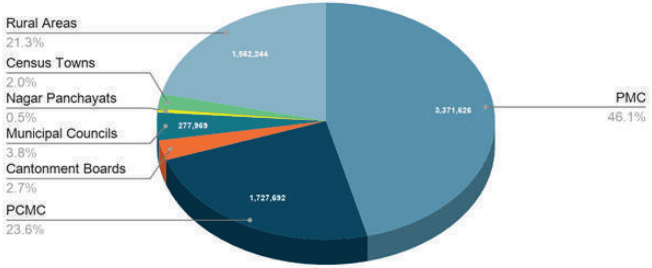
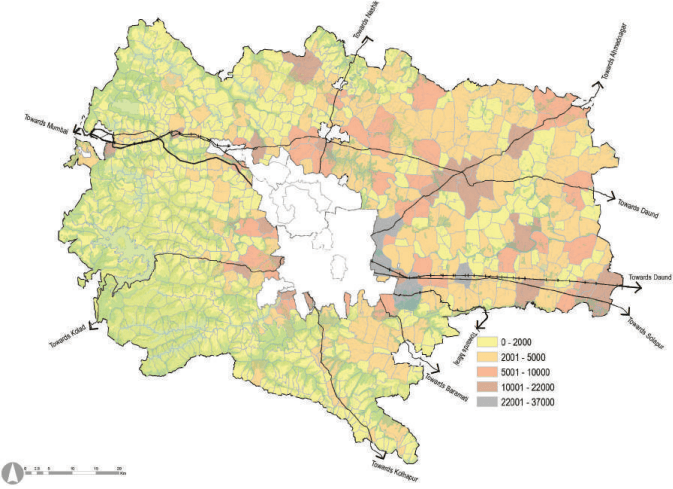
Figure 10.6: Village-wise population distribution in PMR Planning Area
Source: GIS Database, Census 1991, 2001, 2011