Chapter 11Regional Economic Positioning and Socio-economic Projections
The first half of this chapter covers socio-economic projections, and the second half will discuss the regional economic positioning, including economic transition strategy.
Regional economic positioning systematically assesses existing economic drivers and anticipates future drivers. While doing so, it factors in their growth/decline trends into socio-economic projections. This is necessary so that projections do not merely reflect historical trends as recorded in Census data. It lays the foundations of the economic development plan for the Study Area and guides policy formation to boost the region’s economic competitiveness.
11.1Socio-economic Projections
Socio-economic projections are worked out village wise for 814 villages within PMRDA jurisdiction. Projections are carried out for population, resident workforce/working population and household for 2021, 2031 and 2041 and are based on three historical Census datasets of 1991, 2001 and 2011.
Projections for PMR
Projections are carried out in two parts. Population projections for PMC, PCMC and Cantonments are taken from the CTTS and kept constant. While projecting populations for municipal councils, Planning Areas and Rural Areas, four established methods of population projections such as arithmetic increase, geometric increase, incremental increase and graphical curve method were tested.
Out of these four methods, projections through the geometrical increase method were outliers; as the geometrical increase method projections were more than 10 lakh vis-à-vis projections using the remaining three methods. Thus, they were discarded. Similarly, the projection using the graphical curve method was not adopted as the accuracy is dependent on the skill and experience of the person dragging the curve, which is subjective.
Ultimately, arithmetic increase and incremental increase methods were chosen for detailed village level projections of the study area due to their relevance, as explained below.
Projections for Study Area
The Study Area is organised into two parts - Urban Growth Centres and Rural Area based on the assessment of the urban/rural development potential of 814 villages. Two hundred and thirty-three villages are identified for urban development (referred to as Urban Growth Centres ), and 581 villages are identified for rural development (referred to as Rural Areas). Detailed village-wise population projections are carried out for Urban Growth Centres and Rural Areas separately.
The arithmetic increase method is used for projections of Rural Areas as the growth rates of most of the villages are stabilising/declining.
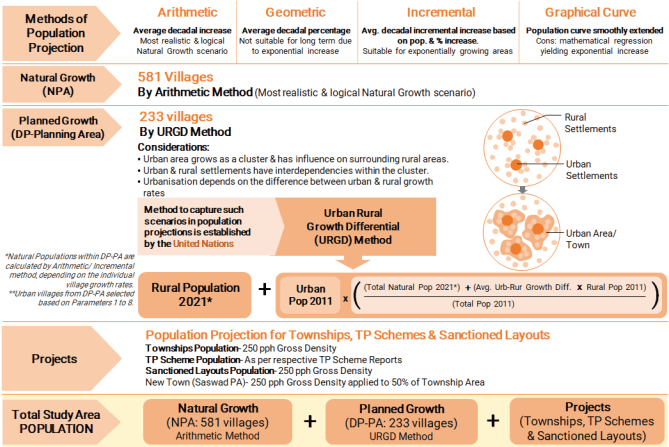
For village wise projections of Urban Growth Centres, the arithmetic or incremental increase method is used based on the individual village’s growth rate. However, just summing up the village-wise populations of urban and rural villages in isolation to project the population of Urban Growth Centres will not be feasible since all the villages are closely linked to each other and not isolated. Thus, for projections of each Urban Growth Centre as a whole, Urban-Rural Growth Differential (URGD) method is used since each Urban Growth Centre contains a mix of interdependent urban and rural villages showing different demographic growth trends.
URGD is the most reliable method for such cases since its formula considers the urban and rural growth difference in relation to the total population while projecting. It is also known as the United Nations method. Pune district level projections in RP 1997 are also based on the URGD method. Urban-Rural Growth Differential rate in the URGD
formula is computed by taking the difference between average urban population growth rate and average rural population growth rate. The remaining methodology of the projection exercise is shown in Figure 11.1.
Figure 11.1: Methodology for Study Area Population Projections
Projections for Rural Areas i.e. 581 Villages
For Rural Areas, the arithmetic increase method is used, where the average increase in population is assumed to be constant from decade to decade. The average increase per decade is found out from the previously available census data (1991, 2001, 2011). This number is multiplied by the number of decades for which the population is to be worked out and is then added to the present population to get the future population after ‘n’ decades.
Where Pn is the future population after n decades, P is the present population, n is the number of decades and d is the average increase per decade.
The total population of 581 villages represents the total Rural Area population for a particular decade.
Projections for Villages under Urban Growth Centres
Evolution of the Study Area shows that its urbanisation level would determine the population growth of Urban Growth Centres, and it would be dependent on the difference between urban and rural growth rates.
‘Urban-Rural Growth Differential’ means the difference between the population growth rate of urban and rural areas. It is observed that the difference is maintained for an indefinite future period without leading to absurd results by using the URGD Method. This is irrespective of the current urbanisation level, total population growth rate, or whether the rural population is increasing or diminishing.
First, villages are classified under rural and urban character based on the parameters satisfied by them as explained in the assessment of urban/rural development potential of 814 villages in Chapter 9. Urban villages are selected based on parameters 1 to 8.
Then, the population for each of the 233 villages is projected, and the total natural population is worked out.
Chapter 11: Regional Economic Positioning and Socio-economic Projections
For village-wise population projections, villages are classified into two categories based on their growth rates from 2001 to 2011. The incremental increase method is used for villages with growth rates more than the average growth rate of 233 villages in Urban Growth Centres. In contrast, the arithmetic increase method is used for villages with growth rates below average. First, the average increase per decade is found out in the incremental increase method, and then the average percentage increase per decade is worked out. The future population is worked out from the following equation:
Pn = P + n * d + (n*(n+1)/2)*t))
Where Pn is the future population after n decades, P is the present population, n is number of decades, d is average increase per decade, t is average incremental increase per decade.
Then, inputs such as urban population, rural population, total population, urban growth rate, and rural growth rate of each village in Urban Growth Centres are inserted in the URGD method formula. Refer to the formula shown in Figure 11.1. The existing urban population will be multiplied with a factor of urban-rural growth differential. The factor considers average urban-rural growth difference for the past three decades, existing rural and total population and future total population projected using arithmetic/incremental increase method. This calculation procedure is adopted for all eighteen Urban Growth Centres.
Urban Population in URGD
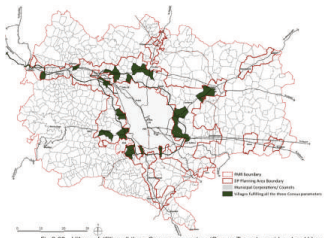
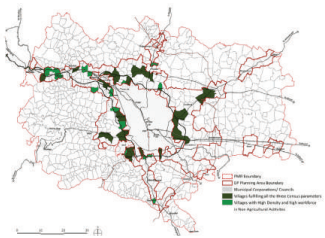
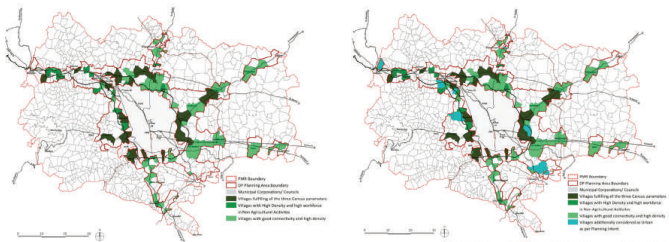
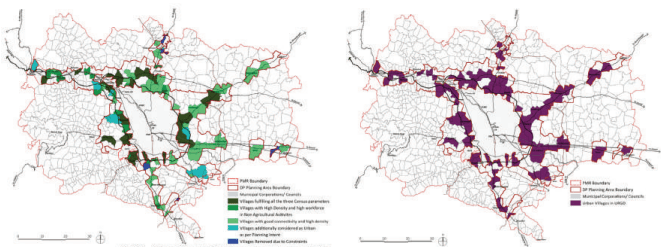
Urban Population in URGD method has been calculated by adding the population of villages categorized as Urban within the DP planning Area. About 104 villages have been categorized as Urban in URGD method. The process of selecting Urban villages is represented through the maps (Fig.11.2 to Fig.11.7) and explained though four steps in the following table (Table 11.1).
Table 11.1Categorizing Urban Villages in URGD
No1
Category of Vil-lages Census Towns
No. of Villages29
Remark Villages are selected as Urban if they fulfil all the three Census parameters of Population >5,000, Density >400 pph, and Main male working population in non agriculture >75%
2
Villages with High Density and high workforce in Non Agricultural Acitivites
21
Further, some more villages qualify as Urban if they fulfil both the following parameters since they indiate that they are already urbanised: 1. Villages having Population Density greater than 400 pph (as per the census definition) 2. Villages having Main Male Working population engaged in non agricultural employment higher than 75%
3
Villages with good connectivity and high density considered as Urban
47
Additionally, villages are shortlisted as Urban if they fulfil both the following parameters they can become an Urban Nucleus within each DP PA in future and attract rural migrants: 1. Villages along National and State Highways, Expressway, proposed Ring Road and with Railway stations 2. Villages having Population Density greater than 400 pph (as per the census definition)
4
Villages Additionally considered as Urban as per Planning Intent
10
Villages are added to Urban Category based on the Planning Intent such as: 1. Villages with proximity to proposed Airport: Vanpuri, Sonori, Dive 2. Villages with presence of Proposed ITP/ TPS: Urse, Manjari Kh. 3. Village with excellent connectivity (Proximity to Highway, Expressway, Ring Road and Railway): Shirgaon 4. Villages with existing IT Cluster: Man, Bhoirwadi 5. Village fully built up: Kune N. M. 6. Village with urbanisation potential due to high Population and Density: Rakshewadi
5
Villages omitted
-5
From above selected villages, 5 villages are omitted, inspite of meeting above criteria, due to constraints. Such villages are Kolwadi, Chivhewadi, Holewadi, Kedgaon, and Sandbhorwadi
The population of various projects in the Study Area such as Townships, Town Planning Schemes and Sanctioned Layouts are calculated based on the following:
PMRDA has approved 16 townships over 2,018 hectares - 15 townships in Urban Growth Centres and 1 in Rural Area. The population of each township is estimated based on the gross residential density of 250 PPH.
Populations of six notified Town Planning Schemes (TPS) are considered as per their respective TPS reports.
The Study Area has about 3,592 hectares of sanctioned layouts, out of which 2,527 hectares are in Urban Growth Centres and 867 hectares in Rural Areas. The population of sanctioned layouts is calculated by considering the gross residential density of 250 PPH.
Promoting greenfield development at Saswad Growth Centre is a planning strategy, considering the proposed Chhatrapati Sambhaji Raje International Airport. Since this Growth Centre does not have an adequate existing population, the projections can not reach a sufficient population required to justify amenities and other public developments. Hence, Saswad Growth Centre’s population is induced by proposing a consolidated residential development of 225 hectares and a gross density of 250 PPH applied to 50% of the area.
To estimate employment and households of the projects in Urban Growth Centres, Workforce Participation Ratio and Household size are projected for 2021 using the incremental increase method. The incremental increase method is used since the projects are majorly present in the villages that show higher than average growth rates. By this method, WFPR comes out to be 48.6%, and household size works out to be 4. These numbers are used to calculate employment and households for the ‘Projects’ population for years 2021, 2031 and 2041.
Total Study Area Population
The total Study Area population is worked out by adding individual populations of Urban Growth Centres, Rural Areas, Townships, TP Schemes and sanctioned layouts.
Employment and households are estimated using the Census 1991, 2001 and 2011 datasets and methodology as explained above.
Population, employment and household projections for each Growth Centre are provided in Table 11.6, 11.7 and 11.8.
Table 11.2Summary of Projections for Study Area
Key Projections
2011
2018
2021
2031
2041
UGC Population
953,579
1,667,369
1,989,629
2,977,366
4,074,098
UGC Employment
417,287
744,827
893,163
1,343,285
1,842,331
UGC Households
210,669
398,287
483,764
745,478
1,040,985
UGC Household Size
4.5
4.2
4.1
4
3.9
UGC Workforce Participation Rates
43.80%
44.70%
44.90%
45.10%
45.20%
RA Population
757,913
961,242
1,048,383
1,172,550
1,296,718
RA Employment
407,437
527,263
577,770
673,299
767,981
RA Household
152,340
204,451
226,785
259,654
292,523
RA Household Size
5
4.7
4.6
4.5
4.4
RA Workforce Participation Rates
53.80%
54.90%
55.10%
57.40%
59.20%
Total Population
1,711,492
2,628,611
3,038,012
4,149,916
5,370,815
Total Employment
824,724
1,272,090
1,470,933
2,016,584
2,610,311
Total Households
363,009
602,739
710,549
1,005,132
1,333,507
Household Size
4.7
4.4
4.3
4.1
4
Workforce Participation Rates
Figure 11.2: Villages fulfilling all three Census parameters (Census Towns) considered as Urban
Figure 11.3: Villages with High Density and High Main Male Workforce in Non-agriculture considered as Urban
Figure 11.5: Villages additionally considered as Urban as per Planning Intent
Figure 11.4: Villages with good Connectivity and Population Density greater than 400 pph considered as Urban
Chapter 11: Regional Economic Positioning and Socio-economic Projections
Figure 11.6: Villages Removed from Urban category Figure 11.7: Urban villages in URGD due to constraints
48.19%
48.39%
48.42%
48.59%
48.60%
Note: UGC - Urban Growth Centres; RA - Rural Areas. Numbers for 2011 are based on Census 2011 data.