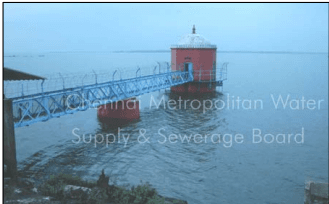
One of the major problems faced in CMA is the inability of the administration to keep pace with the increasing need for utility services particularly water supply and sewerage. This problem is not unique to Chennai alone and almost all the rapidly growing cities in India share the same.
7.02 In Chennai City, Chennai Municipal Corporation was responsible for construction, operation and maintenance of water supply system till August 1978. It was transferred to the (then newly formed) CMWSSB with all assets and liabilities. The major supply sources viz. Poondi reservoir, Cholavaram lake and Redhills lake are under the control of the State PWD (Irrigation); further the PWD (Ground Water Cell) is responsible for the investigation of ground water resources within CMA to augment supplies.
7.03 In the cases of large-scale neighbourhood developments made by TNHB such as Anna Nagar, K.K. Nagar, J.J. Nagar, Ashok Nagar, South Madras Neighbourhood schemes etc., water supply facilities within the area had been provided by TNHB (usually with ground water sources or extending the city water supply) and after installation, maintenance had been transferred to CMWSSB. The same is the case in cases of large-scale TNSCB developments also.
7.04 In the rest of the CMA, construction and water supply schemes were undertaken mostly by TWAD Board at the cost of the local body concerned and after completion, transferred to the local body for future operation and maintenance. CMWSSB is now planning to cover these areas with water supply and sewerage services.
City System
7.05 Chennai City water supply is drawn from the Red hills lake located about six km. from City in the northwest along the GNT Road. This lake mainly receives its supply from the Kosasthalaiyar River across which a dam was constructed to create reservoir at Poondi. The anicut constructed in its downstream at Tamaraipakkam diverts the flow through the upper supply channel to Cholavaram Lake; from there it flows to Redhills Lake. A separate lined channel from Poondi reservoir connects the upper supply channel which prevents any possible loss of transmission through dry beds of the river. The flow into these sources is seasonal.
7.06 A number of small lakes are also connected in the northwest of CMA to the Redhills Lake and the run-off in the catchment areas of these lakes are fed to the Redhills Lake.
7.07 Water tapped from the Redhills Lake is filtered enroute, conveyed through closed conduits to Kilpauk Water Works, treated therein and distributed to various parts of the City.
7.08 Nucleus of the protected surface water supply system now in existence in Chennai City was formed in 1872 while major inputs including filtration and pumping commenced in 1914. The scheme as it exists today consists of the surface storages at Poondi, Cholavaram and Redhills lakes with a total capacity of 183 million cubic metres fed by the Kosatalaiyar river. The maximum water levels of Redhills and Cholavaram lakes were raised in 1972 and the irrigation rights under the lakes had also been acquired by the Government. The lakes are mostly fed by North East monsoon, which is active only for a few months in a year between October and December.
7.09 A statistical analysis of the combined storage of the lakes for a period of thirty years has indicated that the safe potential from the lakes at 95% probability is only 142 mld. As the lakes are shallow, evaporation losses are as high as 43% at present.
Ground Water System
7.10 The ground water sources are ground water from well fields, coastal aquifer; brackish water based Reverse Osmosis Plants, Neyveli Aquifer etc.
7.11 During 1960s & 70s three aquifers at Minjur, Panjetty and Tamaraipakkam located in the north and northwest of the City and the aquifers along the coastal belt from Thiruvanmiyur to Kovalam were identified and tapped. The area North East of the City was taken up for extensive hydro- geological study as part of a UNDP aided project to assess the potential for development of a ground water source. Studies have identified a 'buried channel', which should have been the course of Palar river thousands of years back. In this course, a well field was identified extending to a stretch of about 50 km. length and 5 km. average width hydro geologically suitable for extraction of ground water. The following well fields have been developed.
Table No.7.01 Details of Well Fields
Well Fields
Year of Commission
No. of wells
Yield MLD during design
Average yield from Dept. wells in 2005
Tamaraipakkam
1969
2 out of 30
50
1.60
Panjetty
1969
1 out of 13
41
0.08
Minjur
1969
5 out of 9
34
3.10
Poondi
1987
4 out of 12
27
1.20
Flood Plains
1987
0 out of 5
14
0
Kannigaiper
1987
0 out of 5
14
0.01
Total
12 out of 74
180
5.99
Source: CMWSSB
7.12 Above table clearly brings out the depletion of ground water source during the last 30 years in that area due to increase in demand resulting in overdrawal of ground water. In addition, due to severe scarcity, CMWSSB has hired private agricultural wells from 2000 to augment water supplies. The average yield from such sources during 2005 is to the tune of 77 MLD.
Details of hiring of Private Agricultural Wells
Sl.No.
Year
Average Yield in MLD
1
2001
37
2
2002
45
3
2003
55
4
2004
70
5
2005
77
7.13 In the recent past the agriculture activity in the ayacut areas of Chembarambakkam tank has been reduced drastically because of conversion of lands for urban uses and for reasons of uneconomical production costs. Now the Chembarambakkam tank (located about 12 km. from the City in the west) is also used as one of the main sources of water supply to the City. Veeranam tank (located about 230 km. from the City in the south) has been identified as an additional source of water supply to Chennai.
Table No.7.02 Characteristics of Existing Surface Reservoirs
Reservoir
Maximum Water Elevation (Metre)
Drawl of elevation (Metre)
Maximum usable volume (million)
Full Area surface (million sq.ft.)
Mean Depth (Metre)
Catchment Area (Sq.km.)
Poondi
42.67
34.14
91.44
376.74
8.53
1983
Cholavaram
19.66
14.22
24.93
55.76
5.44
28.49
Redhills
15.30
8.59
87.02
195.15
6.71
60.00
Chembarambakkam
26.03
18.72
103.15
711.18
7.31
357.00
Veeranam
14.48
12.34
37.61
2.14
422.40
Total
306.54
2850.89
Treatment Capacities
7.21 The availability of treatment capacities at 750 MLD is much more than the current supply levels. The treatment capacity appears to be high as the current supply is lower than the anticipated levels and would suffice the current requirement if a full supply is envisaged. The location and capacities of treatment plants is presented in Table No.7.05.
View of Redhills Reservoir
Table No. 7.05: Treatment Capacities
Sl. No
Location
Capacity-MLD
1.
Kilpauk
270
2
Red hills
300
3
Veeranam
180
Total
750
Source: CMWSSB
7.22 In addition, a 530 MLD capacity treatment plant at Chembarakkam is currently under construction taking the total capacity to 1280 MLD. This is constructed in anticipation of full realization of Krishna Water to the City, which would augment the existing supply levels.
Ground Water Regulation
7.14 To regulate and control the extraction, use or transport of ground water and to conserve ground water, the Chennai Metropolitan Area Ground Water (Regulation) Act, 1987 was enacted. The preamble of the Act is extracted below:
"There is often acute scarcity of water due to consecutive failure of monsoon rains; the available water in the Poondi, Cholavaram and Red Hills reservoirs, which are the main sources of supply of water to the Chennai City, is inadequate to meet the requirements for drinking and other domestic purposes of the people in the Chennai City;
The United Nations Mission, which investigated the possibility of supplementing water supply to Chennai, has recognized that a better economic answer might lie in the development of groundwater potential and had identified the Minjur, Duranallur-Korteliyar basin, the Poondi, Korteliyar Flood Plains and Kannigaipper aquifers and also Poonamallee-Porur aquifer in Cooum-Adayar basin as having groundwater for extraction;
The United Nations Development Programme which conducted pre-investment studies on improving water supply and sewerage systems of chennai concurred with the estimation of the Geological Survey of India that groundwater can be extracted from the twenty kilometre stretch of the coastal zone between South Madras and Kovalam;
The Madras Metropolitan Water Supply and Sewerage Board has reported that all other possibilities of augmenting water supply to the Chennai City have been exhausted and that it is necessary to regulate and control the extraction and use of ground water in any form and to conserve the same in the City of Chennai and the district of Chengalpattu and to regulate and control the transport of groundwater;
Based on the United Nations Development Programme studies, a scheme for artificial re-charge of the Arni-Korteliyar basin with excess flood water flowing into the sea is to be taken up by interlinking Arni and Korteliyar at two or more feasible points and also by constructing sufficient number of check dams at the appropriate places in the Korteliyar river course;
Such re-charge will enable optimum utilisation of ground water and formation of a hydraulic barrier against seawater intrusion;
The Government have, after careful examination of all aspects, decided that it is necessary in the public interest to regulate and control the extraction and use of
groundwater in any form and to conserve the groundwater in the City of Chennai and certain revenue villages in the district of Chengalpattu and to regulate and control the transport of groundwater." The Government of Tamil Nadu has enacted the Act viz. Madras Metropolitan Area Ground Water (Regulation) Act 1987.
7.15 The Act is being enforced by the CMWSSB in the Chennai City and the District Collector in the rest of CMA, and it provides for grant of permit to sink wells in the scheduled areas, registration of existing wells and use of ground water in the area, license for extraction, use or transport of ground water etc.
7.16 The entire area within the Chennai City has potential for restricted drawal through shallow open wells, and tube wells, and these types of wells are predominant in the premises within the City. Though unprotected, it helps to supplement the limited quantity of protected water available from the public system. Assuming a conservative figure of drawal of 50 lpcd of ground water, for the population of Chennai about 45 million in 2005, estimated drawal will be in the order of 225 MLD. Details on TDS level in ground water in Chennai are given in the Annexure VI-A. The level of TDS of sample wells varied from 500 ppm to 2500 ppm.
7.17 Estimated safe yield and average yield at various sources for water supply to Chennai in the year 2004 is given below:
Table
No.7.03 Safe Yield from d
ifferent sources 2004
Sl.No.
Source
Average yield in MLD
Safe yield in MLD
1.
Surface Water including I stage Krishna
17.89
500
2.
New Veeranam Project a) Veeranam Lake b) Neyveli Aquifer
148.4250.56
18065
3.
Well fields
85.23
100
4.
Distance Source
63.16
100
5.
Porur Wells
2.96
3
6.
Southern Coastal Aquifer Total
2.12370.34
4952
Source: CMWSSB
7.18 The sources of water supply to Chennai in the year 2004 is given in the Table below. The areas served by it are the Chennai City, adjoining urban areas (10 sq.km.) and industries at Manali.
Table No.7.04 Sources of Supply of Water to Chennai, 2004
Source (in ML) for the whole year 2004
Veeranam Lake
14,842
Redhills Lake
4,155
Rain water
1,691
Chembarambakkam
133
Erattai Eri
207
Well fields
31,195
Southern Coastal Aquifer
776
R.O. Plants
182
TWAD Source
275
Porur Wells
210
Neyveli Aquifer
5,966
Distance Source
21,357
Total
80,988
Source: CMWSSB
7.19 When there was acute scarcity of water in 2004 to the City due to monsoon failure and it could not be supplied through pipe, CMWSSB had ably managed the crisis by supplying through tanker lorries and the water supply through tankers were 9,930 nos./day (average) from January, 2004 to June, 2004 and 9,003 nos./day (average) from July to December, 2004.
Supply Levels
7.20 The average water supply in Chennai city is 90 lpcd. In slums within the City the level of water supply is 25 lpcd. The current water supply from all the sources is of the order of 550 MLD. However, during the summer season, in times of reduced storage, the supply levels would be as low as 300 MLD. In addition, CMWSSB also provides bulk water to the surrounding municipalities to supplement the other sources.