- The following methods were adopted for projection of population.
(1) Linear Method:
P(t+n)
where P t - is population at time 't';
P ( t + n ) - is population at time 't+n';
n - is no. of time periods;
a - is average change in the past time periods.
(2) Geometric Growth Method:
P(t+n) = Pt (l+r)n
where Pt - is population at time 't';
P ( t + n ) - is population at time 't+n';
n - is number of time period;
r - is average percentage of change in population over past time period.
Note: Often the rate 'r' is not calculated, but estimated based on historical patterns, and judgment for the future.
(3) Exponential Curve Method:
P(t+n) = Pt x e rt
where Pt - is population at time 't';
P ( t + n ) - is population at time 't+n';
n - is number of time period;
r - is average percentage of change in population over past time period.
Note: Often the rate ′ r ′ is not calculated, but estimated based on historical patterns, and judgment for the future.
(4) Urban - Urban Growth Difference (UUGD) Method
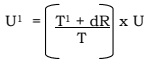
where U - Urban population at time 't';
U1 - Urban population at time 't+1';
T - Total population at time ′ t ;
T1 - Total population at time 't+1';
d - u-r, where u - urban growth rate; r - rural growth rate;
R - Rural population at time 't';
C1 = U 1 + d U 1 ; x ; C U
Where C - City population (Chennai/CMA) at time ′ t ;
C 1 - City population (Chennai/CMA) at time (t+1);
U 1 - Urban population (CMA/Tamil Nadu) at time (t+1);
U 1 Rest of urban population (i.e. U-C);
U - Urban population (CMA/Tamil Nadu) at time ′ t ;
d - r c ~ - ~ r u where
r C - the rate of growth of city population;
r u the rate of growth of urban population.
(5) Urban - Urban - Rural Growth Difference (UURGD) Method:
C1 = w1 ( ((U1 + d1 U1))/(U) ) + w2 ( ((T1 + d2 R))/(T) ) C
Where U - Urban population at time 't'; U¹ - Urban population at time 't+1'; U₁ - Rest of urban population (i.e. U-C); T - Total population at time 't'; T¹ - Total population at time 't+1'; R - Rural population at time 't';
d₁ - rc - ru;
d 2 rc - rr;
w1, w2 - Weights of these population components;
C City population at time‘t’;
C 1 City population at time‘t + 1’;
r C rate of growth of city population;
r u rate of growth of urban population;
r R rate of growth of rural population.
Note: w₁ + w₂ = 1.0 The quantum of weight is determined based on urbanisation level. At low levels of urbanisation contribution from rural areas will be more, and vice versa. The weights adopted based on the U.N. method is as follows:
| Level of Urbanisation in percent | w1 | w2 |
|---|---|---|
| 25 | 0.2 | 0.8 |
| 30 | 0.3 | 0.7 |
| 50 | 0.4 | 0.6 |
| 60 | 0.6 | 0.4 |
| 75 | 0.8 | 0.2 |
Assumptions made
Tamil Nadu Population
-
The historical pattern of annual growth rate of Tamil Nadu population was as detailed in Table A in Annexure III B. It varied from 0.85% to 3.72% in respect of urban, -0.52% to 1.53% in respect of rural, and 0.34% to 2.03% in respect of total population.
-
The annual rate of growth assumed for Tamil Nadu for population projection as low, medium and high category of growth rate, is 2.0%, 2.5% and 3.0% for urban, and 1.0%, 1.1% and 1.2% for the total population; the rural population growth rate has been arrived out of the total and urban population growth rates assumed.
CMA/City Population:
-
The annual growth rates of population in 1971-81, 1981-91, and 1991-2001 were 2.76%, 2.37% and 1.93% respectively for CMA and 2.2%, 1.58% and 1.23% respectively for the Chennai City. The average rate of annual growth arrived for these three periods was 2.35% for CMA and 1.67% for City and the same was adopted for linear, geometric and exponential growth methods of projection.
-
Projection of population for individual Corporation Division was made based on average annual growth rates. In respect of villages, Town Panchayats and Municipalities, future growth rates were assumed based on the past and judging the future trends. For UUGD and UURGD method, the assumption made based on the historical pattern is given below:
| Growth Rates assumed in % | ||||||
| Year | Growth rate category | Tamil Nadu (TN) | TN Urban population | Rest of TN Urban population | Chennai City | CMA |
| 2006 | Low | 1.00 | 2.00 | 2.50 | 1.00 | 2.00 |
| Medium | 1.10 | 2.50 | 3.00 | 1.50 | 2.50 | |
| High | 1.20 | 3.00 | 4.00 | 2.00 | 2.75 | |
| 2011 | Low | 1.00 | 2.00 | 2.50 | 1.00 | 2.00 |
| Medium | 1.10 | 2.50 | 3.00 | 1.50 | 2.50 | |
| High | 1.20 | 3.00 | 4.00 | 2.00 | 2.75 | |
| 2016 | Low | 1.00 | 2.00 | 2.50 | 1.00 | 2.00 |
| Medium | 1.10 | 2.50 | 3.00 | 1.25 | 2.50 | |
| High | 1.20 | 3.00 | 4.00 | 1.50 | 2.75 | |
| 2021 | Low | 1.00 | 2.00 | 2.50 | 1.00 | 2.00 |
| Medium | 1.10 | 2.50 | 3.00 | 1.25 | 2.50 | |
| High | 1.20 | 3.00 | 4.00 | 1.50 | 2.75 | |
| 2026 | Low | 1.00 | 2.00 | 2.50 | 1.00 | 2.00 |
| Medium | ||||||
Population Projection Urban - Urban Growth Difference Method and Urban Rural Growth Difference Method
| Table No. A Population | and Growth Rate - Tamil Nadu | |||||
| Year1901 | Urban2724781 | Population Rural16527849 | Total19252630 | Urban | Growth r Rural | ate Total |
| 1911 | 3149137 | 17753479 | 20902616 | 1.46% | 0.72% | 0.83% |
| 1921 | 3428079 | 18200439 | 21628518 | 0.85% | 0.25% | 0.34% |
| 1931 | 4230382 | 19241717 | 23472099 | 2.13% | 0.56% | 0.82% |
| 1941 | 5173682 | 21093825 | 26267507 | 2.03% | 0.92% | 1.13% |
| 1951 | 7333525 | 22785522 | 30119047 | 3.55% | 0.77% | 1.38% |
| 1961 | 8990528 | 24696425 | 33686953 | 2.06% | 0.81% | 1.13% |
| 1971 | 12464834 | 28734334 | 41199168 | 3.32% | 1.53% | 2.03% |
| 1981 | 15951875 | 32456202 | 48408077 | 2.50% | 1.23% | 1.63% |
| 1991 | 19077592 | 36781354 | 55858946 | 1.81% | 1.26% | 1.44% |
| 2001 | 27483998 | 34921681 | 62405679 | 3.72% | -0.52% | 1.11% |
Table No. B Population Projection - Tamil Nadu 2006 – 2026 Exponential Method
| Year | Proj Urban | ected Popula Rural | tion Total | Annual Urban | Growth Rate Rural | assumed Total | |
|---|---|---|---|---|---|---|---|
| Low | 30374515 | 35230771 | 65605287 | 2.00% | 0.18% | 1.00% | |
| 2006 | Medium High | 3114345031931850 | 3479068534332781 | 6593413466264631 | 2.50%3.00% | -0.08%-0.34% | 1.10%1.20% |