The rapid growth of population in the Chennai Metropolitan Area (CMA) has been causing a strain on the existing urban services and infrastructure, for want of expansion and better management. The transport sector is vital and needs carefully planned expansion to meet the demands of the increasing population.
5.02. The need to take an integrated long term view of transport needs of CMA and to plan road development, public transport services and suburban rail transport, as a part of the urban planning process, have been well recognised.
5.03. A résumé of the changing travel characteristics of the metropolis and the growth of sea and air traffic which have a bearing on the quality of the road and transport infrastructure are indicated in the Annexure I.
5.04. Many studies have been done in the past for development of transportation in CMA. These include Madras Area Transport Study (MATS - 1968), Integrated Transport Plan (1977), Madras Route Rationalisation Study (1986), Traffic and Transportation Study for MMA (Kirloskar 1986), Comprehensive Traffic and Transportation Study (CTTS 1992-95) and other studies done through consultants for specific transportation projects. Based on the recommendations of these studies several major projects such as formation of Jawaharlal Nehru Salai (IRR) , addition of buses, improvements to Metropolitan Transport Corporation (MTC) infrastructure, Mass Rapid Transit system (MRTS) etc have been implemented. But these efforts have not kept pace with the increase in travel demand. A list of major efforts taken is indicated in the Annexure II.
5.05 Major recommendations of some of the recent studies which qualify for implementation on their merits are summarised below. These studies also assisted in the development of a matrix comparing the system characteristics of various alternative transit technologies which is embodied in Annexure III.
CTTS for CMA, RITES Ltd., PTCS & KCL September 1995 & Updating the CTTS (1992-95), RITES Ltd., April 2004
5.06. The comprehensive Traffic and Transportation Study (CTTS) for CMA undertaken through a consortium of consultants, M/s. RITES and M/s. KCL, commenced in May 91 was completed in 1995. The expatriate consultant, W.S. Atkins Planning and Management Consultants Limited, U.K. provided technical assistance for the study. The cost of the
study, which was Rs.9.75 m, was shared partly by the GoI and partly under Technical Assistance component of TNUDP I. The schemes from the study report have been included in the Chennai Metropolitan Development Plan (CMDP).
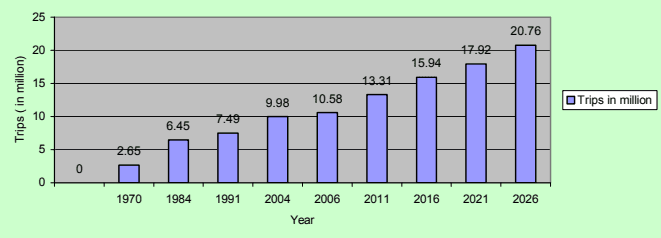
5.07. The Study provided the core inputs for predicting the future travel demand for the CMA. The travel demands in 2004, 2006, 2011, 2016, 2021 & 2026 have been projected on the basis of increase in per capita trips (from 1.32 in 2004 to 1.6 by 2016 and 1.65 by 2026). Table no. 5.01 gives 3 scenarios based on different modal splits between the road and rail system. The 3 scenarios have been worked out gradually increasing the share of the public transport between the public and private transport modes and also increasing the share of the rail transport between the bus and rail modes. Scenario 2 has been selected based on the following assumptions.
i) The modal split between public and private transport will change from 43:57 to 35:65 (2004), 55:45 (2011) and 60:40 (2016), 65:35 (2021) and 70:30 (2026) in line with the trend in share of public transport increasing with City size.
ii) The sub-modal split between bus and rail will have to change from 91:9 to 85:15 (2004), 75:25 (2011), 70.30 (2016), 65:35 (2021) and 60:40 (2026) if the road transport system is not to break down in the context of increased commuter trips.
Table No. 5.01: Projected daily trips by public transport
| 1. Population in lakh 2. Daily per capita Trips | 199158.071.29 | 200475.611.32 | 200678.961.34 | 201188.711.5 | 201699.621.6 | 2021111.981.6 | 2026125.821.65 |
|---|---|---|---|---|---|---|---|
| 3. Total Daily Person Trips in lakh | 74.91 | 99.81 | 105.81 | 133.07 | 159.39 | 179.17 | 207.60 |
| S Spcelinta %rio 1 Modal Private | 57 | 64.57 | 60.00 | 50 | 45 | 40 | 35 |
| Public | 43 | 35.43 | 40.00 | 50 | 55 | 60 | 65 |
| Total Daily | |||||||
| Person Trips by Public Transport | 32.21 | 35.36 | 42.32 | 66.53 | 87.67 | 107.50 | 134.94 |
| in lakh | |||||||
| By Rail % | 9.25 | 14.54 | 16.00 | 20 | 25 | 30 | 25 |
| By Road % | 90.75 | 85.46 | 84.00 | 80 | 75 | 70 | 75 |
| Daily Trips in | |||||||
| lakhs | |||||||
| By Rail | 2.98 | 5.14 | 6.77 | 13.31 | 21.92 | 32.25 | 33.74 |
| By Road | 29.23 | 30.22 | 35.55 | 53.23 | 65.75 | 75.25 | 101.21 |
| Scenario 2 Modal Split % | Private | 57 | 64.57 | 55.00 | 45 | 40 | 35 | 30 |
|---|---|---|---|---|---|---|---|---|
| Public | 43 | 35.43 | 45.00 | 55 | 60 | 65 | 70 | |
| Total Daily Person Trips by Public Transport in lakh | 32.21 | 35.36 | 47.61 | 73.19 | 95.64 | 116.46 | 145.32 | |
| By Rail % | 9.25 | 14.54 | 16.00 | 25 | 30 | 35 | 40 | |
| By Road % | 90.75 | 85.46 | 84.00 | 75 | 70 | 65 | 60 | |
| Daily Trips in lakh | By Rail | 2.98 | 5.14 | 7.62 | 18.30 | 28.69 | 40.76 | 58.13 |
| By Road | 29.23 | 30.22 | 39.99 | 54.89 | 66.94 | 75.70 | 87.19 | |
| Scenario 3 Modal Split % | Private | 57 | 64.57 | 50.00 | 40 | 35 | 30 | 25 |
| Public | 43 | 35.43 | 50.00 | 60 | 65 | 70 | 75 | |
| Total Daily person Trips by Public Transport in lakh | 32.21 | 35.36 | 52.90 | 79.84 | 103.60 | 125.42 | 155.70 | |
| By Rail % | 9.25 | 14.54 | 20.00 | 30 | 35 | 40 | 45 | |
| By Road % | 90.75 | 85.46 | 80.00 | 70 | 65 | 60 | 55 | |
| Daily Trips in lakhs | By Rail | 2.98 | 5.14 | 10.58 | 23.95 | 36.26 | 50.17 | 70.07 |
| By Road | 29.23 | 30.22 | 42.32 | 55.89 | 67.34 | 75.25 | 85.64 |
Source : CTTS(MMDA, RITES, KCL & PTCS, 1992-95) & Short term study to updateCTTS (1992-95)(CMDA, RITES & PTCS, 2004)
Fig.No. 5.01 Growth of Travel Demand in CMA
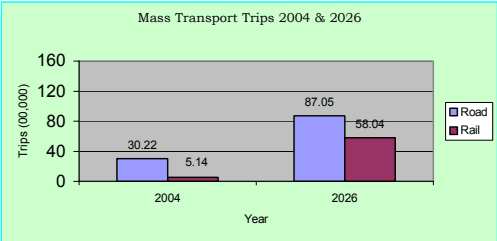
5.08. It will be seen from the Table no.5.01 that the number of trips carried by bus transport in 2004 would become nearly 2.8 times in the year 2026. Similarly the volume of passengers to be carried by rail transport will be nearly 11 times the present volume.
| Table No. 5.02: Mass Transport Trips 2004 & 2026 | ||
| Mass Transport Trips (in lakhs) | 2004 | 2026 |
| Total Mass Transport Trips | 35.36 | 145.09 |
| Increase in 22 years | - | 109.73 |
| Total road (bus trips) | 30.22 | 87.05 |
| Increase in 22 years | - | 56.83 |
| Total rail trips | 5.14 | 58.04 |
| Increase in 22 years | - | 52.90 |
Source: Short term study to update CTTS (1992-95)(CMDA, RITES & PTCS, 2004)