3.05 Chennai (earlier called as Madras) was established in 1639, as one of the East India Company's earliest trading Ports and later became the centre of the company's control over Southern India. By 1700, Madras had become a thriving city with about 3 lakhs inhabitants; most of them lived in the Black Town in the north of the British Fort St. George. By the end of the eighteenth century, according to Dupuis (1968), the north of the city had become profoundly different from the south. The north was densely populated, with Black Town, the heart of the city. To the south were the open spaces and scattered settlements of the Europeans. By the time of the first census in 1871, the city had reached over 4 lakh. The first railway line between Madras and Arcot was opened in 1856 and the Madras Port was improved in 1890, which had attracted industrial developments to the north of the black zones renamed as George Town in 1905. The growth of Chennai City continued in the twentieth century and it has grown to the fourth largest Metro City in India.
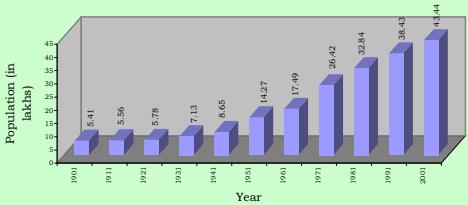
3.06 An area about 67 Sq.km. containing 16 hamlets was constituted as the City of Madras in 1798 and subsequently enlarged from time to time. Its enlargement and growth of population since 1901 is given in table No. 3.04.
Urbanisation in India by Robert W. Bradnock, 1984.
Table No.3.04: Growth of Population in Chennai City, 1901-2001
| 1901 1911 1921 1931 1941 195 | 1 1961 | 1971 1981 1991 2001 |
|---|---|---|
| C init lyak phospulation 5.41 5.56 5.78 7.13 8.65 14. | 27 17.49 | 24.69 32.85 38.43 43.44 |
| Area in sq.km. 68.17 68.17 68.17 68.17 77.21 128. | 83 128.83 | 128.83 176 176 176 |
| Annual Rate of | ||
| g proopwutlhat oiofn * (in -- 0.27 0.39 2.12 0.69 -0. | 11 2.06 | 3.51 -0.27 1.58 1.23 |
| percent) | ||
| Population | ||
| density per 80 82 85 105 112 1 | 11 136 | 192 187 218 247 |
| Hect. |
*Note: Arrived for a unit area for the purpose of comparison since the city extent varied over time. The figures given are for the decade ended with that year.
Source: Census of India
3.07 The city Corporation area recorded a higher growth of more than 2% per annum during the decades 1951-61 and 1961-71. The reasons for this rapid growth rate can be attributed to industrial developments and increase in economic activities and employment opportunities in the City and its suburbs attracting large migrant population. The negative growth arrived for a unit area during 1971-81 is due to the annexation of lesser dense (then) Panchayat areas around, to the City viz. Velacheri, Taramani, Kanagam, Thiruvanmiyur, Kodambakkam, Saligramam, Koyambedu, Senjery, Thirumangalam, Virugambakkam, Nesapakkam, Kolathur, Villivakkam, Konnur, Erukkanchery, Jambuli, Kodungaiyur, and Selaivoyal in 1978, comprising about 47 Sq.km.
Growth of Population in Chennai City
3.08 Chennai City Corporation area consists of 155 divisions within 10 zones (Zone No. I to X) presently. The number of these divisions and its extent varied over time. Hence, for the purpose of comparison, the demographic details have been arrived for the years 1971, 1981 and 1991 keeping the 155 Corporation division boundaries in 2001 as the basis. Spatial distribution of population growth in the City is given in the table no.3.05.
Table No. 3.05: Chennai City - Population Growth in Corporation Zones, 1971-2001
| Zone Nos. | Corporation Zone | Area in Sq.km. | Population in Lakhs | Annual rate of growth in percent | Density per Hectare in 2001 | |||||
| 1971 | 1981 | 1991 | 2001 | 71-81 | 81-91 | 91-01 | ||||
| I. | Tondiarpet | 17.30 | 2.01 | 2.69 | 3.72 | 4.10 | 2.95 | 3.28 | 1.00 | 243 |
| II | Basin Bridge | 11.52 | 3.59 | 3.52 | 3.27 | 3.76 | -0.21 | -0.74 | 1.40 | 335 |
| III | Pulianthope | 13.51 | 3.34 | 4.13 | 4.31 | 4.60 | 2.13 | 0.44 | 0.64 | 349 |
| IV | Ayanavaram | 19.76 | 2.22 | 3.58 | 4.12 | 4.97 | 4.89 | 1.42 | 1.89 | 258 |
| V | Kilpauk | 26.38 | 2.18 | 3.45 | 4.94 | 5.42 | 4.68 | 3.66 | 0.93 | 211 |
| VI | Ice-House | 10.15 | 3.27 | 3.49 | 3.20 | 3.42 | 0.63 | -0.84 | 0.65 | 346 |
| VII | Nungambakkam | 12.90 | 2.91 | 3.09 | 3.20 | 3.48 | 0.61 | 0.35 | 0.83 | 277 |
| VIII | Kodambakkam | 13.00 | 2.48 | 3.33 | 4.39 | 4.66 | 2.96 | 2.81 | 0.61 | 368 |
| IX | Saidapet | 23.56 | 1.89 | 2.61 | 3.33 | 4.15 | 3.25 | 2.48 | 2.23 | 180 |
| X | Mylapore | 27.92 | 2.50 | 2.97 | 3.95 | 4.88 | 1.70 | 2.89 | 2.13 | 180 |
| City Total | 176.00 | 26.42 | 32.85 | 38.43 | 43.44 | 2.20 | 1.58 | 1.23 | 247 | |
Source Census of India
3.09 Population growth in different zones within City Corporation area is found to be not uniform and its rate varied from 0.61% to 2.23%; Saidapet and Mylapore zones have recorded growth rate exceeding 2% during 1991 - 2001.
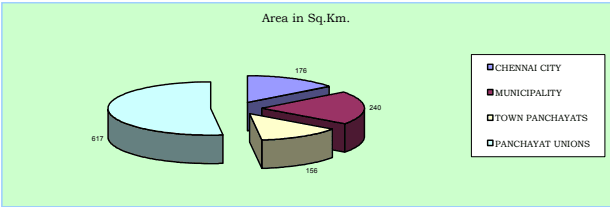
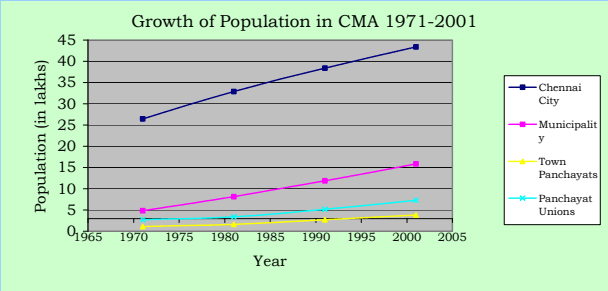
3.10 Chennai Metropolitan Area comprising City of Chennai and contiguous area around was notified in 1974. It extends over 1189 sq.km. and includes Chennai City Corporation area, 16 Municipalities, 20 Town Panchayats and 214 villages comprised in 10 Panchayat Unions.
| Table No. 3.06: CMA - Population Growth in Municipalities - 1971-2001 | |||||||||||
| No.. l S | Municipality | .m k Sqn. iaer A | Population in thousands | Annual Rate of growth in percent | itre psy 0021t. Dne Hce | ||||||
| 1971 | 1981 | 1991 | 2001 | 71-81 | 81-91 | 91-01 | Avg. | ||||
| 1 | Kathivakkam | 4.75 | 16.14 | 22.10 | 27.17 | 32.59 | 3.19 | 2.09 | 1.84 | 2.37 | 69 |
| 2 | Thiruvottiyur | 21.35 | 82.85 | 134.01 | 168.64 | 212.28 | 4.93 | 2.32 | 2.33 | 3.19 | 99 |
| 3 | Madhavaram | 17.41 | 21.05 | 29.46 | 49.26 | 76.09 | 3.41 | 5.28 | 4.45 | 4.38 | 44 |
| 4 | Ambattur | 37.77 | 45.59 | 115.90 | 215.42 | 310.97 | 9.78 | 6.39 | 3.74 | 6.64 | 82 |
| 5 | Avadi | 61.57 | 77.41 | 124.70 | 183.22 | 229.40 | 4.88 | 3.92 | 2.27 | 3.69 | 38 |
| 6 | Poonamallee | 6.55 | 18.72 | 23.67 | 28.83 | 42.60 | 2.37 | 1.99 | 3.98 | 2.78 | 65 |
| 7 | Thiruverkadu | 18.63 | 13.08 | 17.23 | 27.84 | 32.20 | 2.79 | 4.92 | 1.47 | 3.06 | 17 |
| 8 | Maduravoyal | 4.78 | 6.46 | 7.45 | 14.88 | 43.61 | 1.44 | 7.17 | 11.35 | 6.65 | 91 |
| 9 | Valasarawakkam | 2.97 | 2.41 | 7.58 | 21.95 | 30.98 | 12.12 | 11.22 | 3.50 | 8.95 | 104 |
| 10 | Alandur | 8.08 | 65.04 | 97.45 | 125.24 | ||||||
Source; Arrived based on Census figures
3.11 The high growth rate of more than 5% was found in Ambattur, Maduravoyal, Valasaravakkam, Ullagaram-Puzhithivakkam, Manali and Pammal Municipalities. Kathivakkam, Poonamallee, Alandur and Tambaram Municipalities recorded low growth rates and the rest fall under moderate growth rate category. Maduravoyal Municipality recorded the highest growth rate of 11.35% in the last decade 1991-2001.
| Table No.3.07: CMA - Population Growth in Town Panchayats - 1971-2001 | |||||||||||
| Sl. No. | Town Panchayat | Area in Sq.Km. | Population (in thousands) | Annual Rate of growth | itre psny 0021tce. De H | ||||||
| 1971 | 1981 | 1991 | 2001 | 71-81 | 81-91 | 91-01 | Avge. | ||||
| 1 | Minjur | 8.63 | 7.24 | 13.62 | 19.49 | 23.74 | 6.52 | 3.64 | 2.00 | 4.05 | 28 |
| 2 | Chinnasekkadu | 1.67 | 2.21 | 2.68 | 8.42 | 9.74 | 1.95 | 12.13 | 1.46 | 5.18 | 58 |
| 3 | Puzhal | 6.74 | 6.94 | 9.26 | 15.87 | 20.64 | 2.93 | 5.53 | 2.66 | 3.71 | 31 |
| 4 | Naravarikuppam | 20.76 | 9.96 | 14.67 | 17.41 | 18.33 | 3.95 | 1.72 | 0.52 | 2.06 | 9 |
| 5 | Thirunindravur | 14.56 | 6.94 | 9.13 | 16.31 | 29.33 | 2.78 | 7.78 | 4.27 | 4.94 | 20 |
| 6 | Porur | 3.72 | 3.54 | 8.63 | 19.51 | 28.92 | 9.33 | 8.49 | 4.02 | 7.28 | 78 |
| 7 | Thirumazhisai | 7.25 | 9.56 | 11.01 | 14.54 | 16.29 | 1.42 | 2.82 | 1.14 | 1.79 | 22 |
| 8 | Mangadu | 5.63 | 10.98 | 11.23 | 16.06 | 19.42 | 0.22 | 3.64 | 1.92 | 1.93 | 35 |
| 9 | Nandambakkam | 2.61 | 4.72 | 7.68 | 10.56 | 9.34 | 4.98 | 3.24 | -1.22 | 2.33 | 36 |
| 10 | Meenambakkam | 3.03 | 2.51 | 3.09 | 3.80 | 3.61 | 2.13 | 2.09 | -0.52 | 1.23 | 12 |
Source; Arrived based on Census figures
3.12 From the above, it may be seen that Chinnasekkadu, Porur, Perungalathur, Peerkkankaranai, Chithalapakkam, Sembakkam, Madambakkam, Perungudi and Pallikkaranai Town Panchayats had high growth rates exceeding 5% and Minjur, Puzhal, Thirunindravur, Thiruneermalai and Sholinganallur had recorded moderate growth rates in population; the rest have low growth rates of below 3%.
Table No. 3.08: CMA - Population Growth in Panchayat Unions - 1971-2001
| S.No | . Pa Uncnhioanyat | Population An <sub>Area</sub> <sub>in</sub> <sup>Sq</sup>.Km <sub>1971</sub> <sub>1981</sub> <sub>1991</sub> <sub>2001</sub> | nual Rat71-81 | e of gro81-91 | wth in %91-01 | Ave. H | Density perect.2001 |
|---|---|---|---|---|---|---|---|
| 1 | Minjur (4 Villages) | 40.02 11015 13900 17032 23368 | 2.35 | 2.05 | 3.21 | 2.54 | 6 |
| 2 | Sholavaram (41 Villages) | 131.58 44069 59286 82773 97068 | 3.01 | 3.39 | 1.61 | 2.67 | 7 |
| 3 | Puzhal (28 Villages) | 46.87 23739 30493 41661 51081 | 2.54 | 3.17 | 2.06 | 2.59 | 11 |
| 4 | Villivakkam (25 Villages) | 84.53 37712 46787 91488143070 | 2.18 | 6.94 | 4.57 | 4.56 | 17 |
| 5 | Thiruvallur (1 village) | 11.39 4409 5505 7789 8719 | 2.24 | 3.53 | 1.13 | 2.30 | 8 |
| 6 | Poonamallee (42 villages) | 75.44 56439 60435 66742 71767 | 0.69 | 1.00 | 0.74 | 0.81 | 10 |
| 7 | Kundrathur (30 villages) | 80.36 44050 50552 68435105610 | 1.39 | 3.08 | 4.46 | 2.97 | 13 |
| 8 | Sriperumbudur (4 villages) | 20.16 1647 757 0 80 | -7.48 | -100 | -- | -- | 4 |
| 9 | St.Thomas Mount (33 Villages) | 98.39 34773 56118 122435199235 | 4.90 | 8.11 | 4.99 | 6.00 | 20 |
| 10 | Kattankulathur (6 Villages) Total | 28.26 9490 14905 21891 30695617.00267303 338738 520246 730792 | 4.62 | 3.922.67 | 3.445.18 | 3.994.37 | 1112 |
Source: Arrived based on Census figures