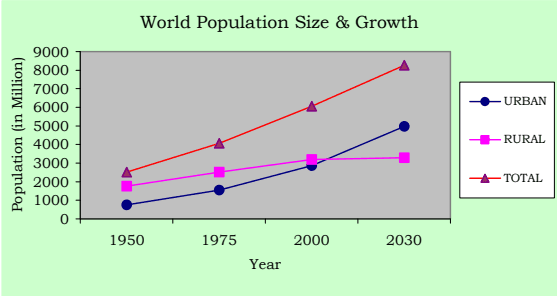
History of the world during the last century has shown that the process of urbanisation and economic growth progress are mutually reinforcing. Cities are the loci and motors of economic and social change. According to United Nations Projections, the World's urban population will grow from 2.86 billion in 2000 to 4.98 billion by 2030 and the World's annual urban growth rate is projected as 1.8 per cent in contrast to the rural growth rate of 0.1 per cent. About 60 per cent of the World's population will live in cities by 2030.
Table No.3.01: World Population Size and Growth, Urban and Rural
Mid-year population size (million)
Population growth rate (percent)
1950
1975
2000
2030
1950-75
1975-00
2000-30
Urban
World Total
751
1543
2862
4981
2.9
2.4
1.8
High-income countries
359
562
697
825
1.8
0.9
0.6
Middle and low income countries
392
981
2165
4156
3.7
3.2
2.2
Rural
World Total
1769
2523
3195
3289
1.4
0.9
0.1
High-income countries
219
187
184
139
-0.6
-0.07
-0.9
Middle and low income countries
1550
2336
3011
3151
1.6
1
0.2
Note: High-income countries have gross national income per capita of US$9266 or more based on World Bank estimates.
Source: National Research Council, 2003, P.85.
1 The state of the World’s cities 2004-05 Globalisation and Urban Culture, published by Earth scan in 2004
Urbanisation in India
3.02 India, the second largest populous country in the World has one of the longest urban traditions. By the year 2000 BC itself India had an extensive network of towns. Even before the British traders made contact with India (by AD 1600), there was broad regional distribution of towns. These towns were not just of administration, but also of trade and marketing, cultural activities and religious pilgrimage, defence and fortification. New cities - Madras, Calcutta and Bombay were founded by 17th Century. The early British settlements became the means of transforming urban system in India. During the 19th century, the Cities were to be for industrial activities and also became hub of the transport network.
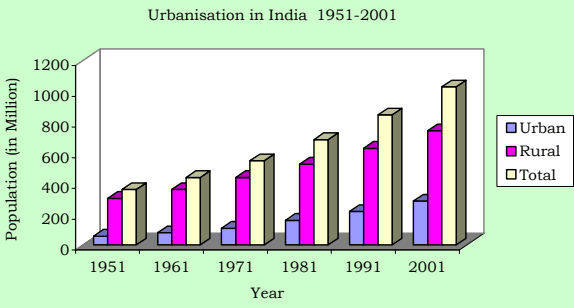
3.03 In a formerly rural economy country like India, because of the need to decrease the number of persons dependent on agriculture and to improve productivity in rural areas, urbanisation is viewed as a prerequisite of growth. The urban population in India has grown from 25.7 million in 1901 to 286.1 million in 2001. After Independence in 1947, the rate of growth of urban population increased from 2.64 percent in 1951 to 3.88 percent in 1981 and thereafter declined to 2.77 in 2001; but the share of urban population to the total population of the country constantly increased from 10.9 percent in 1901 to 15.92 percent in 1951, and thereafter to 27.81 per cent in 2001.
Table No.3.02: Urbanisation in India 1951-2001
Urban
1951
1961
1971
1981
1991
2001
Population (in million)
57.50
78.90
109.10
159.70
217.60
286.10
Annual, Rate of Growth (Percent)
2.64
3.21
3.29
3.88
3.14
2.77
% of urban total population
15.92
17.96
19.90
23.30
25.71
27.81
Rural
Population (in million)
303.60
360.30
439.10
525.50
628.70
742.60
Annual, Rate of Growth
1.02
1.73
2.00
1.81
1.81
1.68
% of rural to total population
84.08
82.04
80.01
76.70
74.29
72.19
Total
Population (in million)
361.10
439.20
548.20
685.20
846.30
1028.70
Annual, Rate of Growth
1.26
1.98
2.24
2.26
2.13
1.97
Source: Census of India
Urbanisation in Tamilnadu
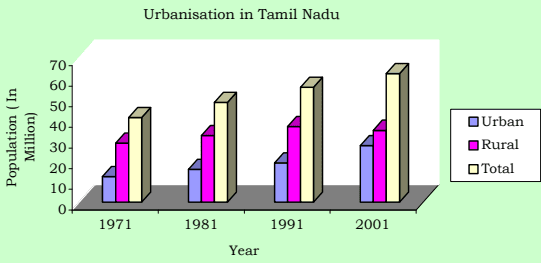
3.04 Tamilnadu has emerged as the third largest economy in India. Cities exist and grow because of economies of urban agglomeration associated with industrial and trade activities. In the recent past, liberalisation, rapidly growing IT sector, an educated, hardworking and disciplined work force etc, accelerating economic development also contributed to the growth of urban areas in Tamilnadu. The extent of the State is 130,058 sq.km. of which the urban area accounts for 12,525 sq.km. Tamilnadu is the most urbanised state in India. It is one of the few states in India with hierarchy of urban areas dispersed fairly uniformly through-out the State. Its urban population has grown from 12.46 million in 1971 to 27.48 million in 2001. Its percentage share of urban population to total population stood always much above the national average.
Table No.3.03: Urbanisation in Tamilnadu (1971-2001)
1971
1981
1991
2001
Urban
Population (in million)
12.46
15.95
19.08
27.48
Annual, Rate of Growth (percent)
3.32
2.50
1.91
3.72
% to total
30.26
32.95
34.15
44.04
Rural
Population (in million)
28.73
32.46
36.78
34.92
Annual, Rate of Growth (percent)
1.53
1.23
1.26
-0.52
% to total
69.74
67.05
65.85
55.94
Total
Population (in million)
41.19
48.41
55.86
62.40
Annual, Rate of Growth (percent)
2.03
1.63
1.44
1.11
Area in Sq.Km.
130,069
130,050
130,050
130,050
Source: Census of India
Population Growth in Villages in Panchayat Unions
3.13 Attanthangal, Nallur, Sembilivakkam, Vijayavallur in Sholavaram Panchayat Union, Surapattu and Puttagaram in Puzhal Panchayat Union, Keelakondaiyur, Nolambur, Vanagaram, Ayapakkam, Nerkundram and Ramapuram in Villivakkam Panchayat Union, Nemilicheri Nochimedu in Poonamallee Panchayat Union, Chinnapanicheri, Kulathavancheri, Srinivasapuram, Ayyappanthangal, Thelliar Agaram, Mugalivakkam, Manapakkam, Gerugambakkam, Tharapakkam, Kavanur and Nandambakkam in Kundrathur Panchayat Union, Neelankarai, Injambakkam, Okkiam Thuraipakkam, Kovilambakkam, Mudichur, Vengaivasal, Maduraipakkam, Mullaicheri, Arsankalani and Uthandi in St.Thomas Mount Panchayat Union and Mannivakkam in Kattankulathur Panchayat Union have recorded high growth rate during in 1991-2001 exceeding 5%. The villages in St. Thomas Mount Panchayat Union recorded the highest annual growth rate of 6% during 1991 - 2001.
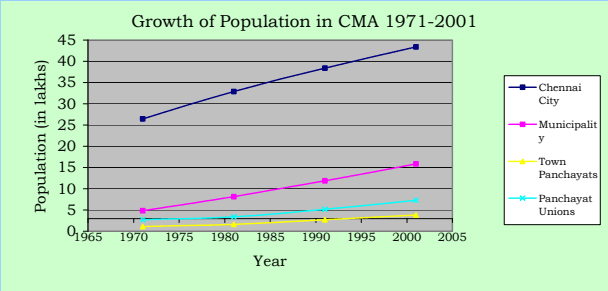
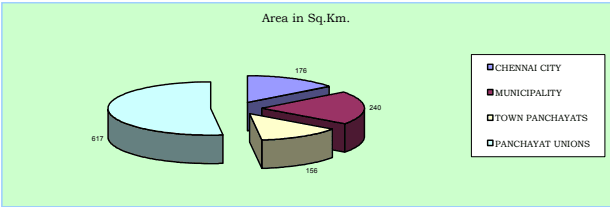
3.14 The overall growth of population in CMA from 1971 to 2001 is given in the table below:
Table No. 3.09: Growth of Population in CMA, 1971 - 2001
Sl. No.
Population (in lakhs)1971 1981 1991 2001
Annual Rate of growth (in percent)71- 81- 91-81 91 01
i Anaer k Smq..
re i Dt psney Htce. i00 21n
1.2.
Chennai City Municipalities
26.424.84
32.858.14
38.4311.84
43.4415.81
2.20 1.58 1.235.24 3.80 2.91
176240
24766
3.
Town Panchayats
1.11
1.64
2.71
3.86
4.43 4.94 3.62
156
25
4.
Panchayat Unions
2.67
3.38
5.20
7.31
2.40 4.38 3.58
617
12
5.
CMA Total
35.04
46.01
58.18
70.41
2.76 2.37 1.93
1189
59
Source; Arrived based on Census figures
3.15. The rate of growth in the local bodies within CMA is given in the Sheet No 2.5 & 2.6 from which it may be seen that the proximity to the main city and major urban centres, rail transport availability, ground water availability and residentially developed land availability are the major reasons for faster growth of certain areas within the CMA.
Growth of population in Chennai city and CMA
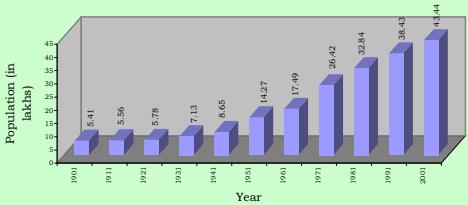
3.05 Chennai (earlier called as Madras) was established in 1639, as one of the East India Company's earliest trading Ports and later became the centre of the company's control over Southern India. By 1700, Madras had become a thriving city with about 3 lakhs inhabitants; most of them lived in the Black Town in the north of the British Fort St. George. By the end of the eighteenth century, according to Dupuis (1968), the north of the city had become profoundly different from the south. The north was densely populated, with Black Town, the heart of the city. To the south were the open spaces and scattered settlements of the Europeans. By the time of the first census in 1871, the city had reached over 4 lakh. The first railway line between Madras and Arcot was opened in 1856 and the Madras Port was improved in 1890, which had attracted industrial developments to the north of the black zones renamed as George Town in 1905. The growth of Chennai City continued in the twentieth century and it has grown to the fourth largest Metro City in India.
3.06 An area about 67 Sq.km. containing 16 hamlets was constituted as the City of Madras in 1798 and subsequently enlarged from time to time. Its enlargement and growth of population since 1901 is given in table No. 3.04.
Urbanisation in India by Robert W. Bradnock, 1984.
Table No.3.04: Growth of Population in Chennai City, 1901-2001
1901 1911 1921 1931 1941 195
1 1961
1971 1981 1991 2001
C init lyak phospulation 5.41 5.56 5.78 7.13 8.65 14.
27 17.49
24.69 32.85 38.43 43.44
Area in sq.km. 68.17 68.17 68.17 68.17 77.21 128.
83 128.83
128.83 176 176 176
Annual Rate of
g proopwutlhat oiofn * (in -- 0.27 0.39 2.12 0.69 -0.
11 2.06
3.51 -0.27 1.58 1.23
percent)
Population
density per 80 82 85 105 112 1
11 136
192 187 218 247
Hect.
*Note: Arrived for a unit area for the purpose of comparison since the city extent varied over time. The figures given are for the decade ended with that year.
Source: Census of India
3.07 The city Corporation area recorded a higher growth of more than 2% per annum during the decades 1951-61 and 1961-71. The reasons for this rapid growth rate can be attributed to industrial developments and increase in economic activities and employment opportunities in the City and its suburbs attracting large migrant population. The negative growth arrived for a unit area during 1971-81 is due to the annexation of lesser dense (then) Panchayat areas around, to the City viz. Velacheri, Taramani, Kanagam, Thiruvanmiyur, Kodambakkam, Saligramam, Koyambedu, Senjery, Thirumangalam, Virugambakkam, Nesapakkam, Kolathur, Villivakkam, Konnur, Erukkanchery, Jambuli, Kodungaiyur, and Selaivoyal in 1978, comprising about 47 Sq.km.
Growth of Population in Chennai City
3.08 Chennai City Corporation area consists of 155 divisions within 10 zones (Zone No. I to X) presently. The number of these divisions and its extent varied over time. Hence, for the purpose of comparison, the demographic details have been arrived for the years 1971, 1981 and 1991 keeping the 155 Corporation division boundaries in 2001 as the basis. Spatial distribution of population growth in the City is given in the table no.3.05.
Table No. 3.05: Chennai City - Population Growth in Corporation Zones, 1971-2001
Zone Nos.
Corporation Zone
Area in Sq.km.
Population in Lakhs
Annual rate of growth in percent
Density per Hectare in 2001
1971
1981
1991
2001
71-81
81-91
91-01
I.
Tondiarpet
17.30
2.01
2.69
3.72
4.10
2.95
3.28
1.00
243
II
Basin Bridge
11.52
3.59
3.52
3.27
3.76
-0.21
-0.74
1.40
335
III
Pulianthope
13.51
3.34
4.13
4.31
4.60
2.13
0.44
0.64
349
IV
Ayanavaram
19.76
2.22
3.58
4.12
4.97
4.89
1.42
1.89
258
V
Kilpauk
26.38
2.18
3.45
4.94
5.42
4.68
3.66
0.93
211
VI
Ice-House
10.15
3.27
3.49
3.20
3.42
0.63
-0.84
0.65
346
VII
Nungambakkam
12.90
2.91
3.09
3.20
3.48
0.61
0.35
0.83
277
VIII
Kodambakkam
13.00
2.48
3.33
4.39
4.66
2.96
2.81
0.61
368
IX
Saidapet
23.56
1.89
2.61
3.33
4.15
3.25
2.48
2.23
180
X
Mylapore
27.92
2.50
2.97
3.95
4.88
1.70
2.89
2.13
180
City Total
176.00
26.42
32.85
38.43
43.44
2.20
1.58
1.23
247
Source Census of India
3.09 Population growth in different zones within City Corporation area is found to be not uniform and its rate varied from 0.61% to 2.23%; Saidapet and Mylapore zones have recorded growth rate exceeding 2% during 1991 - 2001.
3.10 Chennai Metropolitan Area comprising City of Chennai and contiguous area around was notified in 1974. It extends over 1189 sq.km. and includes Chennai City Corporation area, 16 Municipalities, 20 Town Panchayats and 214 villages comprised in 10 Panchayat Unions.
Table No. 3.06: CMA - Population Growth in Municipalities - 1971-2001
No.. l S
Municipality
.m k Sqn. iaer A
Population in thousands
Annual Rate of growth in percent
itre psy 0021t. Dne Hce
1971
1981
1991
2001
71-81
81-91
91-01
Avg.
1
Kathivakkam
4.75
16.14
22.10
27.17
32.59
3.19
2.09
1.84
2.37
69
2
Thiruvottiyur
21.35
82.85
134.01
168.64
212.28
4.93
2.32
2.33
3.19
99
3
Madhavaram
17.41
21.05
29.46
49.26
76.09
3.41
5.28
4.45
4.38
44
4
Ambattur
37.77
45.59
115.90
215.42
310.97
9.78
6.39
3.74
6.64
82
5
Avadi
61.57
77.41
124.70
183.22
229.40
4.88
3.92
2.27
3.69
38
6
Poonamallee
6.55
18.72
23.67
28.83
42.60
2.37
1.99
3.98
2.78
65
7
Thiruverkadu
18.63
13.08
17.23
27.84
32.20
2.79
4.92
1.47
3.06
17
8
Maduravoyal
4.78
6.46
7.45
14.88
43.61
1.44
7.17
11.35
6.65
91
9
Valasarawakkam
2.97
2.41
7.58
21.95
30.98
12.12
11.22
3.50
8.95
104
10
Alandur
8.08
65.04
97.45
125.24
Source; Arrived based on Census figures
3.11 The high growth rate of more than 5% was found in Ambattur, Maduravoyal, Valasaravakkam, Ullagaram-Puzhithivakkam, Manali and Pammal Municipalities. Kathivakkam, Poonamallee, Alandur and Tambaram Municipalities recorded low growth rates and the rest fall under moderate growth rate category. Maduravoyal Municipality recorded the highest growth rate of 11.35% in the last decade 1991-2001.
Table No.3.07: CMA - Population Growth in Town Panchayats - 1971-2001
Sl. No.
Town Panchayat
Area in Sq.Km.
Population (in thousands)
Annual Rate of growth
itre psny 0021tce. De H
1971
1981
1991
2001
71-81
81-91
91-01
Avge.
1
Minjur
8.63
7.24
13.62
19.49
23.74
6.52
3.64
2.00
4.05
28
2
Chinnasekkadu
1.67
2.21
2.68
8.42
9.74
1.95
12.13
1.46
5.18
58
3
Puzhal
6.74
6.94
9.26
15.87
20.64
2.93
5.53
2.66
3.71
31
4
Naravarikuppam
20.76
9.96
14.67
17.41
18.33
3.95
1.72
0.52
2.06
9
5
Thirunindravur
14.56
6.94
9.13
16.31
29.33
2.78
7.78
4.27
4.94
20
6
Porur
3.72
3.54
8.63
19.51
28.92
9.33
8.49
4.02
7.28
78
7
Thirumazhisai
7.25
9.56
11.01
14.54
16.29
1.42
2.82
1.14
1.79
22
8
Mangadu
5.63
10.98
11.23
16.06
19.42
0.22
3.64
1.92
1.93
35
9
Nandambakkam
2.61
4.72
7.68
10.56
9.34
4.98
3.24
-1.22
2.33
36
10
Meenambakkam
3.03
2.51
3.09
3.80
3.61
2.13
2.09
-0.52
1.23
12
Source; Arrived based on Census figures
3.12 From the above, it may be seen that Chinnasekkadu, Porur, Perungalathur, Peerkkankaranai, Chithalapakkam, Sembakkam, Madambakkam, Perungudi and Pallikkaranai Town Panchayats had high growth rates exceeding 5% and Minjur, Puzhal, Thirunindravur, Thiruneermalai and Sholinganallur had recorded moderate growth rates in population; the rest have low growth rates of below 3%.
Table No. 3.08: CMA - Population Growth in Panchayat Unions - 1971-2001
S.No
. Pa Uncnhioanyat
Population An <sub>Area</sub> <sub>in</sub> <sup>Sq</sup>.Km <sub>1971</sub> <sub>1981</sub> <sub>1991</sub> <sub>2001</sub>
3.16 The cosmopolitan nature of Chennai was a reflection of its attractions to migrant groups from all over India. Migrants came not only predominantly from the surrounding Tamil and Telugu speaking areas but also from southern and northern India. These migrant groups from other states have made their distinctive mark on the patterns of residential and social organisations within this Chennai Metropolis.
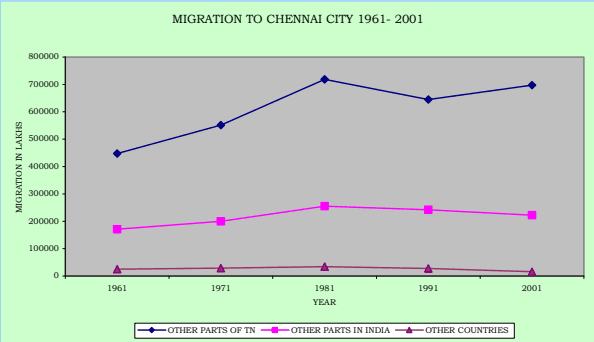
3.17 Chennai is a city of migrants like any other metropolitan city in India. According to 2001 Census, migrants to Chennai City from other parts of Tamil Nadu State constitute 74.5 % and the table no. 3.10 shows a downward trend in the migration to the City from 37.24% in 1961 to 21.57% in 2001. Migrants from other parts of India constitute 23.8% and the remaining 1.71 % of the migrants is from other countries.
Table No. 3.10: Migration to Chennai City, 1961-01 (in Lakhs)
Year
Total Population
Total migrants to the city from
% of Total Migrants to the total population
Other parts of Tamil nadu
Other parts of India (Excluding Tamilnadu)
Other Countries
Un-classi-fiable
Total migrants
No.
%
No.
%
No.
%
1961
17.29
4.47
69.45
1.71
26.6
0.25
3.90
--
6.44
37.24
1971
24.69
5.51
70.61
2.00
25.63
0.29
3.76
--
7.80
31.59
1981
32.84
7.19
71.28
2.55
25.31
0.34
3.41
--
10.08
30.70
1991
38.43
6.44
70.51
2.42
26.47
0.28
3.01
0.04
9.18
23.90
2001
43.44
6.98
74.49
2.23
23.80
0.16
1.71
9.37
21.57
Source: Census of India, 1961, 1971 & 1981, 1991 Social and Cultural Table
146.29
4.13
2.54
1.57
2.74
181
11
Ullagaram-Puzhithivakkam
3.64
2.38
8.58
16.13
30.42
13.69
6.52
6.55
8.92
84
12
Anakaputhur
2.98
10.88
15.30
24.35
31.92
3.46
4.76
2.75
3.66
107
13
Pammal
5.19
9.05
27.82
36.51
50.00
11.89
2.75
3.20
5.95
96
14
Pallavaram
16.10
51.37
83.90
111.87
144.62
5.03
2.92
2.60
3.52
90
15
Tambaram
20.72
58.81
86.92
113.29
137.93
3.99
2.69
1.99
2.89
66
16
Manali
7.49
3.34
11.96
19.09
28.60
13.61
4.79
4.12
7.51
38
Total
239.99
484.58
814.02
1183.68
1580.5
5.32
3.82
2.93
4.02
66
11
Kundrathur
12.16
14.45
16.42
22.79
25.07
1.29
3.33
0.93
1.85
21
12
Thiruneermalai
5.87
6.31
9.95
17.94
19.23
4.66
6.07
0.70
3.81
33
13
Perungalathur
7.04
3.71
6.29
11.24
19.59
5.40
5.98
5.72
5.70
28
14
Peerkankaranai
1.76
3.58
5.28
10.74
17.51
3.96
7.37
5.01
5.45
99
15
Chitlapakkam
2.90
5.32
11.72
15.90
25.31
8.22
3.10
4.76
5.36
88
16
Sembakkam
6.35
2.60
6.10
13.50
21.50
8.86
8.32
4.75
7.31
34
17
Madambakkam
7.92
2.32
3.49
8.21
17.00
4.14
8.94
7.55
6.88
22
18
Perungudi
4.64
1.74
4.28
9.71
23.58
9.40
8.54
9.28
9.08
51
19
Pallikkaranai
17.43
2.32
3.93
7.82
22.07
5.40
7.13
10.93
7.82
13
20
Sholinganallur
15.35
4.23
5.75
8.53
15.56
3.12
4.02
6.20
4.45
10
Total
156.02
111.18
164.19
271.35
385.72
4.40
5.13
3.62
4.38
25
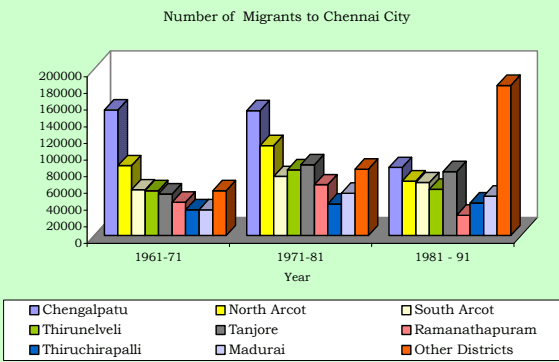
3.18 According to 1991 Census migrants from the nearby districts of Chengalpattu District (now bifurcated as Kancheepuram and Thiruvallur Districts), North Arcot District (now renamed as Vellore District) and South Arcot District (now bifurcated as Villupuram and Thiruvannamalai Districts) alone constitute 33% and Thirunelveli and Thanjavur Districts constitute another 21% of total migrant population to Chennai City. From the table no. 3.11 it may also be seen that the proportion of migration from other districts have almost tripled.
Table No. 3.11: Migration to Chennai city from the Districts of Tamilnadu, 1961-91
District
No. Of Migrants to Chennai city
Percentage to Total Migrants
1961-71
1971-81
1981 - 91
1961-71
1971-81
1981 - 91
Chengalpattu
151000
150000
81830
27.5
20.9
12.8
North Arcot
84000
108000
65550
15.3
15.0
10.3
South Arcot
55000
71000
63670
10.0
9.9
10.04
Thirunelveli
54000
79000
55530
9.8
11.0
8.75
Tanjavur
50000
85000
76760
9.1
11.8
12.1
Ramanathapuram
40000
61000
24390
7.3
8.5
3.84
Thiruchirapalli
31000
38000
39170
5.6
5.3
6.2
Madurai
31000
51000
47292
5.6
7.1
7.5
Other Districts
54000
80000
180230
9.8
10.5
28.4
Total
550000
719000
634422
100.0
100.0
100.0
Source: Structure Plan for MMA, and Census of India 1981and 1991 Tamilnadu Migration Tables
3.19 Increase in immigration to the City and also to the CMA is evident from the table Nos. 3.11 and 3.12.
3.20 Study conducted by the Time Research Foundation in 1991 (sponsored by CMDA) showed that:
i) Migrants from other urban areas constitute 63.4% and only 36.3% are from rural areas.
ii) Among migrants from urban areas, female migrants outnumber male migrants.
iii) Among rural migrants, male migrants out-number female migrants.
iv) Among total migrants there is near parity as between male and female migrants.
v) In respect of migrants from southern region of the state, the urban proportion (75%) is higher and the rural proportion being only 25%
vi) Among migrants from other southern states of India, there are more female migrants than male migrants (with migrants from Kerala being an exception) and vii) The reason on 'family moved' shows the household movement and it constitutes 30%; for marriage reasons another 25% migrated.
Table No. 3.12: Migration into CMA 2001
Sl. No.
Place
Males
Female
Total
Percentage to Total
1.
Total Migrants
855103
753196
1608299
2.
Elsewhere in the district of enumeration
138235
124844
263079
16.35
3.
Other Districts of the State
549214
471981
1021195
63.50
4.
Outside the state
155431
145307
300738
18.70
5.
Outside India
25360
22360
23287
1.45
Source: Census of India, Tamil nadu Migration Tables-2001
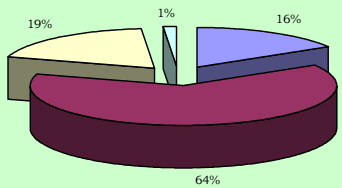
Migration into CMA 2001
Outside the State
Outside India
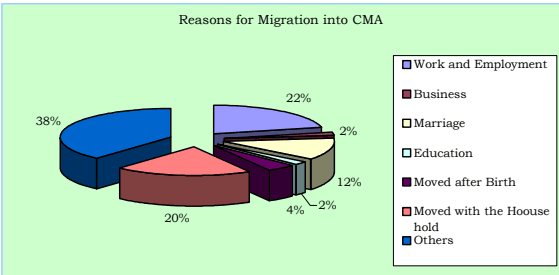
Table No. 3.13: Reasons for Migration into CMA - 2001
Reason
Migrants
% to total
Males
Females
Total
Work & Employment
300939
44761
345700
21.50
Business
20719
4553
25272
1.57
Education
20314
9157
29471
1.83
Marriage
10737
189828
200565
12.47
Moved after birth
38250
30617
68867
4.28
Moved with the Household
144611
175205
319816
19.89
others
319533
299075
618608
38.46
Total
855103
753196
1608299
100
Source: Census of India 2001 Tamil nadu Migration Table
3.21 The origin of the migrant population to the CMA and the reasons for the migration are given in the table Nos. 3.12 and 3.13.
3.22 An interesting and important fact found is the out migration from Chennai City to its suburbs and other areas. The population of the Chennai City in 1991 was 38.43 lakhs which includes 9.18 lakhs migrant population and natural increase of 6.40 lakhs (for 1981-91) population; the net population increase works out to only 5.59 lakhs which shows that there was a net out migration of 10 lakhs (30.4% of 1981 population) from City mostly to the rest of CMA (during 1981-1991). Similarly, an out migration of 10.19 lakhs (26.5% of the 1991 population) is noted during 1991-2001. Though there were large scale building construction activities noted during the above periods, the out migration of resident population from Chennai City proves that considerable conversion of residential premises into non-residential mostly for office, shopping, hotels and other
commercial purposes took place; this trend will continue in this metropolis.
Birth rate, death rate and rate of Natural Increase
3.23 Birth rates, death rates and rates of natural increase for the Chennai City are tabulated below:
(Per 1000 population)
Table No. 3.14: Chennai City - Birth, Death and Natural increase rates 1971-1976
Year
Crude Birth Rate
Crude Death Rate
Natural increase rate
1971
38.6
12.3
26.3
1972
37.8
12.7
25.1
1973
36.4
12.4
24.0
1974
34.4
11.5
22.9
1975
34.3
13.1
21.2
1976
32.1
12.0
20.1
Source: Structure Plan for CMA, 1980
(Per 1000 population)
Table No. 3.15: Chennai City - Birth, Death and Natural increase rates 1991-2003
Year
Crude Birth Rate
Crude Death Rate
Natural increase rate
1991
25.89
9.67
16.22
1992
24.01
9.50
14.51
1993
23.82
9.14
14.68
1994
23.39
9.07
14.32
1995
23.75
8.49
15.26
1996
22.68
8.54
14.14
1997
22.50
8.20
14.30
1998
23.81
9.00
14.81
1999
25.68
8.87
16.81
2000
25.53
8.92
16.61
2001
24.50
8.42
16.08
2002
23.72
8.27
15.45
2003
22.62
8.01
14.61
Source: Corporation of Chennai
3.24 From the above two tables, it may be seen that the registered birth rate in Chennai City in 1971 was 38.6 and it was varying from 38.6 to 32.1 during 1971-76. It has now reduced to 22.62 in the year 2003. Similarly the death rate also reduced to a considerable extent from 13.1 in 1975 to 8.01 in 2003. The rate of natural increase declined from 26.3 in 1971 to 14.61 in 2003 as detailed in the tables above.
3.25 The factors which affect birth rate includes age structure of population, the average age of marriage, and the incidence of family planning, among others. Increase
in longevity of life due to improved health facilities may also be a reason for reduction in the death rates in Chennai.
3.26 Birth and death rates in 2001 in some of the local bodies within CMA and also the average rates in the Kancheepuram and Thiruvallur districts wherein the rest of CMA falls are given in the Table below which show that these rates vary from local body to local body and that too a large extent.
(Per 1000 population)
Table No. 3.16: CMA - Birth, Death and Natural increase rates 2001
Local Body
Birth Rate
Death Rate
Natural increase rate
Kathivakkam Municipality
24.5
8.42
16.08
Ambattur Municipality
6.52
2.90
3.62
Avadi Municipality
13.05
3.21
9.84
Thiruverkadu Municipality
1.77
6.02
4.25
Maduravoyal Municipality
2.32
2.91
0.59
Valasarawakkam Municipality
16.21
3.91
12.30
Alandur Municipality
18.06
5.59
12.46
Ullagaram-Puzhudhivakkam
4.96
3.15
1.81
Municipality
Anakaputhur Municipality
3.04
3.92
0.88
Pammal Municipality
5.86
4.70
1.16
Pallavaram Municipality
26.50
4.80
21.70
Tambaram Municipality
21.88
6.13
15.75
Districts
Thiruvallur
11.26
4.73
6.53
Kancheepuram
15.58
5.74
9.84
Source: Concerned Local Bodies and Statistical year Book 2001