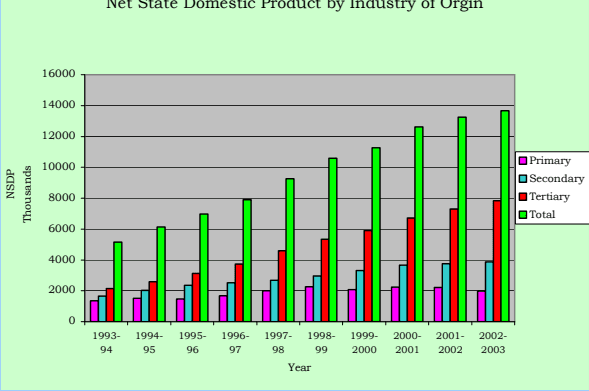
4.10 The economic structure of Tamil Nadu has metamorphosised from Primary sector in 1960s to tertiarised activities in 2000s. The percentage share of primary sector has declined from 43.5 percent in 1961 to 16 percent in 2002.
4.11 As regards the secondary sector, though it has increased from 20 percent in 1960 to 35 percent in 1996, it has declined subsequently. The percentage share of secondary sector in 2002-03 is only 29, which is mainly because there is a receding trend in the manufacturing sector.
Table No: 4.04: State Economy - Structural changes (in percentage)
| Year | Primary Sector | Secondary Sector | Tertiary Sector | Total |
|---|---|---|---|---|
| 1960-61 | 43.51 | 20.27 | 36.22 | 100 |
| 1970-71 | 34.79 | 26.88 | 38.33 | 100 |
| 1980-81 | 25.92 | 33.49 | 40.59 | 100 |
| 1990-91 | 23.42 | 33.10 | 43.48 | 100 |
| 1995-96 | 21.90 | 34.84 | 43.27 | 100 |
| 2000-01 | 19.04 | 30.49 | 50.47 | 100 |
| 2002-03 | 15.97 | 29.71 | 54.32 | 100 |
4.12 There is considerable increase in the growth of tertiary sector whose share is 54 percent in 2002 and the main reasons attributed to such a rapid growth is the contribution by the Information Technology, Information Technology Enabling Services and Business Process Outsourcing.
4.13 The industrial base of Tamil Nadu is diversified in the manufacturing sectors of automobile, textiles, leather and chemicals. Tamil Nadu is one of the leading States, which attracts more investment in IT. In terms of Foreign Direct Investment (1991-2003) Tamil Nadu stood third in the Nation. The new Industrial Policy of Tamil Nadu 2003 emphasize on optimal use of resources, upgradation of managerial skills and administration, technical improvements and modernization in the filed of manufacturing sector and infrastructure.
4.14 The industrial production in Tamil Nadu, which was passing through a tough phase in the past, has shown a moderate increase in 2002-2003, which is 2.4 percent as against 1.4 percent in 2001-2002. Textile products other than mills’ registered a growth of 31.9 percent followed by ‘other manufacturing’ (26.7percent), ‘non-metallic mineral products’ (18.0percent) and ‘paper and paper products’ (12.4percent). The other groups which registered positive growth are ‘machinery and equipments (8.9percent), ‘wool, silk and synthetic fibre textiles’ (7.7percent) ‘metal products and parts’ (4.3percent) and ‘transport equipment and parts’ (4.3percent). In terms of usebased classification except the Basic Goods industries, the other industries i.e. capital goods, intermediate goods and consumer goods have shown moderate growth. The consumer durable goods have recorded the highest growth rate of 16.5percent.