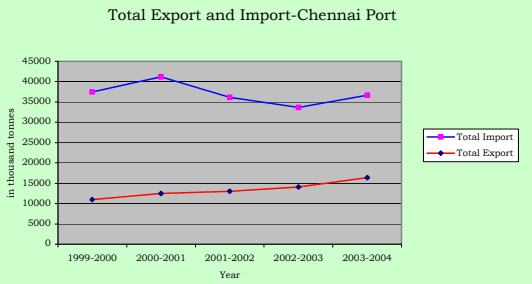
4.05 Tamil Nadu emerged as the third largest economy in India with State Domestic Product of Rs.1530 billion in 2002-2003.
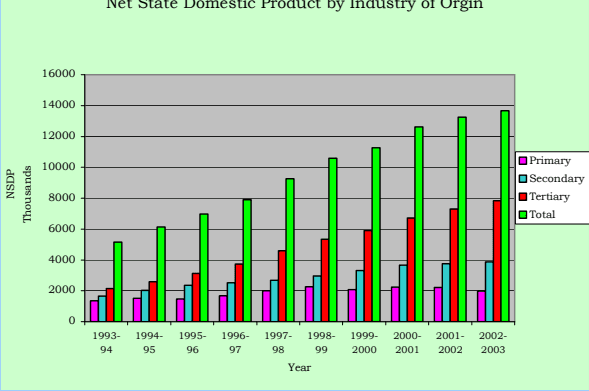
4.06 The table No 4.01 shows the growth of the Tamil Nadu State income in various sectors from 1993 to 2003.
Table No. 4.01: Net State Domestic Product (NSDP) in TN by industry of origin
| Sl. No. | Year | Primary | Secondary | Tertiary | Total | Per capita Income (Rs. in lakhs) |
|---|---|---|---|---|---|---|
| 1 | 1993-94 | 1355029 | 1660933 | 2148360 | 5164322 | 8955 |
| 2 | 1994-95 | 1512212 | 2019035 | 2596334 | 6127561 | 10503 |
| 3 | 1995-96 | 1472400 | 2367212 | 3132304 | 6971916 | 11818 |
| 4 | 1996-97 | 1668087 | 2507392 | 3736627 | 7912106 | 13270 |
| 5 | 1997-98 | 2001844 | 2680994 | 4586147 | 9268985 | 15388 |
| 6 | 1998-99 | 2256692 | 2972778 | 5349845 | 10579315 | 17394 |
| 7 | 1999-2000 | 2065946 | 3317462 | 5890654 | 11274062 | 18367 |
| 8 | 2000-2001 | 2231340 | 3670174 | 6708443 | 12609957 | 20367 |
| 9 | 2001-2002 | 2212614 | 3744409 | 7299696 | 13256719 | 21239 |
| 10 | 2002-2003 | 1980870 | 3870118 | 7827099 | 13678087 | 21738 |
Source: Statistical Hand Book of Tamil Nadu, 2003
Net State Domestic Product by Industry of Orgin
4.07 The Table No. 4.02 depicts the percentage change in the growth of Gross Domestic Product in Tamil Nadu.
Table No: 4.02. Growth in Gross State Domestic Product (1993-94) Prices - A Trend Analysis
| Year | Primary Sector | Secondary Sector | Tertiary Sector | GSDP |
|---|---|---|---|---|
| 1994-95 | 11.25 | 15.66 | 10.82 | 12.56 |
| 1995-96 | (-) 12.56 | 8.83 | 8.50 | 3.45 |
| 1996-97 | (-) 0.84 | 1.99 | 10.29 | 4.96 |
| 1997-98 | 8.51 | 2.26 | 11.90 | 7.82 |
| 1998-99 | 9.04 | 1.61 | 6.19 | 5.21 |
| 1999-2000 | (-) 4.77 | 10.00 | 7.51 | 5.81 |
| 2000-01(RE) | 4.56 | 5.88 | 9.45 | 7.35 |
| 2001-02(QE) | (-) 2.04 | (-) 0.19 | 6.36 | 2.68 |
| 2002-03(AE) | (-) 12.28 | 0.16 | 5.13 | 0.55 |
| AAGR | 0.10 | 5.13 | 8.46 | 5.60 |
Note: R.E – Revised Estimates, Q.E. – Quick estimates, A.E. – Advanced Estimates: Source: Department of Economics and Statistics, Chennai-6
4.08 At the National level, the Gross Domestic Product grew by 6 percent via-a-vis 5.6 percent in Tamil Nadu. In per capita terms, it increased by 3.97 percent at the National level whereas it was at 4.29 percent in Tamil Nadu.
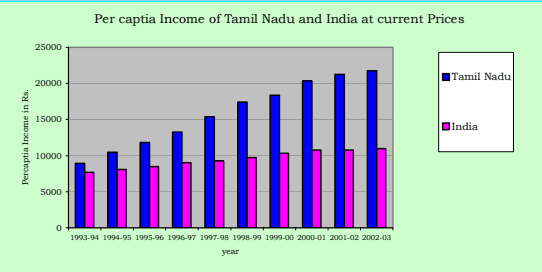
Table No.4.03: Per capita Income of State and India at current prices
4.09 The percapita income of Tamil Nadu State has risen from Rs.8, 955 in 1993-94 to Rs.21, 738 in 2002-2003.
| Table No.4.03: Per capita Income of State and India at current prices | |||
| Sl.No. | Year | Tamil Nadu Rs. | India Rs. |
| 1 | 1993-1994 | 8955 | 7690 |
| 2 | 1994-1995 | 10503 | 8088 |
| 3 | 1995-1996 | 11818 | 8499 |
| 4 | 1996-1997 | 13270 | 9036 |
| 5 | 1997-1998 | 15388 | 9288 |
| 6 | 1998-1999 | 17394 | 9733 |
| 7 | 1999-2000 | 18367 | 10306 |
| 8 | 2000-2001 | 20367 | 10754 |
| 9 | 2001-2002 | 21239 | 10774 |
| 10 | 2002-2003 | 21738 | 10964 |
Source: Statistical Hand Book of Tamil Nadu 2003