- The modal preferences of the commuters in the CMA are best characterised in that in a group of 100, 26 travel by bus, 2 by train, 33 by walk, 13 by cycle, 19 by two wheeler, 4 by car and 3 by other modes (vide Table -1).
| (Trips in million) | |||||||||||
| Sl. No. | Mode | No. & percent of total trips by mode | |||||||||
| 1970 | 1984 | 1992 | 2004 | 2005 | |||||||
| No. | % | No. | % | No. | % | No. | % | No. | % | ||
| 1 | Bus | 1.10 | 41.5 | 3.074 | 45.5 | 2.84 | 37.9 | 2.89 | 29.0 | 2.47 | 25.8 |
| 2 | Train | 0.30 | 11.5 | 0.610 | 9.0 | 0.31 | 4.1 | 0.50 | 5.0 | 0.24 | 2.5 |
| 3 | Car/Taxi | 0.08 | 3.2 | 0.103 | 1.5 | 0.11 | 1.5 | 0.40 | 4.0 | 0.36 | 3.8 |
| 4 | Fast TW | 0.04 | 1.7 | 0.219 | 3.2 | 0.52 | 7.0 | 1.80 | 18.0 | 1.83 | 19.1 |
| 5 | Auto rickshaw | - | - | 0.024 | 0.4 | 0.16 | 2.2 | 0.20 | 2.0 | 0.29 | 3.0 |
| 6 | Bicycle | 0.57 | 21.3 | 0.720 | 10.7 | 1.06 | 14.2 | 1.30 | 13.0 | 1.23 | 12.8 |
| 7 | Cycle rickshaw & others | 0.00 | 0.1 | 0.105 | 1.6 | 0.24 | 3.5 | 0.10 | 1.0 | 0.03 | 0.3 |
| 8 | Walk | 0.55 | 20.7 | 1.895 | 28.1 | 2.21 | 29.5 | 2.79 | 28.0 | 3.14 | 32.7 |
| TOTAL | 2.65 | 100.0 | 6.750 | 100.0 | 7.45 | 100.0 | 9.98 | 100.0 | 9.59 | 100.0 | |
Source: MATS (1968-69), Short-term Traffic Improvement Programme Report (MMDA
& KCL, 1984) & CTTS (MMDA, RITES, KCL & PTCS, 1992-95), & Short term study to updateCTTS (1992-95)(CMDA, RITES & PTCS, 2004), HHI Survey of the DPR for the Chennai Metro Rail Project, DMRC, 2005
- The growth of sea and air traffic is briefly described as below:
Seaport terminals
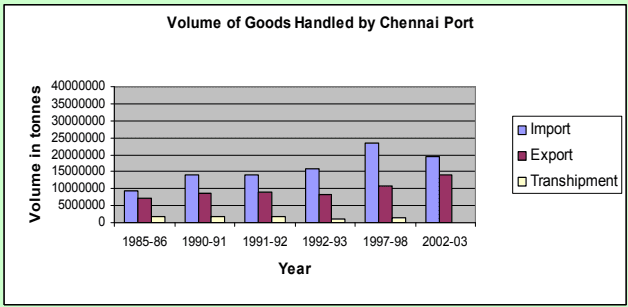
- The Chennai Port Trust (CPT) located in the CBD handled 33.69 million tonnes in 2002-2003. While the imports increased from 1.8 million to 19.61 million tonnes for the period 1951-52 to 2002-2003 registering a growth of 989%, the exports increased from 0.3 million to 14.1 million for the same period registering a growth of 4600%. Of the total import and export the foreign traffic handled accounts for 93% and the coastal traffic 7% for the year 2002-2003. While mineral oils and other POL account for 41% of the imports, iron-ore accounts for 56% of the exports (2002-2003). The imports are predominantly from south-east Asian countries accounting for 41% and the exports are made predominantly to Japan accounting for 14% (vide Table - 2).
| Year | Import | Export | Transshipment | Total (tonnes) |
|---|---|---|---|---|
| 1951-52 | 1,775,134 | 279,157 | -- | 2,054,291 |
| 1956-57 | 1,895,703 | 607,851 | -- | 2,503,554 |
| 1961-62 | 2,268,853 | 1,198,290 | -- | 3,467,143 |
| 1969-70 | 3,535,771 | 2,904,372 | 192,277 | 6,632,420 |
| 1974-75 | 4,760,511 | 3,155,479 | -- | 7,915,990 |
| 1980-81 | 6,412,177 | 3,962,562 | 72,736 | 10,44,475 |
| 1985-86 | 9,303,071 | 7,040,719 | 1,802,902 | 18,146,692 |
| 1990-91 | 14,124,933 | 8,642,713 | 1,749,944 | 24,517,590 |
| 1991-92 | 14,182,056 | 9,100,779 | 1,763,348 | 25,046,183 |
| 1992-93 | 15,680,715 | 8,439,962 | 1,209,354 | 25,330,031 |
| 1997-98 | 23,352,921 | 10,825,638 | 1,352,450 | 35,531,009 |
| 2002-03 | 19,605,661 | 14,081,445 | -- | 33,687,106 |
Source: Annual Report, Chennai Port Trust, 2004
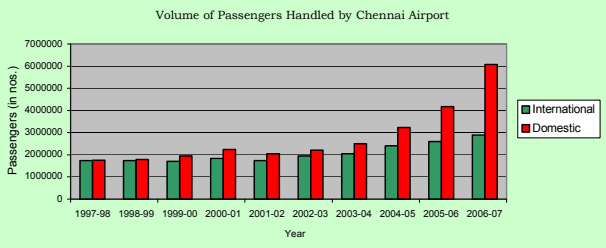
Airport terminals
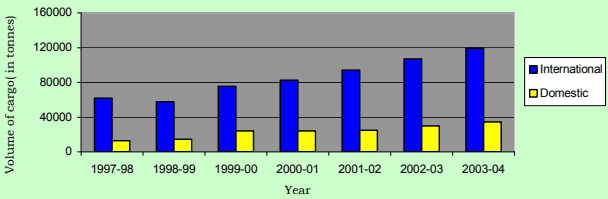
- Chennai has a national air terminal viz. Kamarajar Domestic Terminal and an international terminal viz. Anna International Terminal located at Meenambakkam. Totally 20 international flights per day are operated from Chennai. While the growth of international traffic is 5%, that of the national air traffic is 7%. The AAI imports 44,000 to 51,000 tonnes of cargo per year and exports 63,000 to 68,000 tonnes per year. While the growth of international passenger movement is 17.8% for the period 1997-98 to 2003-2004, the growth of passenger traffic within the country is 42.5%. Similarly the growth of international cargo movement is 93% for the same period and that within the country is 167% (vide Table -4).
| Year | International | Domestic | Total | |
|---|---|---|---|---|
| Aircraft movements (Nos.) | 1997-98 | 10862 | 20231 | 31093 |
| 1998-99 | 11169 | 19813 | 30982 | |
| 1999-00 | 11080 | 23531 | 34611 | |
| 2000-01 | 12063 | 25293 | 37356 | |
| 2001-02 | 12398 | 25673 | 38071 | |
| 2002-03 | 14490 | 29863 | 44353 | |
| 2003-04 | 14515 | 36749 | 51264 | |
| 2004-05 | 18111 | 43122 | 61233 | |
| 2005-06 | 21155 | 47900 | 69055 | |
| 2006-07 | 23567 | 76162 | 99729 | |
| Passenger movements (Nos.) | 1997-98 | 1744037 | 1755854 | 3499891 |
| 1998-99 | 1736021 | 1788005 | 3524026 | |
| 1999-00 | 1702534 | 1945587 | 3648121 | |
| 2000-01 | 1837954 | 2235011 | 4072965 | |
| 2001-02 | 1741458 | 2042784 | 3784242 | |
| 2002-03 | 1947937 | 2213409 | 4161346 | |
| 2003-04 | 2054043 | 2501778 | 4555821 | |
| 2004-05 | 2400670 | 3233256 | 5633926 |